|
The bulk of fourth-quarter economic data are now out. Yes, the results are unspectacular but there's still plenty of surprises, and many of them positive! No surprise, however, is strength from a consumer who has jobs and is unusually confident in the outlook and is providing a floor for the economy.
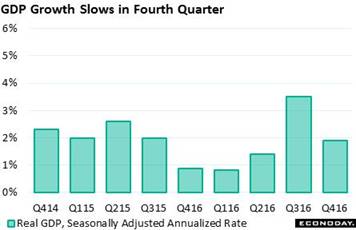 GDP could manage only a 1.9 percent annualized inflation-adjusted pace in the fourth quarter, well off the third quarter's strong 3.5 percent showing. Exports subtracted a sharp 1.7 percentage points from the fourth quarter in, however, a comparison anomaly against a rare spike in soybean exports during the third quarter. The soybean, of course, is important but a truer trend for exports is offered by services which posted a respectable 0.9 percent gain. This is a reminder that foreign demand for U.S. technical and managerial services -- as opposed to manufacturing -- is a fundamental strength of the nation's trade picture. Another positive came from government purchases which added 2 tenths to the quarter (this is something to watch of course as fiscal stimulus gets underway). GDP could manage only a 1.9 percent annualized inflation-adjusted pace in the fourth quarter, well off the third quarter's strong 3.5 percent showing. Exports subtracted a sharp 1.7 percentage points from the fourth quarter in, however, a comparison anomaly against a rare spike in soybean exports during the third quarter. The soybean, of course, is important but a truer trend for exports is offered by services which posted a respectable 0.9 percent gain. This is a reminder that foreign demand for U.S. technical and managerial services -- as opposed to manufacturing -- is a fundamental strength of the nation's trade picture. Another positive came from government purchases which added 2 tenths to the quarter (this is something to watch of course as fiscal stimulus gets underway).
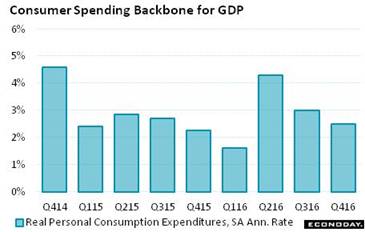 But it's really the consumer who is once again the hero of the quarter. Personal consumption expenditures rose at a real 2.5 percent annualized pace in the fourth quarter, down from 3.0 and 4.3 percent in the prior quarters but still solid and underscoring the consumer's support of the economy. Durable spending showed the biggest gain reflecting the quarter's great strength in auto sales. And another positive from the consumer is a bounce-back in residential investment, up 10.2 percent and back in the plus column after two negative quarters. But it's really the consumer who is once again the hero of the quarter. Personal consumption expenditures rose at a real 2.5 percent annualized pace in the fourth quarter, down from 3.0 and 4.3 percent in the prior quarters but still solid and underscoring the consumer's support of the economy. Durable spending showed the biggest gain reflecting the quarter's great strength in auto sales. And another positive from the consumer is a bounce-back in residential investment, up 10.2 percent and back in the plus column after two negative quarters.
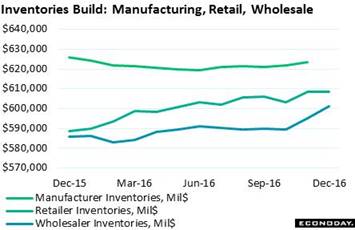 One very big positive that boosted GDP is actually, however, a major negative for first-quarter production and employment, and that's a steep rise in inventories which added 1.0 percentage point to the quarter. Relative to final demand, which could manage only a soft 0.9 percent gain, inventories look heavy and point to destocking for the first quarter. The accompanying graph tracks the three components of business inventories with wholesalers on a definite climb and with retailers having climbed but now leveling. One very big positive that boosted GDP is actually, however, a major negative for first-quarter production and employment, and that's a steep rise in inventories which added 1.0 percentage point to the quarter. Relative to final demand, which could manage only a soft 0.9 percent gain, inventories look heavy and point to destocking for the first quarter. The accompanying graph tracks the three components of business inventories with wholesalers on a definite climb and with retailers having climbed but now leveling.
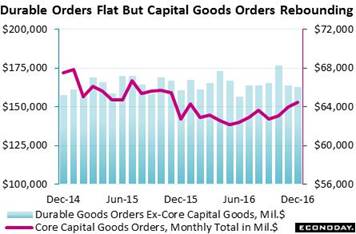 Like GDP, the components of the durable goods report also have to be sifted through. Even though December orders, pulled down by a swing lower in defense aircraft, slipped 0.4 percent, core capital goods orders rose 0.8 percent which is on top of an upward revised 1.5 percent gain in November. Year-on-year core capital goods orders (nondefense ex-aircraft) moved into the plus column for the first time since October 2015, at 2.8 percent to exceed total orders at 1.2 percent. The graph tracks monthly dollar levels of core capital goods (at $64.5 billion in December) against all other durable goods (at $162.5 billion). This swing higher for capital goods has contributed to three straight quarters of gains, though small ones, for nonresidential investment in the GDP report. But progess is progess. Like GDP, the components of the durable goods report also have to be sifted through. Even though December orders, pulled down by a swing lower in defense aircraft, slipped 0.4 percent, core capital goods orders rose 0.8 percent which is on top of an upward revised 1.5 percent gain in November. Year-on-year core capital goods orders (nondefense ex-aircraft) moved into the plus column for the first time since October 2015, at 2.8 percent to exceed total orders at 1.2 percent. The graph tracks monthly dollar levels of core capital goods (at $64.5 billion in December) against all other durable goods (at $162.5 billion). This swing higher for capital goods has contributed to three straight quarters of gains, though small ones, for nonresidential investment in the GDP report. But progess is progess.
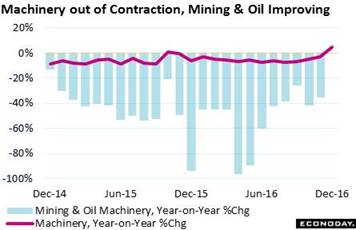 Giving capital goods its big boost is machinery where improvement in mining and energy equipment is underway. Machinery orders in December posted only their second year-on-year gain since October 2014 when the collapse from $100 oil first started to bite. Looking at the whole of the durables report, the rare wildcard the last two months has been defense aircraft which is usually a side show compared to civilian aircraft. Excluding all aircraft and all other transportation equipment as well, orders rose a solid 0.5 percent in December following an even stronger 1.0 percent rise in November. Giving capital goods its big boost is machinery where improvement in mining and energy equipment is underway. Machinery orders in December posted only their second year-on-year gain since October 2014 when the collapse from $100 oil first started to bite. Looking at the whole of the durables report, the rare wildcard the last two months has been defense aircraft which is usually a side show compared to civilian aircraft. Excluding all aircraft and all other transportation equipment as well, orders rose a solid 0.5 percent in December following an even stronger 1.0 percent rise in November.
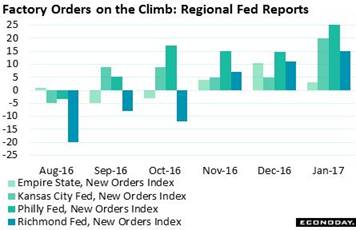 And no details are needed to see the strength that's appearing in advance indications on the factory sector. Philly Fed's superheated report at mid-month leads January's highlights and was followed by strong regional reports from Empire State, Kansas City and Richmond. New orders in these reports have turned the corner, ending long contraction and moving higher November through January. For the coming week the most closely watched new orders reading will be from the January ISM manufacturing report, one that in December spiked to its highest level since November 2014. And no details are needed to see the strength that's appearing in advance indications on the factory sector. Philly Fed's superheated report at mid-month leads January's highlights and was followed by strong regional reports from Empire State, Kansas City and Richmond. New orders in these reports have turned the corner, ending long contraction and moving higher November through January. For the coming week the most closely watched new orders reading will be from the January ISM manufacturing report, one that in December spiked to its highest level since November 2014.
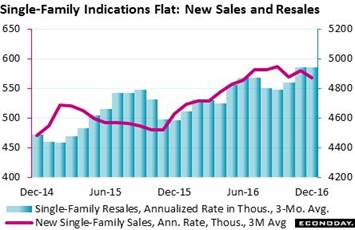 There may be signs of life in the factory sector but there's a little less life in housing. Mortgage rates are a risk to the sector and may already be slowing sales. Single-family resales, following no change in November, fell 1.8 percent in December to a 4.88 million annualized rate. Sales of new single-family homes were also down and very sharply, 10.4 percent lower to a 536,000 annualized rate. Three-month averages, as tracked in the graph, help smooth out what can be rough turbulence in month-to-month housing data especially during the winter months. The picture that emerges is less dramatic, a housing sector sitting at cycle peaks — but not moving any higher. There may be signs of life in the factory sector but there's a little less life in housing. Mortgage rates are a risk to the sector and may already be slowing sales. Single-family resales, following no change in November, fell 1.8 percent in December to a 4.88 million annualized rate. Sales of new single-family homes were also down and very sharply, 10.4 percent lower to a 536,000 annualized rate. Three-month averages, as tracked in the graph, help smooth out what can be rough turbulence in month-to-month housing data especially during the winter months. The picture that emerges is less dramatic, a housing sector sitting at cycle peaks — but not moving any higher.
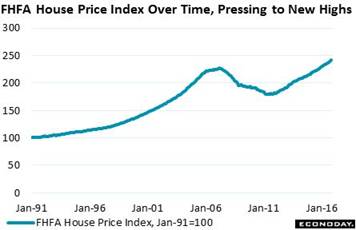 One of the reasons behind the stalling in home sales is actually a positive, that is higher prices. The FHFA house price index for November, which tracks single-family housing, rose a solid 0.5 percent with the year-on-year rate holding above the 6 percent line at 6.1 percent. Six percent may not sound like much but it's not a bad return in a low interest-rate economy. Prices in the new home sales report also show strength, at a median $322,500 for a year-on-year 7.9 percent gain. But resale appreciation is softer, at $232,000 for a 4.0 percent gain, though prices here are certain to find support from what the National Association of Realtors describes as historically low levels of supply for existing homes (3.6 months at the current sales rate). One of the reasons behind the stalling in home sales is actually a positive, that is higher prices. The FHFA house price index for November, which tracks single-family housing, rose a solid 0.5 percent with the year-on-year rate holding above the 6 percent line at 6.1 percent. Six percent may not sound like much but it's not a bad return in a low interest-rate economy. Prices in the new home sales report also show strength, at a median $322,500 for a year-on-year 7.9 percent gain. But resale appreciation is softer, at $232,000 for a 4.0 percent gain, though prices here are certain to find support from what the National Association of Realtors describes as historically low levels of supply for existing homes (3.6 months at the current sales rate).
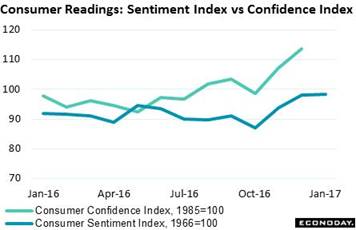 Now back to the big positive and the theme of the week, and that's the consumer. Underpinned by the best income outlook in a decade, the consumer sentiment index closed out another strong month, at 98.5 in January and inching to a post-election best and new cycle high. Something to note, however, is that the sample shows unusually deep divergence: strong optimism among Republicans offsetting pessimism among Democrats. But on the whole, strength is the message and, in a reminder of mortgage rates in the housing market, 20 percent of the sample says it's a good idea to borrow in advance of possible rate increases, a 20-year high for this reading. Now back to the big positive and the theme of the week, and that's the consumer. Underpinned by the best income outlook in a decade, the consumer sentiment index closed out another strong month, at 98.5 in January and inching to a post-election best and new cycle high. Something to note, however, is that the sample shows unusually deep divergence: strong optimism among Republicans offsetting pessimism among Democrats. But on the whole, strength is the message and, in a reminder of mortgage rates in the housing market, 20 percent of the sample says it's a good idea to borrow in advance of possible rate increases, a 20-year high for this reading.
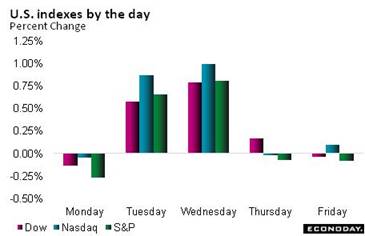 The economic data have been mixed enough to more or less insure that the Federal Reserve will refrain from raising rates at the coming FOMC meeting. There's talk of course for 3 rate hikes this year and new talk that the Fed may soon hint at reducing the amount of bonds it buys. This pulling back in stimulus is based on the prospect that inflation, pressured by full employment, will begin to accelerate. Yet raising rates could slow the jobs market and also raise demand for the dollar, outcomes that could, it would seem, be in conflict with the aims of the new administration. Tough trade talk from President Trump didn't hold back the stock market where the Dow broke through 20,000 for the first time, ending the week near its highs at 20,093 for a 1.3 percent weekly gain. The economic data have been mixed enough to more or less insure that the Federal Reserve will refrain from raising rates at the coming FOMC meeting. There's talk of course for 3 rate hikes this year and new talk that the Fed may soon hint at reducing the amount of bonds it buys. This pulling back in stimulus is based on the prospect that inflation, pressured by full employment, will begin to accelerate. Yet raising rates could slow the jobs market and also raise demand for the dollar, outcomes that could, it would seem, be in conflict with the aims of the new administration. Tough trade talk from President Trump didn't hold back the stock market where the Dow broke through 20,000 for the first time, ending the week near its highs at 20,093 for a 1.3 percent weekly gain.
| Markets at a Glance |
Year-End |
Week Ended |
Week Ended |
Year-To-Date |
Weekly |
|
2016 |
20-Jan-17 |
27-Jan-17 |
Change |
Change |
| DJIA |
19,762.60 |
19,827.25 |
20,093.78 |
1.7% |
1.3% |
| S&P 500 |
2,238.83 |
2,271.31 |
2,294.69 |
2.5% |
1.0% |
| Nasdaq Composite |
5,383.12 |
5,555.33 |
5,660.78 |
5.2% |
1.9% |
|
|
|
|
|
|
| Crude Oil, WTI ($/barrel) |
$53.71 |
$52.33 |
$53.12 |
-1.1% |
1.5% |
| Gold (COMEX) ($/ounce) |
$1,152.50 |
$1,209.00 |
$1,193.00 |
3.5% |
-1.3% |
|
|
|
|
|
|
| Fed Funds Target |
0.50 to 0.75% |
0.50 to 0.75% |
0.50 to 0.75% |
0 bp |
0 bp |
| 2-Year Treasury Yield |
1.21% |
1.20% |
1.23% |
2 bp |
3 bp |
| 10-Year Treasury Yield |
2.45% |
2.47% |
2.49% |
4 bp |
2 bp |
| Dollar Index |
102.26 |
101.24 |
100.56 |
-1.7% |
-0.7% |
Expectations for higher interest rates have yet to pull forward home sales though auto sales haven't been suffering. Housing and factory sectors were both uneven at the 2016 finish line, yet business investment may be the economy's new theme along with consumer strength, of course, the old.
A week that has everything starts with personal income & outlays on Monday which will break out December's consumer detail. Pending home sales follow mid-morning Monday in what will be a key indication for the still struggling resale market. Inflation is Tuesday's theme led off by the employment cost index, which has been showing pressure, and Case-Shiller home-price data which have not. Inflation expectations follow later Tuesday with consumer confidence where a leveling of post-election spirits is expected. The FOMC is Wednesday's highlight but is not expected to result in any action. Starting off Wednesday will be ADP's employment estimate and the ISM manufacturing report, both of which are expected to show strength. Winding up Wednesday will be unit vehicle sales for January which are expected to slow from their very strong December pace. Thursday looks light with productivity expected to be soft and costs expected to rise, while Friday is very heavy led by January employment, where strength is expected and where, importantly, minimum wage pressure is a wildcard for average hourly earnings. Factory orders and the ISM non-manufacturing report follow on Friday. If the data come in as expected, the week will point to a solid opening for the first quarter.
Personal Income for December
Consensus Forecast, Month-to-Month Change: 0.4%
Consensus Range: 0.3% to 0.6%
Consumer Spending
Consensus Forecast: 0.5%
Consensus Range: 0.3% to 0.6%
PCE Price Index
Consensus Forecast: 0.2%
Consensus Range: 0.1% to 0.3%
Core PCE Price Index
Consensus Forecast: 0.2%
Consensus Range: 0.0% to 0.3%
Strength in vehicle sales points to a jump in durable goods spending and in turn a strong gain for December consumer spending which forecasters see rising 0.5 percent. Personal income is expected to bounce back from a weak November with the consensus at plus 0.4 percent. PCE price indexes have been flat but year-on-year rates, boosted from easier comparisons, have been moving toward the Fed's 2 percent target. On a monthly basis, the PCE price index is seen rising 0.2 percent in December with the PCE core index also seen up 0.2 percent. Note the report will offer a December breakdown of consumer data previously released in the fourth-quarter GDP report.
Pending Home Sales Index for December
Consensus Forecast, Month-to-Month Change: 0.6%
Consensus Range: -1.8% to 1.5%
Housing indicators for the most part have been showing strength but not the pending home sales index which tracks initial contract signings for resales and was very soft in October and November. But forecasters see a bounce for December, predicting a consensus rise of 0.6 percent that in turn would point to a bounce higher for final sales of existing homes.
Employment Cost Index for 4th Quarter
Consensus Forecast, Quarter-to-Quarter Change: 0.6%
Consensus Range: 0.6% to 0.8%
The employment cost index has been showing pressure, rising 0.6 percent in each of the prior three quarters with forecasters seeing yet another 0.6 percent rise in the fourth quarter. The year-on-year rate has been moving higher, at plus 2.3 percent the last two reports. The two components -- wages & salaries and benefits -- have been showing similar levels of pressure. Putting aside prospects of job expansion under the new administration, the risk exists that tight conditions in the labor market are already raising employer costs.
Case-Shiller, 20-City Adjusted Index for November
Consensus Forecast, Month-to-Month Change: 0.7%
Consensus Range: 0.4% to 0.7%
Case-Shiller, 20-City Unadjusted Index
Consensus Forecast, Year-on-Year Change: 5.0%
Consensus Range: 5.0% to 5.4%
Annual growth in the Case-Shiller 20-city index has been flat at just above 5 percent, about 1 percentage point below the FHFA house price index. But Case-Shiller's monthly index did show acceleration in the prior two reports and the Econoday consensus is calling for a bit more strength in November, at a consensus gain of 0.7 percent. But in an offset, the year-on-year rate is expected to ease 1 tenth to 5.0 percent.
Chicago PMI for January
Consensus Forecast: 55.2
Consensus Range: 54.7 to 57.0
The Chicago PMI fell 2.4 points higher in December to a still solid 54.6 though growth in new orders slowed and backlog orders moved back into contraction. Forecasters see a modest bounce back higher for January, at a consensus 55.2.
Consumer Confidence Index for January
Consensus Forecast: 112.2
Consensus Range: 110.0 to 114.0
The Conference Board's consumer confidence index has easily beat expectations the last two reports, by more than 6 points in December and more than 5 points in November. Forecasters are calling for an edging back in January to 112.2 from February's 113.7 in what would mark a topping out in the post-election run. Despite the enormous strength in confidence, recent strength in consumer spending has been limited.
Total Vehicle Sales for January
Consensus Forecast, Annualized Rate: 17.7 million
Consensus Range: 17.0 to 18.2 million
Unit vehicle sales correctly foreshadowed what was a swing higher for the motor vehicle component of the December retail sales report and before that a swing lower in November. December unit sales rose sharply to a cycle best 18.4 million annualized rate. Econoday forecasters are looking for give back in January with the consensus at 17.7 million. Vehicle sales were solid throughout 2016 but still down from 2015's exceptionally strong rates.
ADP, Private Payrolls for January
Consensus Forecast: 168,000
Consensus Range: 160,000 to 185,000
ADP's employment estimate overestimated private payroll growth in both November and December, but not by much. Forecasters expect ADP's estimate to come in at 168,000 in what would signal improved strength for the January employment report.
ISM Manufacturing Index for January
Consensus Forecast: 55.0
Consensus Range: 54.0 to 56.8
The ISM manufacturing index has beaten the consensus the last four reports and by a sizable 9 tenths in the last two reports. New orders jumped to a 2-year high in December with export orders at a 2-1/2 year high. Indications of strength have also been coming from input costs which posted a 5-1/2 year high. Forecasters are calling for steady strength in the January report, at a consensus 55.0 vs December's 54.7.
Construction Spending for December
Consensus Forecast, Month-to-Month Change: 0.2%
Consensus Range: -0.4% to 0.8%
Construction spending had been flat through most of 2016 but appeared to pick up steam late in the year. Non-residential spending held mixed but residential spending on single-family homes jumped a combined 2.6 percent in October and November. December's single-family strength, however, is in question given the month's weakness in single-family starts (data released in the housing starts report). The Econoday consensus for December construction spending calls for sharp slowing, to a 0.2 percent gain vs November's 0.9 percent rise.
Federal Funds Rate Target for January 31 & February 1 Meeting:
Consensus Forecast, Midpoint: 0.625%
Consensus Range: 0.50% to 0.75%
After lifting rates in December for only the second time this cycle, the FOMC is expected to hold policy steady at the January 31 and February 1 meeting. The beige book (prepared for this meeting) described economic activity as no better than modest to moderate though it did cite the sharp improvement in business expectations. Labor market strength and related wage inflation were also cited. At the last meeting in December, questions over the effects of new fiscal stimulus under the Trump administration were not highlighted, a meeting that also included a press conference and forecast updates. This meeting will include only a statement.
Initial Jobless Claims for January 28 week
Consensus Forecast: 253,000
Consensus Range: 250,000 to 258,000
Initial jobless claims jumped 22,000 to a higher-than-expected 259,000 in the January 21 week and forecasters see an easing back down in the January 28 week, down a consensus 6,000 to 253,000. Claims data have been very low and consistent with strong demand for labor.
Nonfarm Productivity, 1st Estimate, Fourth Quarter
Consensus Forecast, Annualized Rate: 1.2%
Consensus Range: 0.6% to 2.6%
Unit Labor Costs
Consensus Forecast, Annualized Rate: 1.8%
Consensus Range: 1.0% to 2.4%
Non-farm productivity jumped out of its slump in the third quarter as output accelerated and hours worked slowed. Output, however, in the fourth quarter was not as strong as the third, pointing to slowing for productivity and increases for labor costs. Forecasters see nonfarm productivity rising 1.2 percent vs a 3.1 percent gain in the third quarter. Unit labor costs are expected to increase 1.8 percent vs 0.7 percent.
Nonfarm Payrolls for January
Consensus Forecast: 175,000
Consensus Range: 155,000 to 195,000
Private Payrolls
Consensus Forecast: 170,000
Consensus Range: 154,000 to 185,000
Unemployment Rate
Consensus Forecast: 4.7%
Consensus Range: 4.6% to 4.7%
Average Hourly Earnings
Consensus Forecast: 0.3%
Consensus Range: 0.2% to 0.4%
Average Workweek
Consensus Forecast: 34.4 hours
Consensus Range: 34.3 to 34.4 hours
The Econoday consensus for January nonfarm payrolls is a solid 175,000, up from December growth of 156,000. The consensus for the unemployment rate is 4.7 percent, unchanged from December. With unemployment low, wage data will be getting increasing scrutiny and average hourly earnings are expected to rise a sizable 0.3 percent in January vs December's outsized 0.4 percent increase. Possibly adding to January's pressure were state-level minimum wage increases. The average workweek is expected to rise 1 tenth to 34.4 hours.
Factory Orders for December
Consensus Forecast, Month-to-Month Change: 0.9%
Consensus Range: -0.2% to 3.8%
Factory orders are expected to rise 0.9 percent as price-related gains for nondurable goods are expected to offset a 0.4 percent decline in the just released durables component of the report. Much of the weakness in the durables headline was tied to a monthly reversal in defense aircraft which masked solid improvement in other parts of the report especially for core capital goods (nondefense ex-aircraft).
ISM Non-Manufacturing Index for January
Consensus Forecast: 57.1
Consensus Range: 56.2 to 58.5
The ISM non-manufacturing index, at a very strong 57.2 in both December and November, has been pointing to acceleration for the bulk of the U.S. economy. New orders led December's report at 61.6 which points to strong activity through the January report. The Econoday consensus for January is 57.1.
|
