|
There may have been no economic pop at year end but there may be one underway right now. January's job growth, at 227,000 for nonfarm payrolls, was 50,000 above last year's monthly average and it did not result in increasing wage pressures, rather the contrary. With 4.8 percent unemployment already at target and with the Trump administration promising a round of aggressive fiscal stimulus, it seems a good time to look at how much slack there still is in the labor market.
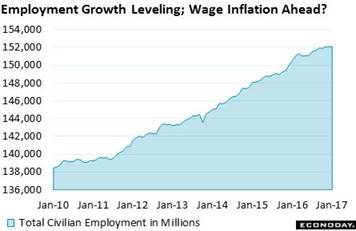 Let's put one month's gain in perspective. Total U.S. employment, those on payrolls together with those who are self employed, has grown from about 138 million at the beginning of the expansion in 2010 to 152 million in the January employment report. Growth started out slowly this cycle before accelerating in late 2011 and it rose steadily until last year when it slowed again, slowing that has raised concern over an aging population and an aging business cycle that is no longer able to accommodate sharp job growth. Let's put one month's gain in perspective. Total U.S. employment, those on payrolls together with those who are self employed, has grown from about 138 million at the beginning of the expansion in 2010 to 152 million in the January employment report. Growth started out slowly this cycle before accelerating in late 2011 and it rose steadily until last year when it slowed again, slowing that has raised concern over an aging population and an aging business cycle that is no longer able to accommodate sharp job growth.
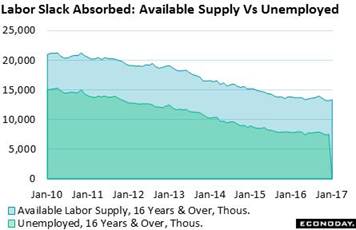 How much slack there is in the labor market depends of course on the number of people there are who want to work. The green area in the graph tracks those who are unemployed but actively looking for work, at 7.6 million in January's count and the number used to calculate the unemployment rate. The blue, the larger area, tracks those who are available to work including those not actively looking, at 13.4 million (this group includes for instance discouraged workers). The smaller these pools of labor become, the more employers have to scramble and the stronger the workers' wage position becomes. And this is not only true for those looking for work but also for those who already have work and are looking for a raise. How much slack there is in the labor market depends of course on the number of people there are who want to work. The green area in the graph tracks those who are unemployed but actively looking for work, at 7.6 million in January's count and the number used to calculate the unemployment rate. The blue, the larger area, tracks those who are available to work including those not actively looking, at 13.4 million (this group includes for instance discouraged workers). The smaller these pools of labor become, the more employers have to scramble and the stronger the workers' wage position becomes. And this is not only true for those looking for work but also for those who already have work and are looking for a raise.
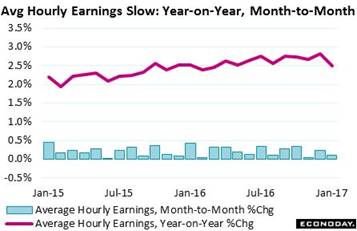 So where's the wage pressure? It has suddenly faded with January average hourly earnings managing only a 0.1 percent gain and with the prior month revised a sharp 2 tenths lower to 0.2 percent. And the year-on-year rate, which had been skirting the 3 percent line in December's initial data, is now back to 2.5 percent and where it was back in March. This is the big surprise of the report, even an epiphany — that employment growth, after 7 years of convincing expansion, is not triggering a meaningful increase in wage pressures. So where's the wage pressure? It has suddenly faded with January average hourly earnings managing only a 0.1 percent gain and with the prior month revised a sharp 2 tenths lower to 0.2 percent. And the year-on-year rate, which had been skirting the 3 percent line in December's initial data, is now back to 2.5 percent and where it was back in March. This is the big surprise of the report, even an epiphany — that employment growth, after 7 years of convincing expansion, is not triggering a meaningful increase in wage pressures.
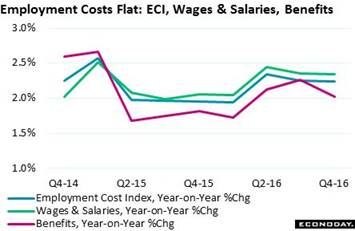 Employment costs, in fact, have not been accelerating at all, based on another set of data issued during the week, the employment cost report. Total costs to employers (blue line) grew at a year-on-year rate of only 2.2 percent in the fourth quarter which is right at the bottom of 34 years of data. The wages & salaries component (green line), which makes up 70 percent of the costs that employers pay, rose at 2.3 percent rate which is 1 tenth slower than the fourth quarter. But the benefits component is the surprise, slowing to 2.1 percent vs 2.3 percent in the third quarter. There are no advance warnings of wage inflation emanating from this report. Employment costs, in fact, have not been accelerating at all, based on another set of data issued during the week, the employment cost report. Total costs to employers (blue line) grew at a year-on-year rate of only 2.2 percent in the fourth quarter which is right at the bottom of 34 years of data. The wages & salaries component (green line), which makes up 70 percent of the costs that employers pay, rose at 2.3 percent rate which is 1 tenth slower than the fourth quarter. But the benefits component is the surprise, slowing to 2.1 percent vs 2.3 percent in the third quarter. There are no advance warnings of wage inflation emanating from this report.
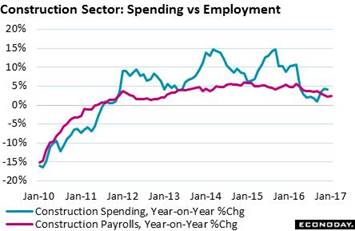 Construction payrolls were a positive surprise of the January employment report, rising 36,000 for the best gain since March. Construction was soft through most of last year though it did pick up at year end. December construction spending ended 2016 with a respectable 4.2 percent gain led by strength in multi-family units as well as commercial office units that helped offset weakness in public construction. But weakness in public construction is only temporary, based at least on the new administration's plans. For those keeping score, January construction payrolls stood at 6.8 million or 4.7 percent of all payrolls. This is up 1.4 million jobs from the recession low. Construction payrolls were a positive surprise of the January employment report, rising 36,000 for the best gain since March. Construction was soft through most of last year though it did pick up at year end. December construction spending ended 2016 with a respectable 4.2 percent gain led by strength in multi-family units as well as commercial office units that helped offset weakness in public construction. But weakness in public construction is only temporary, based at least on the new administration's plans. For those keeping score, January construction payrolls stood at 6.8 million or 4.7 percent of all payrolls. This is up 1.4 million jobs from the recession low.
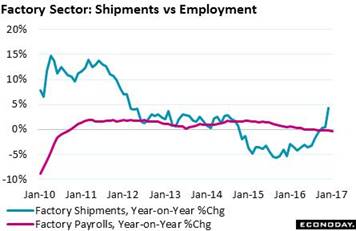 Factory employment has been outright weak, held down by energy equipment and of course by exports for a sector that's in the front line when it comes to global demand. Factory payrolls rose only 5,000 in January with the year-on-year rate (red line in graph) dipping below the zero line. But good news here, however temporary perhaps, comes from factory shipments which have been improving sharply even as new factory orders have sagged. How have manufacturers kept up shipments? By working down unfilled orders which fallen for six out of the last seven months in a trend that can't go on forever. Factory payrolls currently stand at 12.3 million or 8.5 percent of total employment for a gain of only 800,000 from their recession low. Factory employment has been outright weak, held down by energy equipment and of course by exports for a sector that's in the front line when it comes to global demand. Factory payrolls rose only 5,000 in January with the year-on-year rate (red line in graph) dipping below the zero line. But good news here, however temporary perhaps, comes from factory shipments which have been improving sharply even as new factory orders have sagged. How have manufacturers kept up shipments? By working down unfilled orders which fallen for six out of the last seven months in a trend that can't go on forever. Factory payrolls currently stand at 12.3 million or 8.5 percent of total employment for a gain of only 800,000 from their recession low.
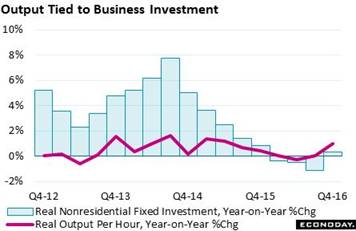 The factory sector takes a bit of the shine off the employment report and is also a reminder that constraints in the labor market, whether in numbers of available workers or in their skill sets, are negatives for output. And output data are soft as U.S. workers are taking more hours to produce goods and services at a slower rate. That's the story of this whole economic cycle. The graph tracks year-on-year change in business investment (blue columns) against output (red line), the latter getting a lift when investment turns higher. Though business investment was weak last year, indications from the capital goods readings in the factory orders report do point to a 2017 uplift and with it machine-based improvement in output. The factory sector takes a bit of the shine off the employment report and is also a reminder that constraints in the labor market, whether in numbers of available workers or in their skill sets, are negatives for output. And output data are soft as U.S. workers are taking more hours to produce goods and services at a slower rate. That's the story of this whole economic cycle. The graph tracks year-on-year change in business investment (blue columns) against output (red line), the latter getting a lift when investment turns higher. Though business investment was weak last year, indications from the capital goods readings in the factory orders report do point to a 2017 uplift and with it machine-based improvement in output.
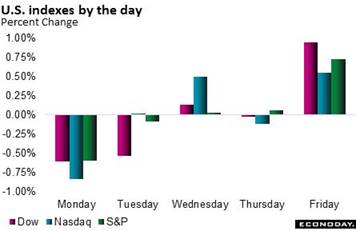 Markets were defensive through most of the week, backing off on tough trade talk from President Trump and showing no reaction to Wednesday's as-expected pass from the FOMC which left rates unchanged. But making for a Friday stock rally was the surprise strength of Friday's employment report, strength that perhaps should have been no surprise to the market at all given ADP's mid-week call for an outsized private payroll gain of 246,000, a gain by the way that officially came in at 237,000 and nearly 60,000 above expectations. There may be fewer ADP skeptics next month. Markets were defensive through most of the week, backing off on tough trade talk from President Trump and showing no reaction to Wednesday's as-expected pass from the FOMC which left rates unchanged. But making for a Friday stock rally was the surprise strength of Friday's employment report, strength that perhaps should have been no surprise to the market at all given ADP's mid-week call for an outsized private payroll gain of 246,000, a gain by the way that officially came in at 237,000 and nearly 60,000 above expectations. There may be fewer ADP skeptics next month.
| Markets at a Glance |
Year-End |
Week Ended |
Week Ended |
Year-To-Date |
Weekly |
|
2016 |
27-Jan-17 |
3-Feb-17 |
Change |
Change |
| DJIA |
19,762.60 |
20,093.78 |
20,071.46 |
1.6% |
-0.1% |
| S&P 500 |
2,238.83 |
2,294.69 |
2,297.42 |
2.6% |
0.1% |
| Nasdaq Composite |
5,383.12 |
5,660.78 |
5,666.77 |
5.3% |
0.1% |
|
|
|
|
|
|
| Crude Oil, WTI ($/barrel) |
$53.71 |
$53.12 |
$53.84 |
0.2% |
1.4% |
| Gold (COMEX) ($/ounce) |
$1,152.50 |
$1,193.00 |
$1,221.00 |
5.9% |
2.3% |
|
|
|
|
|
|
| Fed Funds Target |
0.50 to 0.75% |
0.50 to 0.75% |
0.50 to 0.75% |
0 bp |
0 bp |
| 2-Year Treasury Yield |
1.21% |
1.23% |
1.21% |
0 bp |
–2 bp |
| 10-Year Treasury Yield |
2.45% |
2.49% |
2.47% |
2 bp |
–2 bp |
| Dollar Index |
102.26 |
100.56 |
99.93 |
-2.3% |
-0.6% |
The January employment report offers good news for those still out of work, that employers are out hiring. But though it's hard to find the right person for the right job, employers are not yet bidding up wages which isn't such great news for most everyone except the FOMC. The lack of wage pressures could, like it did last year, allow the Fed to delay raising rates and allow the workforce to build without slowing. But how much the nation's workforce can continue to expand, however, is an unfolding story.
The first highlight of what looks to be a light week is Tuesday's trade report where much improvement, given the big jump in December auto imports, isn't expected. JOLTS follow later Tuesday morning and will offer the latest on the total number of job openings waiting to be filled, a number that may begin to approach 6 million. Consumer sentiment, on Friday, is expected to remain steady at post-election highs with little pressure seen for import prices, also out on Friday. Also of note is a small run of Fed speakers who may offer early commentary on the just concluded policy meeting.
International Trade Balance for December
Consensus Forecast: -$44.9 billion
Consensus Range: -$45.5 to -$42.0 billion
Advance data on goods trade in December showed a steep $65.0 billion deficit that was little changed from November. Exports of capital goods jumped in December but, in an offset, auto imports also jumped. When adding in the nation's surplus in services trade, forecasters see December's international trade deficit coming in little changed at $44.9 billion vs $45.2 billion in November.
Consumer Credit for December
Consensus Forecast: $20.0 billion
Consensus Range: $18.0 to $22.0 billion
Consumer credit is expected to rise $20.0 billion in December following November's outsized gain of $24.5 billion. Consumers are increasingly running up their credit cards based on the revolving credit component of this report which rose $11.0 billion November.
Initial Jobless Claims for February 4 week
Consensus Forecast: 250,000
Consensus Range: 245,000 to 250,000
Initial jobless claims are expected to come in little changed in the February 4 week, at 250,000 vs 246,000 in the prior week. Claims data have been very low and consistent with strong demand for labor.
Wholesale Inventories for December
Consensus Forecast, Month-to-Month Change: 1.0%
Consensus Range: 0.3% to 1.0%
Wholesale inventories are to expected to rise a very sharp 1.0 percent in December, the same gain posted in the advance report. Inventories have been on the rise and pose the risk of slowing in future production and employment.
Import Prices for January
Consensus Forecast, Month-to-Month Change: 0.3%
Consensus Range: 0.0% to 0.8%
Import prices and export prices have been on the rise with both in the year-on-year plus column for the first time since the oil collapse in July 2014. But outside of petroleum and petroleum-related components, pressure in this report has been marginal. The Econoday consensus calls for a modest 0.3 percent increase in January import prices.
Consumer Sentiment Index, Preliminary February
Consensus Forecast: 98.0
Consensus Range: 96.2 to 99.0
Consumer sentiment has been holding at its post-election highs and forecasters see little change for the preliminary February report with the consensus at 98.0 vs 98.5 for January's final reading. Confidence in future income is the strongest it has been in a decade though the sample is deeply partisan, split between optimism among Republicans and lack of optimism among Democrats.
|
