|
Forget about deregulation and fiscal stimulus, the biggest impact the new administration may have on the economy is in trade policy, specifically holding down imports and trying to increase exports. With all of 2016's numbers now officially in, let's look at some of the details of the U.S. trade situation.
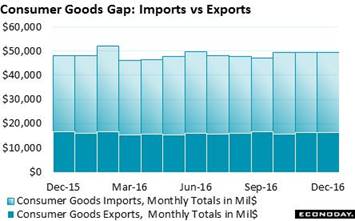 There's plenty of foreign demand for high-end U.S. capital goods and especially for our technical and managerial services. But consumer goods aren't part of this success story. Averaging a little more than $16 billion per month as tracked in the dark blue columns of the graph, the U.S. exported a total $194 billion of consumer goods last year. In contrast, imports of consumer goods averaged $49 billion per month for a 2016 total of $584 billion. That's a $390 billion annual deficit for consumer goods alone! There's plenty of foreign demand for high-end U.S. capital goods and especially for our technical and managerial services. But consumer goods aren't part of this success story. Averaging a little more than $16 billion per month as tracked in the dark blue columns of the graph, the U.S. exported a total $194 billion of consumer goods last year. In contrast, imports of consumer goods averaged $49 billion per month for a 2016 total of $584 billion. That's a $390 billion annual deficit for consumer goods alone!
 Vehicles are a separate and smaller category than consumer goods but the story, and lack of success, are the same. U.S. manufacturers could manage only $150 billion in exports last year or $12.5 billion per month, while imports came in at $350 billion or $29 billion per month. Adding up last year's $390 billion deficit in consumer goods with the deficit in vehicles, at $200 billion, it's a wonder that our total trade deficit was so small. Well actually not so small, at $454 billion in 2016 (which, in details that put everyone to sleep but forecasters, comes out to $38 billion per month). Vehicles are a separate and smaller category than consumer goods but the story, and lack of success, are the same. U.S. manufacturers could manage only $150 billion in exports last year or $12.5 billion per month, while imports came in at $350 billion or $29 billion per month. Adding up last year's $390 billion deficit in consumer goods with the deficit in vehicles, at $200 billion, it's a wonder that our total trade deficit was so small. Well actually not so small, at $454 billion in 2016 (which, in details that put everyone to sleep but forecasters, comes out to $38 billion per month).
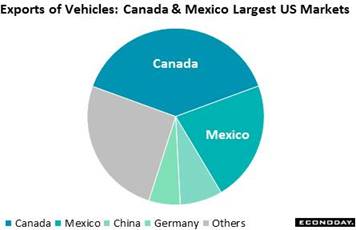 Vehicle exports may not be that great but the $150 billion total is still something. With President Trump targeting Mexican imports, it's fair to note that Mexico is the second largest buyer of U.S. vehicles. Vehicle exports to Mexico totaled $34 billion in 2016 for a 22 percent share of all U.S. vehicle exports. The biggest buyer of our vehicles is Canada, at $59 billion for a 39 percent share. Back in the far distance are China, at 8 percent, and Germany at 6 percent. Vehicle exports may not be that great but the $150 billion total is still something. With President Trump targeting Mexican imports, it's fair to note that Mexico is the second largest buyer of U.S. vehicles. Vehicle exports to Mexico totaled $34 billion in 2016 for a 22 percent share of all U.S. vehicle exports. The biggest buyer of our vehicles is Canada, at $59 billion for a 39 percent share. Back in the far distance are China, at 8 percent, and Germany at 6 percent.
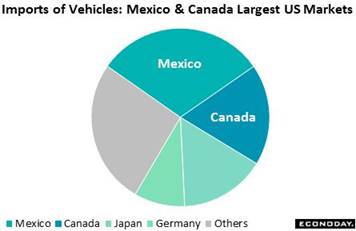 When dividing up last year's $350 billion of vehicle imports, Canada and Mexico swap positions with Mexico first at $108 billion for a 31 percent share of the U.S. import market which, for you careful readers taking notes, exceeds exports to Mexico by $74 billion. Canada, at 18 percent, is second followed by Japan, which makes the charts at 16 percent, and Germany at 9 percent. These numbers are reminders that, when it comes to vehicles at least, Mexico and Canada are far and away this nation's two busiest trading partners. When dividing up last year's $350 billion of vehicle imports, Canada and Mexico swap positions with Mexico first at $108 billion for a 31 percent share of the U.S. import market which, for you careful readers taking notes, exceeds exports to Mexico by $74 billion. Canada, at 18 percent, is second followed by Japan, which makes the charts at 16 percent, and Germany at 9 percent. These numbers are reminders that, when it comes to vehicles at least, Mexico and Canada are far and away this nation's two busiest trading partners.
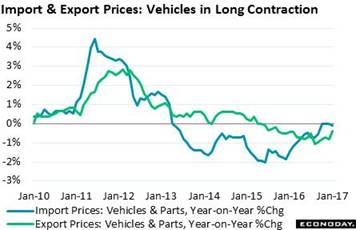 In an effort to boost exports, the Trump administration has been talking down the dollar (a lower dollar isn't really something to brag about but it does make U.S. goods and services less expensive to foreign buyers). The dollar appreciated sharply between 2014 to 2016, up 15 percent on the trade-weighted index. This has made our products more expensive but, in an offset typical of economics, has stretched our buying power for imports and, as we get more for less, has held down U.S. inflation. But price weakness isn't entirely tied to currency as prices for U.S. exports have also been falling. The graph tracks prices of imported and exported vehicles, both of which are very weak and raise the question whether soft global demand, and not so much currency effects, is really to blame. In an effort to boost exports, the Trump administration has been talking down the dollar (a lower dollar isn't really something to brag about but it does make U.S. goods and services less expensive to foreign buyers). The dollar appreciated sharply between 2014 to 2016, up 15 percent on the trade-weighted index. This has made our products more expensive but, in an offset typical of economics, has stretched our buying power for imports and, as we get more for less, has held down U.S. inflation. But price weakness isn't entirely tied to currency as prices for U.S. exports have also been falling. The graph tracks prices of imported and exported vehicles, both of which are very weak and raise the question whether soft global demand, and not so much currency effects, is really to blame.
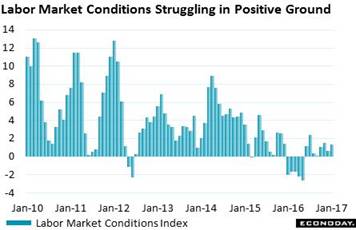 The week also included several jobs indicators including the labor market conditions index which remains soft, continuing to indicate that there's something not completely right with employment. Despite very strong nonfarm payroll growth of 227,000, the January index came in at a not-so-great 1.3 for one of the weakest readings of the 7-year economic cycle. Average hourly earnings were very soft in January, running at an annual rate of only 2.5 percent. The Fed needs a little breathing room and this index, as weak as it is, definitely provides a little. The LMCI is an eclectic blend of 19 separate indicators and Fedspeak references to it, given the slack it shows, could now begin to sound less scornful. The week also included several jobs indicators including the labor market conditions index which remains soft, continuing to indicate that there's something not completely right with employment. Despite very strong nonfarm payroll growth of 227,000, the January index came in at a not-so-great 1.3 for one of the weakest readings of the 7-year economic cycle. Average hourly earnings were very soft in January, running at an annual rate of only 2.5 percent. The Fed needs a little breathing room and this index, as weak as it is, definitely provides a little. The LMCI is an eclectic blend of 19 separate indicators and Fedspeak references to it, given the slack it shows, could now begin to sound less scornful.
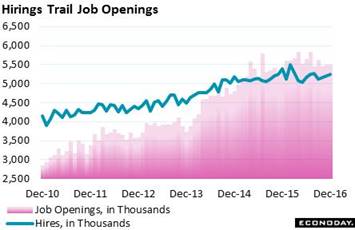 There's also something not right about the JOLTS report, and I'm not talking about the name (which by the way stands for the Job Openings and Labor Turnover Survey). About two years ago the number of job openings, jumping to roughly 5.5 million, overtook the number of monthly hirings, at a bit more than 5.0 million. The latest numbers are a little better but not much, at 5.5 million openings against 5.3 million hirings. This reluctance to hire raises the question of skills, that the 7.6 million unemployed actively looking for work may not be matching well with the openings. Another possibility, raised by the weakness in wages, is that employers aren't offering enough to draw workers off the unemployment lines. There's also something not right about the JOLTS report, and I'm not talking about the name (which by the way stands for the Job Openings and Labor Turnover Survey). About two years ago the number of job openings, jumping to roughly 5.5 million, overtook the number of monthly hirings, at a bit more than 5.0 million. The latest numbers are a little better but not much, at 5.5 million openings against 5.3 million hirings. This reluctance to hire raises the question of skills, that the 7.6 million unemployed actively looking for work may not be matching well with the openings. Another possibility, raised by the weakness in wages, is that employers aren't offering enough to draw workers off the unemployment lines.
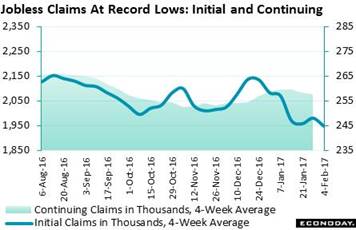 And unemployment lines are very short, as short as they've ever been. Initial claims fell 12,000 in the February 4 week to 234,000, the lowest reading since November and one of the lowest on record. The 4-week average, as tracked in the graph, is down 3,750 to 244,250 which is more than 10,000 below the month-ago trend and a new cycle low (since 1973). Continuing claims are also near record lows with this 4-week average, also tracked in the graph, down 4,000 to a 2.076 million level that is also 10,000 below the month-ago trend. Though wages are flat and remain a mystery, claims are at the forefront of data pointing to solid demand for labor. And unemployment lines are very short, as short as they've ever been. Initial claims fell 12,000 in the February 4 week to 234,000, the lowest reading since November and one of the lowest on record. The 4-week average, as tracked in the graph, is down 3,750 to 244,250 which is more than 10,000 below the month-ago trend and a new cycle low (since 1973). Continuing claims are also near record lows with this 4-week average, also tracked in the graph, down 4,000 to a 2.076 million level that is also 10,000 below the month-ago trend. Though wages are flat and remain a mystery, claims are at the forefront of data pointing to solid demand for labor.
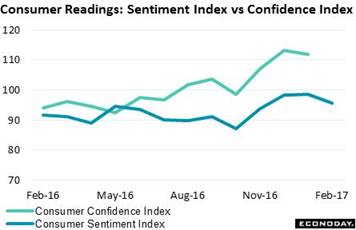 High levels of employment have been, of course, strongly positive for consumer confidence. But the week's news includes a downgrade for the consumer sentiment index which eased back to 95.7 in the preliminary February reading. This is several points lower than the post-election scores but still well higher than the mid-year trend. The downgrade is centered entirely in the expectations index which the report describes as strongly polarized between Republicans, whose scores are near record highs, and Democrats whose scores are near record lows. And the report further warns that negative rather than positive expectations are likely more influential in determining the strength of consumer spending. Yet the warnings aside, readings in this report are much more favorable than not with virtually no erosion in current conditions, an index offering an immediate indication on ongoing spending. High levels of employment have been, of course, strongly positive for consumer confidence. But the week's news includes a downgrade for the consumer sentiment index which eased back to 95.7 in the preliminary February reading. This is several points lower than the post-election scores but still well higher than the mid-year trend. The downgrade is centered entirely in the expectations index which the report describes as strongly polarized between Republicans, whose scores are near record highs, and Democrats whose scores are near record lows. And the report further warns that negative rather than positive expectations are likely more influential in determining the strength of consumer spending. Yet the warnings aside, readings in this report are much more favorable than not with virtually no erosion in current conditions, an index offering an immediate indication on ongoing spending.
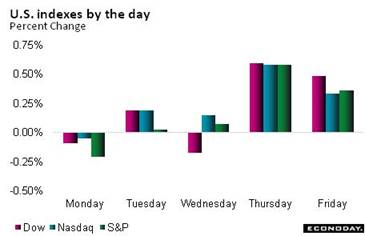 Selling of French bonds and also periphery European bonds was one of the week's market theme. France is the next battleground for the Brexit/Trump momentum and the election there, which is just unfolding, has been increasing demand, not only for the safety of German Bunds, but also for U.S. Treasuries. The 10-year U.S. Treasury yield fell 6 basis points in the week 2.41 percent. It was a very strong week for the stock market which got a lift from Trump's promise to unveil very soon a "phenomenal" new plan for corporate taxes. Leading indexes posted records including the Dow which ended the week 1.0 percent higher at a new high of 20,269. Selling of French bonds and also periphery European bonds was one of the week's market theme. France is the next battleground for the Brexit/Trump momentum and the election there, which is just unfolding, has been increasing demand, not only for the safety of German Bunds, but also for U.S. Treasuries. The 10-year U.S. Treasury yield fell 6 basis points in the week 2.41 percent. It was a very strong week for the stock market which got a lift from Trump's promise to unveil very soon a "phenomenal" new plan for corporate taxes. Leading indexes posted records including the Dow which ended the week 1.0 percent higher at a new high of 20,269.
| Markets at a Glance |
Year-End |
Week Ended |
Week Ended |
Year-To-Date |
Weekly |
|
2016 |
3-Feb-17 |
10-Feb-17 |
Change |
Change |
| DJIA |
19,762.60 |
20,071.46 |
20,269.37 |
2.6% |
1.0% |
| S&P 500 |
2,238.83 |
2,297.42 |
2,316.10 |
3.5% |
0.8% |
| Nasdaq Composite |
5,383.12 |
5,658.00 |
5,734.13 |
6.5% |
1.3% |
|
|
|
|
|
|
| Crude Oil, WTI ($/barrel) |
$53.71 |
$53.84 |
$53.80 |
0.2% |
-0.1% |
| Gold (COMEX) ($/ounce) |
$1,152.50 |
$1,221.00 |
$1,234.90 |
7.1% |
1.1% |
|
|
|
|
|
|
| Fed Funds Target |
0.50 to 0.75% |
0.50 to 0.75% |
0.50 to 0.75% |
0 bp |
0 bp |
| 2-Year Treasury Yield |
1.21% |
1.21% |
1.20% |
–1 bp |
–1 bp |
| 10-Year Treasury Yield |
2.45% |
2.47% |
2.41% |
–4 bp |
–6 bp |
| Dollar Index |
102.26 |
99.93 |
100.76 |
-1.5% |
0.8% |
Strong appetite for foreign consumer goods and vehicles remains a structural imbalance of the nation's economy. But this is only one imbalance. The government's budget deficit is another of roughly the same size. A significant offset to these imbalances, however, has been strong foreign demand for U.S. Treasuries and for agency bonds as well as U.S. corporate bonds, but this is a story for next week and the Treasury International Capital report.
The first highlight of a heavy week comes Tuesday with Janet Yellen's semi-annual testimony before the Senate Banking Committee followed on Wednesday by her testimony before the House Financial Services Committee. Fedspeak can be very narrow and predictable but commentary often opens up at congressional hearings. Wednesday also sees retail sales, where headline weakness is seen masking interior strength, and also consumer prices where headline strength is seen masking interior weakness. Industrial production will also be out on Wednesday and the manufacturing component, which has been flat, is expected to remain flat. Thursday will see housing starts & permits where gains are expected and also the Philly Fed which, in contrast to the industrial production report, has been signaling unusual strength for the manufacturing sector.
Small Business Optimism Index for January
Consensus Forecast: 104.5
Consensus Range: 103.0 to 105.0
The small business optimism index jumped sharply in December to 105.8, the best level since December 2004 with strength centered squarely in the economic outlook. The January index is expected to edge back to what would still be a very strong 104.5.
PPI-FD for January
Consensus Forecast, Month-to-Month Change: 0.3%
Consensus Range: 0.2% to 0.4%
PPI-FD Less Food & Energy
Consensus Forecast, Month-to-Month Change: 0.2%
Consensus Range: 0.1% to 0.2%
PPI-FD Less Food, Energy, & Trade Services
Consensus Forecast, Month-to-Month Change: 0.2%
Consensus Range: 0.1% to 0.3%
Higher oil prices drove up last week's import price report and are expected to boost headline PPI-FD where the January consensus is 0.3 percent. Less pressure is seen when excluding food & energy with this consensus at 0.2 percent which is also the consensus when excluding food, energy, and also trade services. Most readings in this report have been flat though easy comparisons with last year's lower oil prices are positives for coming reports.
Consumer Price Index for January
Consensus Forecast, Month-to-Month Change: 0.3%
Consensus Range: 0.2% to 0.4%
CPI Core, Less Food & Energy
Consensus Forecast, Month-to-Month Change: 0.2%
Consensus Range: 0.2% to 0.3%
Consumer prices have been edging slowly higher though the overall year-on-year rate, due to easy comparisons against weak energy prices this time last year, has been accelerating. Forecasters see January's monthly rate rising a tangible 0.3 percent with the core rate (less food & energy) edging 0.2 percent higher.
Retail Sales for January
Consensus Forecast: 0.1%
Consensus Range: -0.2% to 0.3%
Retail Sales Ex-Autos
Consensus Forecast: 0.5%
Consensus Range: 0.3% to 0.7%
Retail Sales Ex-Autos Ex-Gas
Consensus Forecast: 0.3%
Consensus Range: 0.2% to 0.4%
Retail Sales Control Group (Ex-Food Services, Ex-Autos, Ex-Gas, Ex-Building Materials)
Consensus Forecast: 0.4%
Consensus Range: 0.3% to 0.4%
Auto sales were the great standout of the December retail sales report with forecasters seeing a shift in January to non-auto sales. Unit sales of autos in January couldn't match December's pace which points to headline weakness for retail sales where forecasters are calling for only a 0.1 percent gain. But when excluding autos, the consensus is calling for a sizable 0.5 percent increase. Ex-auto ex-gas sales are expected to rise a respectable 0.3 percent with the control group up a solid 0.4 percent.
Empire State Index for February
Consensus Forecast: 7.5
Consensus Range: 5.5 to 9.0
The Empire State report has been sending solid indications of acceleration in the manufacturing sector. Inventory building and strong optimism in the 6-month outlook are recent strengths. Forecasters see the index posting a 4th straight month in the plus column, at 7.5 in a report that will offer some of the first indications on February activity.
Industrial Production for January
Consensus Forecast, Month-to-Month Change: 0.0%
Consensus Range: -0.6% to 0.2%
Manufacturing Production
Consensus Forecast, Month-to-Month Change: 0.2%
Consensus Range: -0.1% to 0.4%
Capacity Utilization Rate
Consensus Forecast: 75.5%
Consensus Range: 75.0% to 75.6%
Putting big utility swings aside and focusing on manufacturing, the industrial production report has not been showing much strength. The manufacturing component, despite solid gains for auto production, has been struggling to stay in positive ground, coming in at only plus 0.2 percent in December following a 0.1 percent decline in November. Weakness here in part reflects weakness in exports. Forecasters see manufacturing doing no better than repeating December's 0.2 percent performance with overall production unchanged. The capacity utilization rate is expected to hold at December's 75.5 percent.
Business Inventories for December
Consensus Forecast, Month-to-Month Change: 0.4%
Consensus Range: 0.2% to 0.5%
Forecasters see business inventories rising 0.4 percent in December following November's large 0.7 percent build. High inventories are a plus for the GDP calculation but unwanted inventories, which pile up when demand is soft, pose a risk to future production and employment.
Housing Market Index for February
Consensus Forecast: 68
Consensus Range: 67 to 69
The housing market index has been unusually strong as home builders are expressing unusual optimism on the 6-month outlook. Current sales have also been strong while traffic is perhaps the big story in this report, having moved into the plus-50 expansionary column for the first time in 11 years. The housing market index is expected to come in at 68 in February vs January's 67.
Housing Starts for January
Consensus Forecast, Adjusted Annualized Rate: 1.232 million
Consensus Range: 1.124 to 1.260 million
Building Permits
Consensus Forecast: 1.233 million
Consensus Range: 1.220 to 1.250 million
There are lots of moving parts and lots of volatility with housing starts & permits but the bottom line has been strength in the key reading of single-family permits, a contrast to weakness in single-family starts. Multi-family permits have been weakening, though starts here have been strengthening. The Econoday consensus for starts is a 0.5 percent gain to a 1.232 million annualized rate with permits expected to rise 0.4 percent to a 1.233 million rate.
Initial Jobless Claims for February 11 week
Consensus Forecast: 246,000
Consensus Range: 242,000 to 250,000
Initial jobless claims fell a very sharp 12,000 in the February 4 week to 234,000 with the 4-week average falling 3,750 to 244,250 and a new long-term low for this reading (since 1973). Forecasters see claims giving back some of the improvement in the February 11 week with a 12,000 increase to 246,000.
Philadelphia Fed Manufacturing Index for February
Consensus Forecast: 19.3
Consensus Range: 15.0 to 24.0
The Philadelphia Fed report has been sending perhaps the strongest signals of any advance indicator. The index is on a 6-month winning streak with highlights led by standout strength for new orders which jumped 11 points in December to 26.0. Forecasters see the headline index easing back to 19.3 from January's 23.6.
Index of Leading Economic Indicators for January
Consensus Forecast, Month-to-Month Change: 0.4%
Consensus Range: 0.1% to 0.5%
The index of leading economic indicators has been sending mixed signals about to what to expect for the economy 6 months hence. December's 0.5 percent gain was strong but not the prior two months with gains of only 0.1 percent and 0.2 percent. Forecasters see the LEI rising 0.4 percent for the January report.
|

