|
Most economic data of late have not been consistently strong. Updates this week include an up-and-down showing for housing, another weak showing for national activity, and evidence that China is selling our bonds. But there has been one source of steady strength for the U.S. economy and that's jobs which are keeping the consumer going.
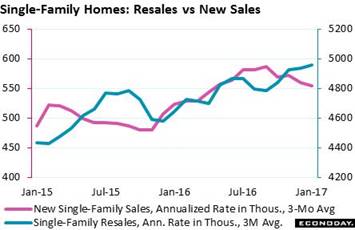 Home data dominated the week's calendar and the results show a role reversal with the resale market now showing greater strength than new homes. Home sales data can be extremely volatile and moving averages help smooth things out. After the week's dust settled, which included a big gain for resales and a big downward revision for new homes, single-family resales (blue line) are extending 6 months of strength while new single-family homes (red line) are on a 6 month slide. Home data dominated the week's calendar and the results show a role reversal with the resale market now showing greater strength than new homes. Home sales data can be extremely volatile and moving averages help smooth things out. After the week's dust settled, which included a big gain for resales and a big downward revision for new homes, single-family resales (blue line) are extending 6 months of strength while new single-family homes (red line) are on a 6 month slide.
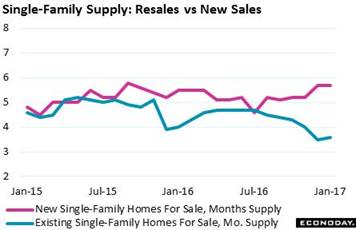 The slide in sales, in one benefit, has boosted relative supply which had been very tight. Supply of new homes (red line) is at 5.7 months which is the highest since September 2015 and among the highest of the economic cycle. And more homes are on the way based on permit data where growth is in the high single digits. For existing homes, the sales increase has decreased relative supply which is at a very thin 3.6 months and just off December's cycle low. As far as prices go, divergence may be at hand as heavier supply is bound to hurt traction for new homes while thinner supply will be a plus for resales. Prices for both have been rising the past two years at a steady mid-single digit clip, at exactly 6.2 percent for the latest FHFA house price index in other data that were released in the week. The slide in sales, in one benefit, has boosted relative supply which had been very tight. Supply of new homes (red line) is at 5.7 months which is the highest since September 2015 and among the highest of the economic cycle. And more homes are on the way based on permit data where growth is in the high single digits. For existing homes, the sales increase has decreased relative supply which is at a very thin 3.6 months and just off December's cycle low. As far as prices go, divergence may be at hand as heavier supply is bound to hurt traction for new homes while thinner supply will be a plus for resales. Prices for both have been rising the past two years at a steady mid-single digit clip, at exactly 6.2 percent for the latest FHFA house price index in other data that were released in the week.
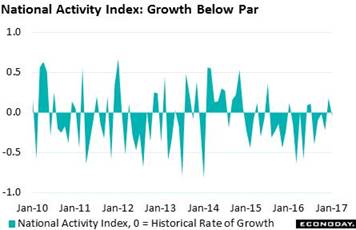 However moderate, the 6.2 percent FHFA price rate stands, as far as price traction goes, as one of the very best showings anywhere in the economic data right now. The softness of the current cycle is tracked in the national activity index which is a composite of an enormous 85 indicators. The zero line for this index is the nation's historical rate of growth and monthly readings, as seen in the graph, have been in the sub-zero zone more times than not. The component that includes housing, in fact, has been the weakest of the report all cycle long, not once appearing in the plus column. The strongest component whose strength has been offset is, you guessed it, employment. However moderate, the 6.2 percent FHFA price rate stands, as far as price traction goes, as one of the very best showings anywhere in the economic data right now. The softness of the current cycle is tracked in the national activity index which is a composite of an enormous 85 indicators. The zero line for this index is the nation's historical rate of growth and monthly readings, as seen in the graph, have been in the sub-zero zone more times than not. The component that includes housing, in fact, has been the weakest of the report all cycle long, not once appearing in the plus column. The strongest component whose strength has been offset is, you guessed it, employment.
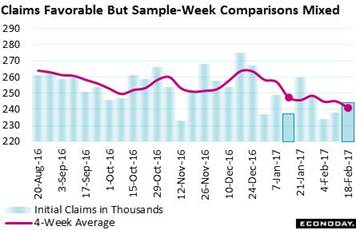 The February employment report may not top January's 227,000 showing in payroll growth but, based on jobless claims at least, strength will likely prove more than respectable. Initial claims have been very low and very favorable, reflecting strong demand for labor and low layoffs. Initial claims in the February 18 week, which was also the sample week for the February employment report, came in at 244,000. And though the comparison with the sample week of the January report shows a small increase of 7,000, the 4-week average, at 241,000, shows a 6,500 decline and is the lowest reading in a very long time, since July 1973. The February employment report may not top January's 227,000 showing in payroll growth but, based on jobless claims at least, strength will likely prove more than respectable. Initial claims have been very low and very favorable, reflecting strong demand for labor and low layoffs. Initial claims in the February 18 week, which was also the sample week for the February employment report, came in at 244,000. And though the comparison with the sample week of the January report shows a small increase of 7,000, the 4-week average, at 241,000, shows a 6,500 decline and is the lowest reading in a very long time, since July 1973.
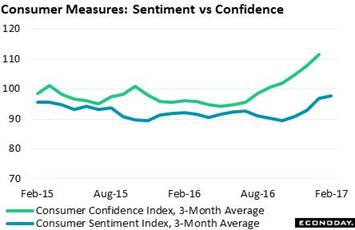 The jobs market is the foundation for consumer confidence and the post-election surge translates into greater optimism on the outlook. But confidence, even before it has had a chance to express itself in actual spending, may already be peaking. February's consumer sentiment index is still very strong at 96.3 but is noticeably off its post-election peak of 98.5 in January. The blue line in the graph tracks the 3-month average which, at 97.7, is still sloping higher but less so than November and December. The slowing is tied to job expectations which are a little less optimistic than they were. And slowing may also be in store for the coming week's consumer confidence index where the 3-month average has yet to show any break at all. The jobs market is the foundation for consumer confidence and the post-election surge translates into greater optimism on the outlook. But confidence, even before it has had a chance to express itself in actual spending, may already be peaking. February's consumer sentiment index is still very strong at 96.3 but is noticeably off its post-election peak of 98.5 in January. The blue line in the graph tracks the 3-month average which, at 97.7, is still sloping higher but less so than November and December. The slowing is tied to job expectations which are a little less optimistic than they were. And slowing may also be in store for the coming week's consumer confidence index where the 3-month average has yet to show any break at all.
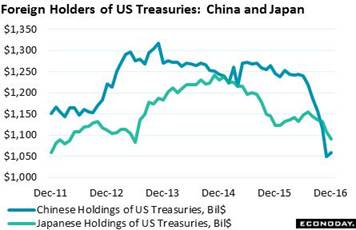 There has been a blizzard of news which earlier this month pushed out an overlooked data set that, with trade wars in the air, is certain to get increasing attention. The Treasury International Capital report tracks cross-border financial transactions including foreign buying of U.S. Treasuries. Even before the election, Chinese accounts (blue line) were paring down their Treasury holdings, by nearly $200 billion last year to $1.06 trillion at last count. The Japanese have likewise been selling but less so, down $30 billion to $1.09 trillion which makes them the single largest Treasury holder right now. Japan and China combined, however, still can't match the Federal Reserve when it comes to owning Treasuries, at exactly $2.46 trillion as of February 22. For those wondering who's lagging behind Japan and China and by how far, it's been a rotation the last few years between Belgium, OPEC, Brazil, and Ireland, the latter currently holding 3rd place at $288 billion. There has been a blizzard of news which earlier this month pushed out an overlooked data set that, with trade wars in the air, is certain to get increasing attention. The Treasury International Capital report tracks cross-border financial transactions including foreign buying of U.S. Treasuries. Even before the election, Chinese accounts (blue line) were paring down their Treasury holdings, by nearly $200 billion last year to $1.06 trillion at last count. The Japanese have likewise been selling but less so, down $30 billion to $1.09 trillion which makes them the single largest Treasury holder right now. Japan and China combined, however, still can't match the Federal Reserve when it comes to owning Treasuries, at exactly $2.46 trillion as of February 22. For those wondering who's lagging behind Japan and China and by how far, it's been a rotation the last few years between Belgium, OPEC, Brazil, and Ireland, the latter currently holding 3rd place at $288 billion.
 Total outstanding Treasuries -- otherwise known as the public debt -- is now near the $20 trillion mark, actually very near, at $19.98 billion to be exact. But prospects of higher fiscal spending and lower tax receipts, a mix that points to increased Treasury supply, has not been rattling bond holders, at least not since the immediate post-election sell off. The Treasury market had its best week so far this year with the 10-year yield down 10 basis points to 2.32 percent for a year-to-date decline of 13 basis points. Compared to immediately before the election, however, the 10-year yield is still up 57 basis points. For the stock market, promises of fiscal spending and lower taxes have clearly proven bullish with the Dow posting a rare 11-session winning streak, up 1.0 percent on the week to 20,821. Year-to-date, the Dow is up 5.4 percent and is well on its way to matching last year's 13.4 percent showing. Total outstanding Treasuries -- otherwise known as the public debt -- is now near the $20 trillion mark, actually very near, at $19.98 billion to be exact. But prospects of higher fiscal spending and lower tax receipts, a mix that points to increased Treasury supply, has not been rattling bond holders, at least not since the immediate post-election sell off. The Treasury market had its best week so far this year with the 10-year yield down 10 basis points to 2.32 percent for a year-to-date decline of 13 basis points. Compared to immediately before the election, however, the 10-year yield is still up 57 basis points. For the stock market, promises of fiscal spending and lower taxes have clearly proven bullish with the Dow posting a rare 11-session winning streak, up 1.0 percent on the week to 20,821. Year-to-date, the Dow is up 5.4 percent and is well on its way to matching last year's 13.4 percent showing.
| Markets at a Glance |
Year-End |
Week Ended |
Week Ended |
Year-To-Date |
Weekly |
|
2016 |
17-Feb-17 |
24-Feb-17 |
Change |
Change |
| DJIA |
19,762.60 |
20,624.05 |
20,821.76 |
5.4% |
1.0% |
| S&P 500 |
2,238.83 |
2,351.16 |
2,367.34 |
5.7% |
0.7% |
| Nasdaq Composite |
5,383.12 |
5,838.58 |
5,845.31 |
8.6% |
0.1% |
|
|
|
|
|
|
| Crude Oil, WTI ($/barrel) |
$53.71 |
$53.38 |
$54.04 |
0.6% |
1.2% |
| Gold (COMEX) ($/ounce) |
$1,152.50 |
$1,236.60 |
$1,258.30 |
9.2% |
1.8% |
|
|
|
|
|
|
| Fed Funds Target |
0.50 to 0.75% |
0.50 to 0.75% |
0.50 to 0.75% |
0 bp |
0 bp |
| 2-Year Treasury Yield |
1.21% |
1.20% |
1.13% |
–8 bp |
–7 bp |
| 10-Year Treasury Yield |
2.45% |
2.42% |
2.32% |
–13 bp |
–10 bp |
| Dollar Index |
102.26 |
100.92 |
101.13 |
-1.1% |
0.2% |
Aside from January's strong payroll gain, the economic data have really not been strong enough to insure a rate hike at the March 14 & 15 FOMC. Back in January, Fed officials weren't ready to raise rates or even talk about winding down their balance sheet, and if the economic news doesn't begin to strengthen, they probably can push back action until the May meeting. But there are two keys that can shake this up, a jump in the PCE price index in the coming week or a jump in February employment, a report that won't however be released until the next month.
The big surprise of the March 3 week is that it doesn't end with the employment report which (because of February's fewer days and a reference week that extended far into the month) will be posted the following week. This will give extra attention to the week's other indicators led on Monday by durable goods orders where trends have been gradually improving. The second estimate for fourth-quarter GDP will follow on Tuesday as will January trade data on goods which will offer a key indication on GDP in the first quarter. Wednesday will see personal income & outlays where the PCE price index will get special focus especially if it posts a sharp gain. Vehicle sales and the ISM also headline Wednesday's data, the former offering the first hard indications on February retail sales and the latter a closely followed advance indication on the factory sector. The week then eases out with the ISM non-manufacturing report, which has been very solid, released on Friday.
Durable Goods Orders for January
Consensus Forecast, Month-to-Month Change: 1.8%
Consensus Range: -0.1% to 4.9%
Durable Goods Orders, Ex-Transportation
Consensus Forecast: 0.5%
Consensus Range: 0.2% to 0.9%
Though volatile month to month, durable goods orders have been gradually improving on trend for the past year and, outside of defense aircraft, did show life in December. And core capital goods (nondefense ex-aircraft) posted strong increases in December and November that point to new business investment and improved output.
Pending Home Sales Index for January
Consensus Forecast, Month-to-Month Change: 1.1%
Consensus Range: 0.3% to 1.2%
This year's early strength in the resale market was first signaled by the pending home sales index which tracks initial contract signings. And forecasters see no cooling for the January index where the Econoday consensus is for a strong 1.1 percent gain.
Real GDP, 4th Quarter, 2nd Estimate, Annualized Rate
Consensus Forecast: 2.1%
Consensus Range: 2.0% to 3.1%
GDP Price Index
Consensus Forecast: 2.1%
Consensus Range: 2.0% to 2.1%
The second estimate of fourth-quarter GDP is expected to come in at a consensus plus 2.1 percent annualized pace, up from 1.9 percent in the first estimate. Inventories are the wildcard having, in an outsized build, made up more than half of the first-estimate's growth. But consumer spending was solid in the first estimate, rising at a 2.5 percent pace. The big negative in the quarter was exports which were hit by a soybean reversal from the prior quarter. The GDP price index is over 2 percent, at 2.1 percent in the first estimate where it is expected to hold.
International Trade In Goods for January
Consensus Forecast, Month-to-Month Change: -$66.0 billion
Consensus Range: -$68.0 to -$64.8 billion
Forecasters see the nation's trade gap in goods narrowing slightly in January to $66.0 billion. Goods exports have been improving, starting 2016 at about $120 billion per month and moving up to about $125 billion by year's end. But imports of goods also trended higher, moving from $180 billion to $190 billion.
Case-Shiller, 20-City Adjusted Index for December
Consensus Forecast, Month-to-Month Change: 0.7%
Consensus Range: 0.6% to 0.9%
Case-Shiller, 20-City Unadjusted Index
Consensus Forecast, Year-on-Year Change: 5.4%
Consensus Range: 5.3% to 5.5%
The Case-Shiller 20-city index has settled into a steady and moderate climb, holding at the low end of the 5 percent annual range for the past 2 years. December was a good month for the index which jumped 0.9 percent for a year-on-year rate of 5.3 percent. For January, forecasters are calling for a strong 0.7 percent monthly rise and a 5.4 percent rate.
Chicago PMI for February
Consensus Forecast: 52.9
Consensus Range: 50.0 to 54.0
Both new orders and backlogs were in contraction in the January report which doesn't point to strength for the Chicago PMI in February which, nevertheless, is expected to rise 2.6 points to 52.9. Moving from 57.6 in November to 50.3 in January, volatility is common for this closely watched index that tracks both the manufacturing and non-manufacturing sectors of the Chicago-area economy.
Consumer Confidence Index for February
Consensus Forecast: 111.0
Consensus Range: 108.5 to 114.5
The Conference Board's consumer confidence index is standing only fractionally below a 15-year high hit in December of 113.3. Those saying jobs are hard to get have been coming down in yet another signal of strength for the labor market. But buying plans in the last report softened as did income prospects. Forecasters see the index easing modestly for a second month, to a consensus 111.0 in February in what would be an 8 tenths decline.
Total Vehicle Sales for February
Consensus Forecast, Annualized Rate: 17.7 million
Consensus Range: 17.5 to 17.9 million
For the last three months, unit vehicle sales have accurately forecast swings in the motor vehicle component of the monthly retail sales report which on trend has been accelerating to mid-single digit annual growth. Forecasters see unit sales coming in at a very solid 17.7 million annualized rate in February vs January's 17.6 million.
Personal Income for January
Consensus Forecast, Month-to-Month Change: 0.3%
Consensus Range: 0.2% to 0.5%
Consumer Spending
Consensus Forecast: 0.3%
Consensus Range: 0.2% to 0.5%
PCE Price Index
Consensus Forecast: 0.4%
Consensus Range: 0.3% to 0.5%
Core PCE Price Index
Consensus Forecast: 0.3%
Consensus Range: 0.2% to 0.3%
Personal income has been growing in the modest 3 to 3-1/2 percent range the past year though the wages & salaries component has been in the 4 percent range. Similarly, consumer spending has been on a moderate rise to 4 percent. For January, forecasters see income rising a monthly 0.3 percent with spending also up 0.3 percent. Key in this report will be the PCE price index which has been on the rise and is expected to post a sizable monthly gain of 0.4 percent that would put it very near the Federal Reserve's 2 percent target. The core PCE (less food & energy) is expected to rise 0.3 percent.
ISM Manufacturing Index for February
Consensus Forecast: 56.1
Consensus Range: 55.5 to 58.5
The ISM manufacturing index has beaten the consensus the last five reports and by a sizable average of 9 tenths in the last three reports. New orders have posted back-to-back 60 scores with production and employment likewise moving higher. Input costs are at a recovery high. Forecasters are calling for 56.1 vs January's 56.0.
Construction Spending for January
Consensus Forecast, Month-to-Month Change: 0.5%
Consensus Range: 0.2% to 0.7%
Construction spending improved through the second half of last year but remains only moderate, still under 5 percent annual growth. Growth in nonresidential construction has been offset by slower growth in both residential spending and also public construction. The Econoday consensus for January construction spending calls for a 0.5 percent gain vs December's 0.2 percent decline.
Beige Book
Prepared for the March 14 & 15 FOMC Meeting
The Beige Book will set the economic backdrop for the March 14 and 15 FOMC meeting. The prior report, prepared for the January meeting, continued to describe economic activity as modest to moderate but cited strong post-election confidence in the general outlook. Yet descriptions of actual business investment and consumer spending were soft as was the inflation assessment. If general activity and inflation, however, get upgrades it would support what are significant expectations for a rate hike at the March FOMC.
Initial Jobless Claims for February 25 week
Consensus Forecast: 245,000
Consensus Range: 240,000 to 250,000
Initial jobless claims have remained very low and favorable with initial claims in February running more than 5,000 below January's levels and pointing to strength for the February employment report. Continuing claims have also been coming down, running about 25,000 below a month ago. Forecasters are calling for 1,000 rise to 245,000 in initial claims for the February 25 week.
ISM Non-Manufacturing Index for February
Consensus Forecast: 56.5
Consensus Range: 55.5 to 59.0
The ISM non-manufacturing index held very consistently in the mid-50s range throughout the last year. Growth in new orders has also held steady, near a very strong 60 level with employment growth, however, lagging in the mid-50s. Strength in this report's employment index would raise expectations for strength in next week's employment report for February.
|
