|
According to the consumer sentiment report, it's cherry picking time for economic data. Republicans are selecting out strong economic data to support their rare optimism while Democrats are selecting out weak economic data to defend their deep pessimism. I'll definitely do all I can to steer an objective path through the week's numbers and let the reader, who must also promise to be unbiased, judge whether one view may be gaining over the other.
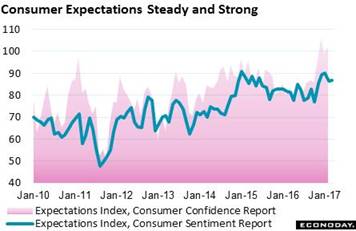 The first feature of the post-election economy is significant strength in consumer expectations, that is the outlook for the stock market and especially the jobs market. The expectations index of the consumer sentiment report jumped to highs for the economic cycle immediately after the election and, at 86.7 in the mid-March reading, has held there since. But the blue line of the graph masks turbulence within as Democrats, at a 55.3 score, see a recession coming while Republicans, at 122.5, see what the report describes as the dawn of a new economic era. Where are the Independents? In between, of course, at 88.3 which however is a very strong score. The first feature of the post-election economy is significant strength in consumer expectations, that is the outlook for the stock market and especially the jobs market. The expectations index of the consumer sentiment report jumped to highs for the economic cycle immediately after the election and, at 86.7 in the mid-March reading, has held there since. But the blue line of the graph masks turbulence within as Democrats, at a 55.3 score, see a recession coming while Republicans, at 122.5, see what the report describes as the dawn of a new economic era. Where are the Independents? In between, of course, at 88.3 which however is a very strong score.
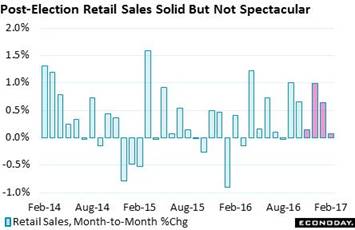 But optimism in the future hasn't really translated yet to higher spending in the present. But optimism in the future hasn't really translated yet to higher spending in the present.
Retail sales in November were very soft and though they were strong in December and solid in January, they slowed again in February to only a 0.1 percent gain. Separate data on service spending in January are unusually weak, at no change, which together with retail sales data are putting the consumer's contribution to first-quarter GDP in question. The relationship between confidence and spending is a loose one. How long the separation will last and how they converge are open questions.
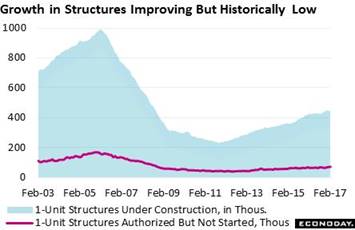 Housing is central to consumer wealth and it, like spending, still shows a slump. The post-election reaction in the sector has been soft. Resales have been picking up but not new home sales where the trend is slowing. Housing has in fact been soft this whole cycle and, as Janet Yellen often points out, far under last cycle's boom. Keeping total sales down and construction employment low has been a lack of building, though strength is beginning to appear in the dominant category of single-family homes. Single-family homes under construction total 454,000 in the latest data and right at the best level of the cycle. And those not yet started are also on the rise, inching up to 73,000. Housing is central to consumer wealth and it, like spending, still shows a slump. The post-election reaction in the sector has been soft. Resales have been picking up but not new home sales where the trend is slowing. Housing has in fact been soft this whole cycle and, as Janet Yellen often points out, far under last cycle's boom. Keeping total sales down and construction employment low has been a lack of building, though strength is beginning to appear in the dominant category of single-family homes. Single-family homes under construction total 454,000 in the latest data and right at the best level of the cycle. And those not yet started are also on the rise, inching up to 73,000.
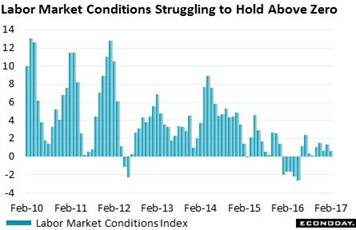 A clear strength of the post-election economy has been employment. Or has it? Despite very solid strength in payroll growth, at 235,000 and 238,000 the first two months of the year, the Federal Reserve's labor market conditions index can't get going. The index, a 19-component composite aimed at tracking the breadth of the labor market, is barely over zero, scoring an exhausted looking plus 0.6 in February. There was one dissent at this month's FOMC, Neel Kashkari from the Minneapolis Fed who voted against a rate hike saying in part he wasn't sure the economy is actually at full employment. Maybe he was looking at this graph. A clear strength of the post-election economy has been employment. Or has it? Despite very solid strength in payroll growth, at 235,000 and 238,000 the first two months of the year, the Federal Reserve's labor market conditions index can't get going. The index, a 19-component composite aimed at tracking the breadth of the labor market, is barely over zero, scoring an exhausted looking plus 0.6 in February. There was one dissent at this month's FOMC, Neel Kashkari from the Minneapolis Fed who voted against a rate hike saying in part he wasn't sure the economy is actually at full employment. Maybe he was looking at this graph.
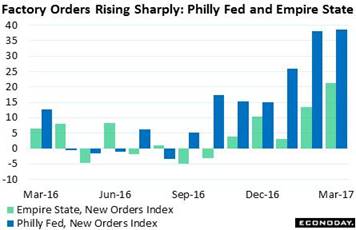 The relationship between confidence and actual spending is playing out (or not playing out) very visibly right now in the factory sector. Post-election anecdotal reports from the factory sector have even surpassed consumer confidence in their unusual strength. The Philly Fed's new orders index, at 38.6 this month, is signaling the strongest rate of monthly growth since all the way back in November 1983. New orders for Empire State, at 21.3, are the strongest of this cycle, since April 2010. These and other regional reports, in contrast to data out of Washington, are all at or approaching record highs. But these reports aren't hard data, only informal snapshots from small samples. The relationship between confidence and actual spending is playing out (or not playing out) very visibly right now in the factory sector. Post-election anecdotal reports from the factory sector have even surpassed consumer confidence in their unusual strength. The Philly Fed's new orders index, at 38.6 this month, is signaling the strongest rate of monthly growth since all the way back in November 1983. New orders for Empire State, at 21.3, are the strongest of this cycle, since April 2010. These and other regional reports, in contrast to data out of Washington, are all at or approaching record highs. But these reports aren't hard data, only informal snapshots from small samples.
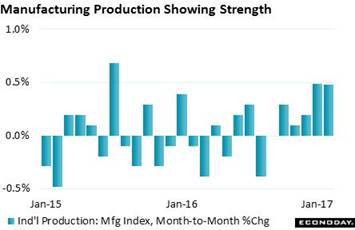 The hard data from the factory sector have all been surprisingly soft, showing little more strength than during the energy downturn 2-1/2 years ago. Well that was before this week's big jump and big revision in the manufacturing component of the industrial production report. Manufacturing volumes rose 0.5 percent in February while January's volumes were revised sharply higher, also to 0.5 percent for a 3 tenths upward revision for the best gains since July 2015. Suddenly the factory evidence everyone's been waiting for is here! Well maybe. One report after all is only one report and confirmation is awaited from February's durable goods report on Friday, March 24. The hard data from the factory sector have all been surprisingly soft, showing little more strength than during the energy downturn 2-1/2 years ago. Well that was before this week's big jump and big revision in the manufacturing component of the industrial production report. Manufacturing volumes rose 0.5 percent in February while January's volumes were revised sharply higher, also to 0.5 percent for a 3 tenths upward revision for the best gains since July 2015. Suddenly the factory evidence everyone's been waiting for is here! Well maybe. One report after all is only one report and confirmation is awaited from February's durable goods report on Friday, March 24.
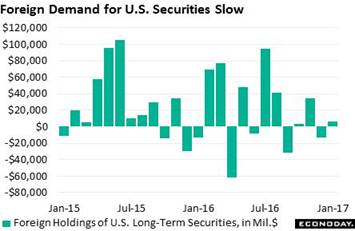 Talk of trade wars is something new for the economic dialogue. What impact, if any, is it having on foreign demand? Exports have been respectable in recent months but there have been points of weakness including for capital goods and also for our services where demand is usually very strong. And foreign demand for our financial securities has not been improving. Cross-border inflow of long-term securities has been soft, up a net $6.3 billion in January for a post-election monthly average of only $9.3 billion. This compares with average monthly inflow of $29.1 billion this economic cycle. And where is the weakness? Well, Chinese and Japanese demand for U.S. Treasuries hasn't been very strong as post-election holdings for both are down, $64.4 billion lower for China to $1.05 trillion and $29.4 lower for Japan at $1.10 trillion. Note that inflow of securities helps offset, at least to a degree, the nation's trade gap and government deficit. Talk of trade wars is something new for the economic dialogue. What impact, if any, is it having on foreign demand? Exports have been respectable in recent months but there have been points of weakness including for capital goods and also for our services where demand is usually very strong. And foreign demand for our financial securities has not been improving. Cross-border inflow of long-term securities has been soft, up a net $6.3 billion in January for a post-election monthly average of only $9.3 billion. This compares with average monthly inflow of $29.1 billion this economic cycle. And where is the weakness? Well, Chinese and Japanese demand for U.S. Treasuries hasn't been very strong as post-election holdings for both are down, $64.4 billion lower for China to $1.05 trillion and $29.4 lower for Japan at $1.10 trillion. Note that inflow of securities helps offset, at least to a degree, the nation's trade gap and government deficit.
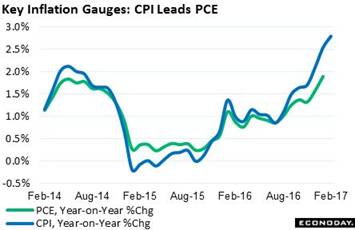 We end the week's run with a look at inflation which, like other factors, can reveal changes in economic strength. The consumer price index inched only 0.1 percent higher in February though the year-on-year rate rose 2 tenths to a 2.7 percent rate that was last matched at the beginning of the cycle, 5 years ago. Note that the PCE index, which is green line the Fed tracks, is following the same path, at 1.9 percent in January. But the gains for both reflect low energy prices this time last year when, for instance, a gallon of regular cost $2.00 vs $2.30 now. Aside from energy, most prices in the economy are showing very little momentum including average hourly earnings where growth stalled near the 3 percent line. We end the week's run with a look at inflation which, like other factors, can reveal changes in economic strength. The consumer price index inched only 0.1 percent higher in February though the year-on-year rate rose 2 tenths to a 2.7 percent rate that was last matched at the beginning of the cycle, 5 years ago. Note that the PCE index, which is green line the Fed tracks, is following the same path, at 1.9 percent in January. But the gains for both reflect low energy prices this time last year when, for instance, a gallon of regular cost $2.00 vs $2.30 now. Aside from energy, most prices in the economy are showing very little momentum including average hourly earnings where growth stalled near the 3 percent line.
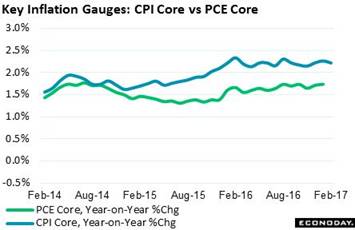 When excluding energy and also food where prices, unlike energy, have been flat, the inflation picture turns sideways. The year-on-year core reading for the CPI actually slowed in February, down 1 tenth to only 2.2 percent. It's core readings that Fed officials are focusing on, showing everyone that they haven't been reckless and that they are not behind the inflation curve. Yellen, in her post-FOMC press conference, said she expects core inflation, specifically the PCE core which is what the Fed tracks, to move gradually to their 2 percent target and then stabilize. Price action like this, or that is the lack of action, is not offering any signals of an economic breakout ahead. When excluding energy and also food where prices, unlike energy, have been flat, the inflation picture turns sideways. The year-on-year core reading for the CPI actually slowed in February, down 1 tenth to only 2.2 percent. It's core readings that Fed officials are focusing on, showing everyone that they haven't been reckless and that they are not behind the inflation curve. Yellen, in her post-FOMC press conference, said she expects core inflation, specifically the PCE core which is what the Fed tracks, to move gradually to their 2 percent target and then stabilize. Price action like this, or that is the lack of action, is not offering any signals of an economic breakout ahead.
 The FOMC raised its policy rate for the third time this cycle in a move that was fully telegraphed, first by New York Fed President William Dudley who in late February, the day before the 1.9 percent print for the PCE price index, said the case for a March hike was "a lot more compelling". But what isn't being telegraphed yet is whether indications of strength in the economy, not to mention stimulus measures under the new administration, are warranting a change in prospects for future hikes which, based on updated FOMC forecasts, remain at two more additional 25 basis point moves sometime through the year. Whether expectations will shift to 3 hikes this year will very likely turn on wage inflation, something Janet Yellen, citing low productivity and despite full employment, doesn't see heating very much at all. The lack of FOMC hawkishness, together with the continued lack of real economic heat, helped raise demand for Treasuries where the 2-year yield fell 5 basis points in the week to 1.32 percent and the 10-year down 8 basis points to 2.50 percent. Lower yields and less-than-hawkish Fed policy often mean selling for the dollar as the dollar index fell a sharp 1.0 percent in the week to 100.23. The stock market posted modest gains in the week with the Dow inching 0.1 percent to 20.914. The FOMC raised its policy rate for the third time this cycle in a move that was fully telegraphed, first by New York Fed President William Dudley who in late February, the day before the 1.9 percent print for the PCE price index, said the case for a March hike was "a lot more compelling". But what isn't being telegraphed yet is whether indications of strength in the economy, not to mention stimulus measures under the new administration, are warranting a change in prospects for future hikes which, based on updated FOMC forecasts, remain at two more additional 25 basis point moves sometime through the year. Whether expectations will shift to 3 hikes this year will very likely turn on wage inflation, something Janet Yellen, citing low productivity and despite full employment, doesn't see heating very much at all. The lack of FOMC hawkishness, together with the continued lack of real economic heat, helped raise demand for Treasuries where the 2-year yield fell 5 basis points in the week to 1.32 percent and the 10-year down 8 basis points to 2.50 percent. Lower yields and less-than-hawkish Fed policy often mean selling for the dollar as the dollar index fell a sharp 1.0 percent in the week to 100.23. The stock market posted modest gains in the week with the Dow inching 0.1 percent to 20.914.
| Markets at a Glance |
Year-End |
Week Ended |
Week Ended |
Year-To-Date |
Weekly |
|
2016 |
10-Mar-17 |
17-Mar-17 |
Change |
Change |
| DJIA |
19,762.60 |
20,902.98 |
20,914.62 |
5.8% |
0.1% |
| S&P 500 |
2,238.83 |
2,372.60 |
2,378.25 |
6.2% |
0.2% |
| Nasdaq Composite |
5,383.12 |
5,861.73 |
5,901.00 |
9.6% |
0.7% |
|
|
|
|
|
|
| Crude Oil, WTI ($/barrel) |
$53.71 |
$48.50 |
$48.79 |
-9.2% |
0.6% |
| Gold (COMEX) ($/ounce) |
$1,152.50 |
$1,202.70 |
$1,229.50 |
6.7% |
2.2% |
|
|
|
|
|
|
| Fed Funds Target |
0.50 to 0.75% |
0.50 to 0.75% |
0.75 to 1.00% |
0 bp |
25 bp |
| 2-Year Treasury Yield |
1.21% |
1.36% |
1.32% |
11 bp |
–4 bp |
| 10-Year Treasury Yield |
2.45% |
2.58% |
2.50% |
5 bp |
–8 bp |
| Dollar Index |
102.26 |
101.21 |
100.23 |
-2.0% |
-1.0% |
Is the economy at a pivot, a point when growth is about to take off? Will consumer spending begin to pick up and will factory activity finally get going? And how will global demand play out? For the neutral observer it's wait and see of course, but one point of progress seems certain. If consumer spending doesn't pick up and if the factory sector just continues to stay asleep, confidence in sentiment readings, whether consumer or business, will get the same kind of boost that election polling got from the 2016 campaign.
The energetic pace of the prior week follows with what looks to be a more peaceful one that will, however, be highlighted by key updates for housing and manufacturing. FHFA house prices, which have been firm, open Wednesday's calendar which also includes existing home sales which had been firm though a step back is the call for February's report. New home sales had been firm before a January setback that is expected to be reversed in Thursday's report. Jobless claims will also be posted Thursday with data on initial claims to cover the sample week of the employment report and offer early clues whether the labor market in March can match the strength of February and January. The week's highlight will be Friday's durable goods report, offering the latest on a factory sector where the outlook is on the rise following February's strength in industrial production.
Current Account Deficit for Fourth Quarter
Consensus Forecast: -$128.1 billion
Consensus Range: -$130.8 to -$127.3 billion
The current account deficit is expected to widen sharply in the fourth quarter, to $128.1 billion from $113.0 billion in the third quarter and reflecting the sharp widening in the trade deficit during the quarter. The account deficit relative to GDP has been moderate, at 2.4 percent in the third quarter.
FHFA House Price Index for January
Consensus Forecast: 0.5%
Consensus Range: 0.4% to 0.6%
Solid and predictable gains have been the rule for the FHFA house price index where the consensus is calling for a sizable 0.5 percent gain for January. Year-on-year, this index has been running above the 6 percent line in one of the best and most consistent economic performances on the calendar.
Existing Home Sales for February
Consensus Forecast, Annualized Rate: 5.555 million
Consensus Range: 5.430 to 5.690 million
Resales had a soft 2016 but opened January with a sharp gain to a 5.690 million annualized rate that is the best so far of the economic cycle. Single-family sales and condo sales are broken down in this report with both showing respectable mid-single digit growth. Yet despite solid strength in prices and overall solid demand, supply on the market has been surprisingly low and perhaps is the reason pending home sales, which is the advance reading for this report, fell a disappointing 2.8 percent in January. At a consensus 5.555 million annualized pace, forecasters see existing home sales for February falling 2.4 percent.
Initial Jobless Claims for March 18 week
Consensus Forecast: 240,000
Consensus Range: 237,000 to 245,000
The March 18 sample week for initial jobless claims was also the sample week of the monthly employment report and the results will offer the first hints whether the labor market in March is proving as healthy as February and January. Forecasters see initial claims little changed in the week, at a consensus 240,000 vs 241,000 in the prior week.
New Home Sales for February
Consensus Forecast, Annualized Rate: 565,000
Consensus Range: 550,000 to 600,000
New home sales looked to be one of the economy's best strengths before fading at year-end and posting a very soft January. New home sales in February are expected to bounce back, to a consensus 565,000 million annualized rate in what would be a very solid 1.8 percent gain from January's 555,000. But this report is notorious for its month-to-month volatility which puts the focus on the 3-month average which, however, has also been fading.
Durable Goods Orders for February
Consensus Forecast, Month-to-Month Change: 1.5%
Consensus Range: 0.1% to 2.6%
Durable Goods Orders, Ex-Transportation
Consensus Forecast: 0.8%
Consensus Range: 0.1% to 2.3%
Durable Goods Orders, Core Capital Goods (Nondefense Ex-Aircraft)
Consensus Forecast: 0.5%
Consensus Range: 0.4% to 0.8%
Last week's industrial production report offered the first definitive confirmation of acceleration in the manufacturing sector — and durable goods orders are expected to further confirm the strength. The durable goods headline is seen jumping 1.5 percent on top of January's 1.8 percent gain. Excluding transportation equipment, orders are expected to post a sizable 0.8 percent February gain and more than reverse the prior month's 0.2 percent dip. Orders for core capital goods (nondefense ex-aircraft) are a central concern of this report and they have signaling weakness in business investment and trouble for first-quarter GDP. But forecasters see strength here also for February, at a consensus gain 0.5 percent vs January's 0.4 percent decline.
|
