|
Consumers did their share back in the fourth quarter but haven't done much of anything since, this despite sky high confidence that, however, is politically charged. No less spectacular than consumer confidence have been anecdotal reports out of the factory sector and here a little traction in actual data may now be showing. But the economy isn't at full steam by any means and the consumer is the reason why.
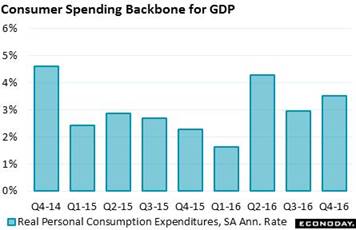 Car sales were the rage back in the fourth quarter, helping to lift consumer spending to an inflation-adjusted 3.5 percent annualized rate of growth. This is well above the 2.4 percent average over the 7-1/2 years of the ongoing expansion. Durable goods, boosted specifically by a big spike in December vehicle sales, rose at an impressive 11.4 percent rate with nondurables at 3.3 percent and spending on services, by far the biggest category, in the rear at 2.4 percent. Consumer spending makes up about 70 of total GDP. Car sales were the rage back in the fourth quarter, helping to lift consumer spending to an inflation-adjusted 3.5 percent annualized rate of growth. This is well above the 2.4 percent average over the 7-1/2 years of the ongoing expansion. Durable goods, boosted specifically by a big spike in December vehicle sales, rose at an impressive 11.4 percent rate with nondurables at 3.3 percent and spending on services, by far the biggest category, in the rear at 2.4 percent. Consumer spending makes up about 70 of total GDP.
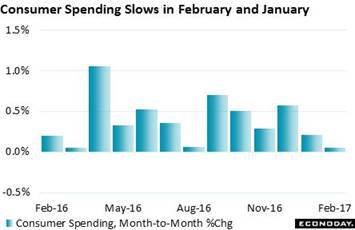 Since the fourth quarter, however, the consumer has let down the pace, especially for car sales and also including services. Consumer spending inched only 1 tenth higher in nominal month-to-month terms in February following a nearly as weak 0.2 percent gain in January. This translates to an inflation-adjusted annualized rate of only 0.4 percent and is the weakest two-month showing since this time last year — which raises an important question. Are seasonal adjustments pulling down winter data too much? One way to neutralize the effect of adjustments is to look at first quarters separately and see how the current one compares. Over the 7 first quarters of this expansion, consumer spending has grown at an average annualized rate of 2.1 percent which means this quarter is clearly sizing up as below average, even for a first quarter. Since the fourth quarter, however, the consumer has let down the pace, especially for car sales and also including services. Consumer spending inched only 1 tenth higher in nominal month-to-month terms in February following a nearly as weak 0.2 percent gain in January. This translates to an inflation-adjusted annualized rate of only 0.4 percent and is the weakest two-month showing since this time last year — which raises an important question. Are seasonal adjustments pulling down winter data too much? One way to neutralize the effect of adjustments is to look at first quarters separately and see how the current one compares. Over the 7 first quarters of this expansion, consumer spending has grown at an average annualized rate of 2.1 percent which means this quarter is clearly sizing up as below average, even for a first quarter.
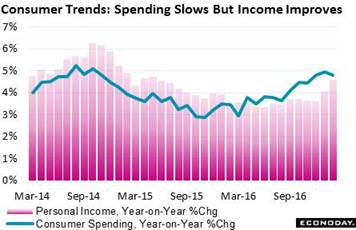 The consumer may not be spending right now but there are points of strength for future spending. The savings rate, at 5.6 percent, rose a noticeable 2 tenths in both February and January which is part of the reason that sales have slowed. Another plus is personal income which has risen 0.4 and 0.5 percent the past two months with the year-on-year rate moving a full percentage point higher to 4.6 percent. This makes the best looking upward slope in three years. And the wages & salaries component (in what may hint at wage inflation) is leading the way with a 5.5 percent year-on-year showing. The consumer may not be spending right now but there are points of strength for future spending. The savings rate, at 5.6 percent, rose a noticeable 2 tenths in both February and January which is part of the reason that sales have slowed. Another plus is personal income which has risen 0.4 and 0.5 percent the past two months with the year-on-year rate moving a full percentage point higher to 4.6 percent. This makes the best looking upward slope in three years. And the wages & salaries component (in what may hint at wage inflation) is leading the way with a 5.5 percent year-on-year showing.
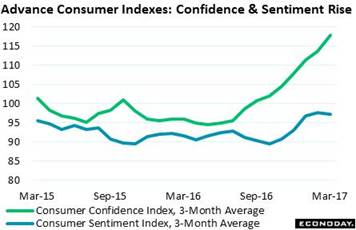 Stronger savings and rising wages are always good for confidence which helps explain a 9.5 point surge in the consumer confidence index to 125.6. This index was already stratospheric before the March result and is now at its strongest level since the dotcom boom days of December 2000. Details show an unusually large spread when it comes to income with optimists outnumbering pessimists by 3 to 1. Less spectacular is the consumer sentiment index which has been leveling off after the November election. This report stresses the polarization in its sample between Democrats, who see a recession and inflation coming, and Republicans who see the opposite. Which brings up the Trump administration's unsuccessful attempt to repeal Obamacare. A measure of its psychological impact comes from the weekly consumer comfort index which is now off its cycle highs, falling a steep 1.6 points in the March 26 week to what is still however a very strong 49.7. Stronger savings and rising wages are always good for confidence which helps explain a 9.5 point surge in the consumer confidence index to 125.6. This index was already stratospheric before the March result and is now at its strongest level since the dotcom boom days of December 2000. Details show an unusually large spread when it comes to income with optimists outnumbering pessimists by 3 to 1. Less spectacular is the consumer sentiment index which has been leveling off after the November election. This report stresses the polarization in its sample between Democrats, who see a recession and inflation coming, and Republicans who see the opposite. Which brings up the Trump administration's unsuccessful attempt to repeal Obamacare. A measure of its psychological impact comes from the weekly consumer comfort index which is now off its cycle highs, falling a steep 1.6 points in the March 26 week to what is still however a very strong 49.7.
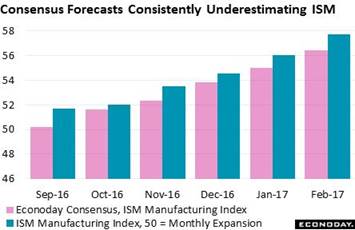 Like consumer confidence, advance factory reports, which are based on informal sampling of company officials, have been signaling breakout strength. But forecasters haven't been catching on as the ISM index has beaten the Econoday consensus for 6 straight months and by sizable margins, at 1.3 points in the last report for February. The March ISM is a highlight of the coming week's calendar with forecasters, not caring about the past, calling for a 6 tenths dip to 57.1. Like consumer confidence, advance factory reports, which are based on informal sampling of company officials, have been signaling breakout strength. But forecasters haven't been catching on as the ISM index has beaten the Econoday consensus for 6 straight months and by sizable margins, at 1.3 points in the last report for February. The March ISM is a highlight of the coming week's calendar with forecasters, not caring about the past, calling for a 6 tenths dip to 57.1.
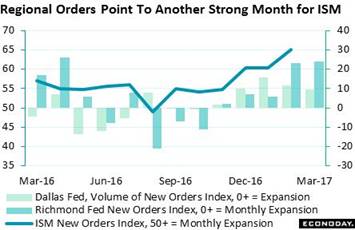 Headline indexes can be vague, whether a composite of disparate factors like ISM or a single-question sentiment gauge like the Philly Fed. But these reports all offer a very tangible component and that's new orders. The graph tracks ISM new orders against those from Dallas and Richmond. They are all signaling a 2017 upturn. And actual orders have been moving higher, to $470 billion in January which stands out against last year's flat run of $450 billion months. Recent gains for factory orders, including one indicated for February, have been tied to aircraft orders which, whether up or down, are always unpredictable wildcards. The Econoday consensus for February factory orders is a 1.0 percent gain that would put the monthly total at $475 billion. Headline indexes can be vague, whether a composite of disparate factors like ISM or a single-question sentiment gauge like the Philly Fed. But these reports all offer a very tangible component and that's new orders. The graph tracks ISM new orders against those from Dallas and Richmond. They are all signaling a 2017 upturn. And actual orders have been moving higher, to $470 billion in January which stands out against last year's flat run of $450 billion months. Recent gains for factory orders, including one indicated for February, have been tied to aircraft orders which, whether up or down, are always unpredictable wildcards. The Econoday consensus for February factory orders is a 1.0 percent gain that would put the monthly total at $475 billion.
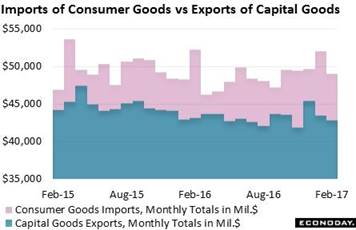 Turning back to the fourth quarter, the drag that limited GDP to a 2.1 percent gain came from net exports which pulled down the total by 1.8 percentage points. Consumer goods are the main factor pushing up imports, at $51.4 in advance data for February and well above America's top category on the export side which has been in a tailspin, capital goods at $42.9 billion in February. Strong domestic demand for low priced consumer imports and weak foreign demand for U.S. machinery and business equipment have been pulling down GDP at an increasing rate. Turning back to the fourth quarter, the drag that limited GDP to a 2.1 percent gain came from net exports which pulled down the total by 1.8 percentage points. Consumer goods are the main factor pushing up imports, at $51.4 in advance data for February and well above America's top category on the export side which has been in a tailspin, capital goods at $42.9 billion in February. Strong domestic demand for low priced consumer imports and weak foreign demand for U.S. machinery and business equipment have been pulling down GDP at an increasing rate.
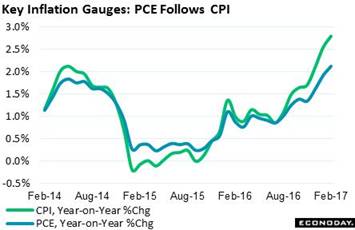 The income and spending report also includes the most important inflation data of all, the data that the Federal Reserve targets. And for the first time in nearly 5 years, overall inflation is above target at 2.1 percent. The gain, however, is narrowly tied to energy prices which were very low this time last year. Energy prices last year then firmed which points to only a shallow upward slope ahead, if upward at all, for the overall index. And there doesn't seem to be any month-to-month momentum right now with this reading rising only 0.1 percent in February. The income and spending report also includes the most important inflation data of all, the data that the Federal Reserve targets. And for the first time in nearly 5 years, overall inflation is above target at 2.1 percent. The gain, however, is narrowly tied to energy prices which were very low this time last year. Energy prices last year then firmed which points to only a shallow upward slope ahead, if upward at all, for the overall index. And there doesn't seem to be any month-to-month momentum right now with this reading rising only 0.1 percent in February.
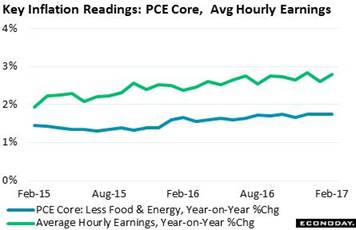 But in a bit of a surprise the core, which excludes food and energy and which wasn't supposed to show much pressure, did show some with a year-on-year rate of 1.8 percent in February. The data also included an upward revision to January which now also stands at 1.8 percent as does December. Actually, going out to two places all three stand at 1.75 percent which is what Federal Reserve officials are avidly noting (since I guess a 7 handle sounds less scary than an 8). The core rate is a delicate subject for Janet Yellen who sees it, unlike the ups-and-downs of the overall rate, edging quietly and harmlessly toward the 2 percent target. Her confidence lies in low productivity and the lack of pricing muscle in the labor supply. But in a bit of a surprise the core, which excludes food and energy and which wasn't supposed to show much pressure, did show some with a year-on-year rate of 1.8 percent in February. The data also included an upward revision to January which now also stands at 1.8 percent as does December. Actually, going out to two places all three stand at 1.75 percent which is what Federal Reserve officials are avidly noting (since I guess a 7 handle sounds less scary than an 8). The core rate is a delicate subject for Janet Yellen who sees it, unlike the ups-and-downs of the overall rate, edging quietly and harmlessly toward the 2 percent target. Her confidence lies in low productivity and the lack of pricing muscle in the labor supply.
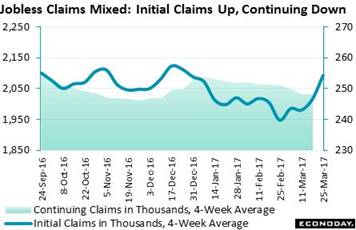 Labor is the news for the coming week and expectations for March payroll growth are moderate at 178,000 which would be well down from 235,000 and 238,000 in February and January. Yet forecasters badly underestimated February, with the consensus shy by 35,000, and they were doubly that bad in January, 70,000 shy. A wildcard for the March report is the mid-month sample week which was the same week that a Category 3 storm hit the East Coast. Weekly data on initial claims show a spike at mid-month and into the following week which points to a sudden burst of layoffs. But there's a counter signal, and that's a mid-month decline in continuing claims which may hint at new hiring at the same time. Labor is the news for the coming week and expectations for March payroll growth are moderate at 178,000 which would be well down from 235,000 and 238,000 in February and January. Yet forecasters badly underestimated February, with the consensus shy by 35,000, and they were doubly that bad in January, 70,000 shy. A wildcard for the March report is the mid-month sample week which was the same week that a Category 3 storm hit the East Coast. Weekly data on initial claims show a spike at mid-month and into the following week which points to a sudden burst of layoffs. But there's a counter signal, and that's a mid-month decline in continuing claims which may hint at new hiring at the same time.
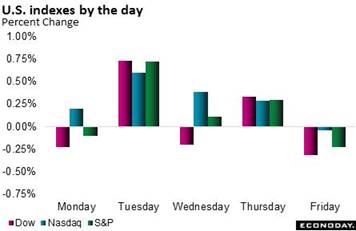 Government shutdowns bring out indignant quotes from policy makers and warnings from credit agencies, all calling them irresponsible and basically immature. But what they're not calling them is routine. At least the talk of them which pops up annually. Talk aside, there's only been 18 actual shutdowns in the last 42 years with the last in 2013 when it lasted for 16 days, which is on the long side for one of these. The end of April looks like the first deadline this time around and the polarization in Washington is very stark right now. Drama like this is good for news businesses but not much else, except of course for safe-haven assets like short-term U.S. Treasuries and perhaps the dollar. The week following the unsuccessful push to repeal Obamacare was uneventful for the stock market as the Dow rose only 0.3 percent to 20,663 though the Nasdaq showed life with a 1.5 percent gain to 5,911. Government shutdowns bring out indignant quotes from policy makers and warnings from credit agencies, all calling them irresponsible and basically immature. But what they're not calling them is routine. At least the talk of them which pops up annually. Talk aside, there's only been 18 actual shutdowns in the last 42 years with the last in 2013 when it lasted for 16 days, which is on the long side for one of these. The end of April looks like the first deadline this time around and the polarization in Washington is very stark right now. Drama like this is good for news businesses but not much else, except of course for safe-haven assets like short-term U.S. Treasuries and perhaps the dollar. The week following the unsuccessful push to repeal Obamacare was uneventful for the stock market as the Dow rose only 0.3 percent to 20,663 though the Nasdaq showed life with a 1.5 percent gain to 5,911.
| Markets at a Glance |
Year-End |
Week Ended |
Week Ended |
Year-To-Date |
Weekly |
|
2016 |
24-Mar-17 |
31-Mar-17 |
Change |
Change |
| DJIA |
19,762.60 |
20,596.72 |
20,663.22 |
4.6% |
0.3% |
| S&P 500 |
2,238.83 |
2,343.98 |
2,362.72 |
5.5% |
0.8% |
| Nasdaq Composite |
5,383.12 |
5,828.74 |
5,911.74 |
9.8% |
1.4% |
|
|
|
|
|
|
| Crude Oil, WTI ($/barrel) |
$53.71 |
$48.07 |
$50.69 |
-5.6% |
5.5% |
| Gold (COMEX) ($/ounce) |
$1,152.50 |
$1,249.10 |
$1,250.10 |
8.5% |
0.1% |
|
|
|
|
|
|
| Fed Funds Target |
0.50 to 0.75% |
0.75 to 1.00% |
0.75 to 1.00% |
25 bp |
25 bp |
| 2-Year Treasury Yield |
1.21% |
1.26% |
1.26% |
5 bp |
0 bp |
| 10-Year Treasury Yield |
2.45% |
2.41% |
2.40% |
–5 bp |
–1 bp |
| Dollar Index |
102.26 |
99.74 |
100.46 |
-1.8% |
0.7% |
It looks like a slow first quarter but that doesn't mean it's not interesting. The consumer may be saving energy right now for a new push and it's possible that the factory sector may be about to pivot higher. Wages haven't been going very much but if they suddenly come alive, assumptions about flat core rates will have to go out the window.
The ISM manufacturing index has beaten the Econoday consensus the last six reports and leads off the week on Monday, and another stronger-than-expected result could raise spirits going into Friday's employment report. Unit vehicle sales follow on Tuesday and the call here is for another month of consumer disappointment. ADP, which is on a hot streak, will open Wednesday with the most closely watched estimate for Friday's employment report. Following in the afternoon will be minutes from what was a dovish March FOMC that, despite a rate hike, limited expectations for following hikes. Friday sees the March employment report where a winter-weather wildcard is in play and where the Econoday consensus is calling for significant slowing but a still solid result, at 178,000 for nonfarm payrolls vs February's 235,000.
ISM Manufacturing Index for March
Consensus Forecast: 57.1
Consensus Range: 56.0 to 58.5
With unusual strength in its sample, the ISM manufacturing index has beaten the Econoday consensus the last six reports in a row and by a sizable average of 1 full point and by 1.3 points in February. New orders have posted 3 straight 60 scores including a cycle-high 65.1 in February while backlogs surged to 57.5 for the best reading in 3 years, both of which point to special strength for production and employment in the March report. But this strength, as well as similar strength in other advance reports, has yet to appear in force in government data out of Washington. Forecasters are calling for a move lower, to 57.1 vs February's 57.7.
Construction Spending for February
Consensus Forecast, Month-to-Month Change: 1.0%
Consensus Range: 0.7% to 1.8%
Construction spending improved through the second half of last year but remains soft, still under 5 percent annual growth. Spending on new single-family homes has been improving while multi-family spending has remained strong. Public building has been very weak but not office and commercial spending which has also been strong. The Econoday consensus for February construction spending calls for a 1.0 percent gain vs January's 1.0 percent dip.
Total Vehicle Sales for March
Consensus Forecast, Annualized Rate: 17.4 million
Consensus Range: 17.2 to 17.8 million
North American-made Vehicle Sales
Consensus Forecast, Annualized Rate: 13.4 million
Consensus Range: 13.4 to 14.2 million
Unit vehicle sales offer strong indications for the motor vehicle component of monthly retail sales. After spiking late last year, vehicles sales opened the year flat which makes for easy comparisons in March. Yet forecasters don't see any improvement, at a consensus 17.4 million annualized rate in March which would be under 17.6 million in both February and January. A swing higher or lower than expected could have significant implications for first-quarter GDP.
International Trade Balance for February
Consensus Forecast: -$44.5 billion
Consensus Range: -$46.5 to -$43.6 billion
International trade is the Achilles' heel for U.S. GDP, subtracting nearly 2 points from the fourth-quarter which nevertheless managed a 2.1 percent annualized rate. Advance data on February goods shows a smaller but still very large gap at $64.8 billion. After adding in the nation's surplus on services exports, forecasters see the international trade gap for February falling to $44.5 billion from January's $48.5 billion. Any disappointment from the consensus would pull down first-quarter GDP estimates.
Factory Orders for February
Consensus Forecast, Month-to-Month Change: 1.0%
Consensus Range: 0.4% to 1.1%
Factory orders are on the rise and are expected to climb 1.0 percent at the headline level in February. Civilian aircraft, as indicated in the advance durable goods report, are expected to boost February's totals as they did in January. But capital goods orders, which offer a measure that goes to the heart of business investment, have been weak and have not confirmed the enormous strength in business confidence.
ADP, Private Payrolls for March
Consensus Forecast: 170,000
Consensus Range: 110,000 to 200,000
ADP's employment estimate not only predicted strength in both February and January payrolls but accurately predicted outlier strength. ADP's private-payroll call won't likely be as strong as February's 298,000, but anything over 200,000 would raise talk of a third strong employment report in a row. Forecasters don't see much strength for ADP's March call, at a consensus 170,000.
ISM Non-Manufacturing Index for March
Consensus Forecast: 57.0
Consensus Range: 56.0 to 58.0
ISM non-manufacturing is perhaps the most consistently strong of any advance indicator, holding at a very solid monthly growth rate in the mid-50s and rising a very sharp 1.1 points in February to 57.6. New orders have been over 60 for 3 straight months at the same time that backlogs have been rising which points to broad strength in March activity. The Econoday consensus for March is for a 6 tenths dip to 57.0.
FOMC Minutes
Covering the March 14 & 15 Meeting
The March FOMC produced an incremental 1/4-point hike but at the same time held back what were rising expectations for future hikes. FOMC members once again described economic growth as moderate and saw no threat that core inflation, which excludes energy, would threaten their 2 percent goal. They also opened their discussion about how and when to work down their $4.5 trillion balance sheet and details of the discussion are expected.
Initial Jobless Claims for April 1 week
Consensus Forecast: 250,000
Consensus Range: 245,000 to 254,000
The trend for jobless claims has been clouded by a correction to prior data, one tied to seasonal adjustments and which has lifted recent levels. The last two weeks of initial claims, at 258,000 and 261,000, are the highest this year. Expectations for the April 1 week center on a move slightly lower to 250,000.
Nonfarm Payrolls for March
Consensus Forecast: 178,000
Consensus Range: 130,000 to 200,000
Private Payrolls
Consensus Forecast: 170,000
Consensus Range: 125,000 to 205,000
Unemployment Rate
Consensus Forecast: 4.7%
Consensus Range: 4.6% to 4.8%
Average Hourly Earnings
Consensus Forecast, Month-to-Month Change: 0.3%
Consensus Range: 0.2% to 0.3%
Average Hourly Earnings
Consensus Forecast, Year-on-Year Change: 2.8%
Consensus Range: 2.7% to 2.9%
Average Workweek
Consensus Forecast: 34.4 hours
Consensus Range: 34.4 to 34.5 hours
Two prior months of much stronger-than-expected growth are not expected to be matched in March where the Econoday consensus is calling for a 178,000 rise in nonfarm payrolls. This would be very healthy but well down from 235,000 and 238,000 in the two prior months. The outlook for average hourly earnings is mixed with the month-to-month consensus looking for a sizable 0.3 percent gain but not the year-on-year rate which is seen unchanged at 2.8 percent. The unemployment rate, at a consensus 4.7 percent, is seen unchanged with the average workweek also seen unchanged 34.4 hours.
Wholesale Inventories for February
Consensus Forecast, Month-to-Month Change: 0.4%
Consensus Range: 0.2% to 0.4%
The build in wholesale inventories, in contrast to total inventories, has been limited relative to sales. Forecasters see wholesale inventories rising 0.4 percent in February in line with advance indications.
Consumer Credit for February
Consensus Forecast: $15.0 billion
Consensus Range: $11.0 to $18.0 billion
Consumer credit is expected to rise $15.0 billion in February following January's modest $8.8 billion gain. Credit growth has been slowing which hints at economic slowing. Consumers held back on credit-card borrowing in January as revolving credit fell $3.8 billion for the first monthly decline since February last year and the largest since December 2012.
|
