|
After Stella hit and following prior payroll strength, slowing in March was the conviction all along — but that was before Wednesday's estimate from Automated Data Processing that called for a 3rd straight oversized gain. The actual gain, at only 98,000 for nonfarm payrolls, turned out to be the weakest since May last year though, in defense of ADP, there are conflicting indications in March's report, and some of them do point to strength.
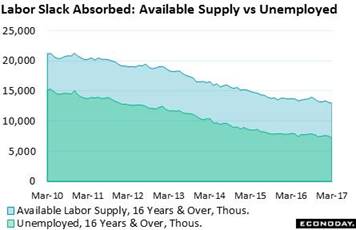 The unemployment rate in March fell an emphatic 2 tenths to 4.5 percent for the lowest rate since the height of the prior expansion, in April 2007. This rate is based, not on company payrolls, but on a separate survey of households. And the results, which unlike payrolls also track those not employed, are very positive and include a sizable 326,000 dip in the number of unemployed to 7.2 million. This drop helped pull down the available labor supply to just under 13 million. Very positive! The unemployment rate in March fell an emphatic 2 tenths to 4.5 percent for the lowest rate since the height of the prior expansion, in April 2007. This rate is based, not on company payrolls, but on a separate survey of households. And the results, which unlike payrolls also track those not employed, are very positive and include a sizable 326,000 dip in the number of unemployed to 7.2 million. This drop helped pull down the available labor supply to just under 13 million. Very positive!
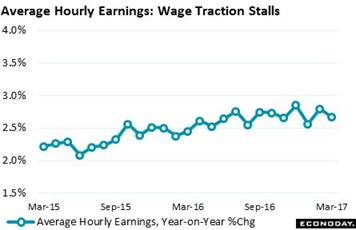 But this is where the good news ends. The shrinking of available labor is not, as it's supposed to, helping wage traction much. Average hourly earnings rose only 0.2 percent in March with the year-on-year rate edging down, not up, by 1 tenth to an unimpressive 2.7 percent. This rate, which was near 4 percent back in 2007, has to get to 3 percent before contributing much to overall prices. Lack of skilled entrants is a likely cause of this weakness, pointing to an abundance of low paying jobs and further trouble for productivity. But this is where the good news ends. The shrinking of available labor is not, as it's supposed to, helping wage traction much. Average hourly earnings rose only 0.2 percent in March with the year-on-year rate edging down, not up, by 1 tenth to an unimpressive 2.7 percent. This rate, which was near 4 percent back in 2007, has to get to 3 percent before contributing much to overall prices. Lack of skilled entrants is a likely cause of this weakness, pointing to an abundance of low paying jobs and further trouble for productivity.
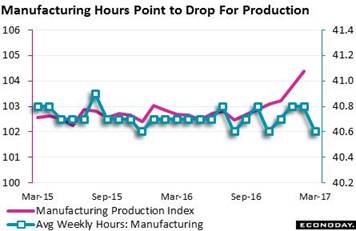 Lack of strong candidates may be only one reason for wage weakness. Soft output may be another. The workweek declined 1 tenth to 34.3 hours which is as low as it's been since the expansion first started heating up 6 years ago. And in a specific indication of factory slowing, manufacturing hours fell 2 tenths to 40.6 hours which points to a March reversal for manufacturing production. Stella may not only have held back payroll growth, it may also have jostled the economy itself. Lack of strong candidates may be only one reason for wage weakness. Soft output may be another. The workweek declined 1 tenth to 34.3 hours which is as low as it's been since the expansion first started heating up 6 years ago. And in a specific indication of factory slowing, manufacturing hours fell 2 tenths to 40.6 hours which points to a March reversal for manufacturing production. Stella may not only have held back payroll growth, it may also have jostled the economy itself.
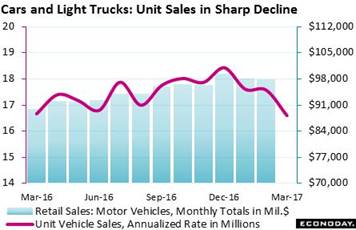 But payroll weakness wasn't the first March surprise. That goes to Monday's unit vehicle sales where the annualized rate fell to 16.6 million to fill out a very soft first-quarter for the auto sector. Unit sales point squarely at a 3rd straight contraction for motor vehicles in the retail sales report. This in turn points to weakness for total consumer spending. New vehicles are expensive and, no matter how confident consumers may be, what they really need are strong wages. But payroll weakness wasn't the first March surprise. That goes to Monday's unit vehicle sales where the annualized rate fell to 16.6 million to fill out a very soft first-quarter for the auto sector. Unit sales point squarely at a 3rd straight contraction for motor vehicles in the retail sales report. This in turn points to weakness for total consumer spending. New vehicles are expensive and, no matter how confident consumers may be, what they really need are strong wages.
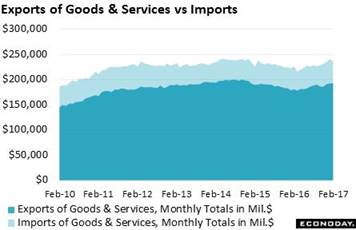 Falling vehicle sales are not a positive indication for first-quarter GDP and neither is a rising trade deficit. The deficit averaged $45.9 billion in January and February which is well up from the fourth-quarter's monthly average of $44.1 billion. Though rising so far this year, the deficit has been roughly stable at $42 billion per month over the 7-1/2 years of this expansion. Dollar strength over this period (up about 25 percent on a trade-weighted basis) is one reason for the gap, but strong U.S. demand for foreign goods is another. Falling vehicle sales are not a positive indication for first-quarter GDP and neither is a rising trade deficit. The deficit averaged $45.9 billion in January and February which is well up from the fourth-quarter's monthly average of $44.1 billion. Though rising so far this year, the deficit has been roughly stable at $42 billion per month over the 7-1/2 years of this expansion. Dollar strength over this period (up about 25 percent on a trade-weighted basis) is one reason for the gap, but strong U.S. demand for foreign goods is another.
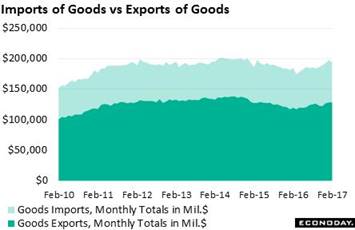 The greatest point of dollar outflow (along with the government's deficit) is the steep gap between goods the U.S. sells abroad and the goods the U.S. buys from abroad. This gap has averaged about $60 billion per month over the expansion and has been showing no signs at all of letting up. Monthly deficits for consumer goods, for vehicles and of course for oil are fixed features of the economy. And the other side of the gap, one that is not improving, is weak foreign demand for U.S. goods. The greatest point of dollar outflow (along with the government's deficit) is the steep gap between goods the U.S. sells abroad and the goods the U.S. buys from abroad. This gap has averaged about $60 billion per month over the expansion and has been showing no signs at all of letting up. Monthly deficits for consumer goods, for vehicles and of course for oil are fixed features of the economy. And the other side of the gap, one that is not improving, is weak foreign demand for U.S. goods.
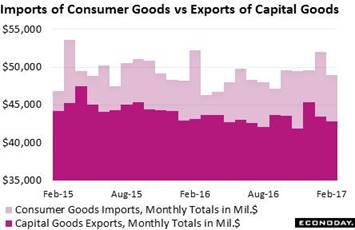 U.S. machinery and aircraft and electronics rival any in the world. Yet foreign demand for U.S. capital goods has been in a 2-year slump. This reflects the strong dollar to a degree and also the oil-related decline in energy equipment. But this is hitting at a time when U.S. demand for consumer goods, and here's where China comes in, shows no indication of easing. This gap first started to appear about 2 years ago and, in itself, represents an increasing monthly dollar outflow of $5 to $10 billion. U.S. machinery and aircraft and electronics rival any in the world. Yet foreign demand for U.S. capital goods has been in a 2-year slump. This reflects the strong dollar to a degree and also the oil-related decline in energy equipment. But this is hitting at a time when U.S. demand for consumer goods, and here's where China comes in, shows no indication of easing. This gap first started to appear about 2 years ago and, in itself, represents an increasing monthly dollar outflow of $5 to $10 billion.
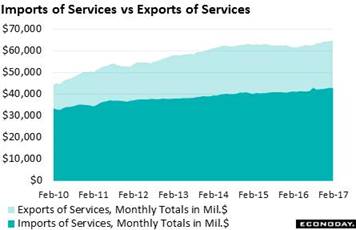 Demand for the nation's goods may be not that great but demand for U.S. technical and managerial services is. The net dollar inflow from services has moved from the $10 billion monthly range at the beginning of the expansion to more than $20 billion the last 4 years. But here, too, the news hasn't been getting better. The net services surplus, holding at $21.4 billion the last 4 months, is still under its $22 billion peak two years ago. Demand for the nation's goods may be not that great but demand for U.S. technical and managerial services is. The net dollar inflow from services has moved from the $10 billion monthly range at the beginning of the expansion to more than $20 billion the last 4 years. But here, too, the news hasn't been getting better. The net services surplus, holding at $21.4 billion the last 4 months, is still under its $22 billion peak two years ago.
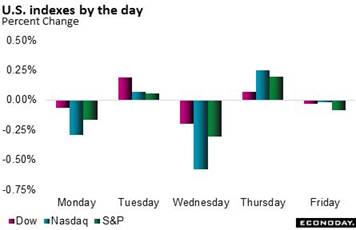 Tangible acceleration in the economy following Donald Trump's election has yet to appear, and following the unsuccessful attempt last month to repeal Obamacare demand for stocks has been on the decline and demand for long-term Treasuries on the rise. These are signals that expectations for growth are being scaled back. After all the week's action, which also included FOMC talk of winding down its balance sheet and a missile strike against Syria, the 10-year yield ended very little changed, down 1 basis at 2.39 percent with the dollar also little changed. Stocks likewise held steady as the Dow posted a fractional loss on the week to 20,656.10. Tangible acceleration in the economy following Donald Trump's election has yet to appear, and following the unsuccessful attempt last month to repeal Obamacare demand for stocks has been on the decline and demand for long-term Treasuries on the rise. These are signals that expectations for growth are being scaled back. After all the week's action, which also included FOMC talk of winding down its balance sheet and a missile strike against Syria, the 10-year yield ended very little changed, down 1 basis at 2.39 percent with the dollar also little changed. Stocks likewise held steady as the Dow posted a fractional loss on the week to 20,656.10.
| Markets at a Glance |
Year-End |
Week Ended |
Week Ended |
Year-To-Date |
Weekly |
|
2016 |
31-Mar-17 |
7-Apr-17 |
Change |
Change |
| DJIA |
19,762.60 |
20,663.22 |
20,656.10 |
4.5% |
0.0% |
| S&P 500 |
2,238.83 |
2,362.72 |
2,355.54 |
5.2% |
-0.3% |
| Nasdaq Composite |
5,383.12 |
5,911.74 |
5,877.81 |
9.2% |
-0.6% |
|
|
|
|
|
|
| Crude Oil, WTI ($/barrel) |
$53.71 |
$50.69 |
$52.24 |
-2.7% |
3.1% |
| Gold (COMEX) ($/ounce) |
$1,152.50 |
$1,250.10 |
$1,256.50 |
9.0% |
0.5% |
|
|
|
|
|
|
| Fed Funds Target |
0.50 to 0.75% |
0.75 to 1.00% |
0.75 to 1.00% |
25 bp |
0 bp |
| 2-Year Treasury Yield |
1.21% |
1.26% |
1.28% |
7 bp |
2 bp |
| 10-Year Treasury Yield |
2.45% |
2.40% |
2.39% |
–6 bp |
–1 bp |
| Dollar Index |
102.26 |
100.46 |
100.9 |
-1.3% |
0.4% |
Stella was a category 3 storm and one of the biggest to hit the Northeast in 2 dozen years. It apparently subdued hiring in March in a lull, however, that looks to be reversed in April. But even if payrolls do pop back up, the decline in the available workforce may limit the degree of possible growth. And job growth aside, the lack of wage growth is certain to limit the consumer's contribution to GDP. The week's data, both consumer and international trade, had a softness to it that points to another disappointing first quarter, perhaps an especially disappointing first quarter.
Recent economic data, underscored by the March employment report, have been flat, and that is exactly the expectation for the coming week's numbers. The small business optimism index has, like many other anecdotal reports, been very strong but a scaling back in Tuesday's report is expected. Three important inflation headlines will be posted and none are expected to show gains: import prices down 0.2 percent, producer prices unchanged, consumer prices unchanged. The call for the cores are little better, at plus 0.2 percent for both producer and consumer prices. Consumer sentiment, normally released Friday, has been moved up to Thursday and forecasters see no change for an index that is at firm levels but has already scaled back from its post-election highs. The biggest news in the week is likely to be Friday's retail sales report where once again no change is expected, an important indication on the consumer that would extend the economy's flat run of data.
Small Business Optimism Index for March
Consensus Forecast: 104.8
Consensus Range: 104.0 to 107.0
The small business optimism index has held at expansion highs following the election led by economic optimism and strong employment readings. Sales expectations and capital improvement plans have also been strong. The Econoday consensus for March is calling for slight give back to 104.8, down from February's 105.3.
Import Prices for March
Consensus Forecast, Month-to-Month Change: -0.2%
Consensus Range: -0.5% to 0.1%
Export Prices
Consensus Forecast, Month-to-Month Change: 0.1%
Consensus Range: -0.5% to 0.4%
Oil prices fell sharply in March compared to February which points to weakness for March import prices. On the export side, farm prices have been firm though the comparison with a sharp gain in February is difficult. Forecasters see import prices dipping 0.2 percent vs a 0.2 percent increase in February with export prices seen rising 0.1 percent vs the prior month's increase of 0.3 percent.
Initial Jobless Claims for April 8 week
Consensus Forecast: 243,000
Consensus Range: 239,000 to 245,000
Jobless claims fell sharply in the prior week though comparisons with much of March, where seasonal adjustments lifted totals, may have exaggerated the improvement. Initial jobless claims in the April 8 week are expected to reverse some of the decline in the April 1 week, rising 9,000 to a consensus 243,000.
PPI-FD for March
Consensus Forecast, Month-to-Month Change: 0.0%
Consensus Range: -0.2% to 0.1%
PPI-FD Less Food & Energy
Consensus Forecast, Month-to-Month Change: 0.2%
Consensus Range: 0.1% to 0.4%
PPI-FD Less Food, Energy, & Trade Services
Consensus Forecast, Month-to-Month Change: 0.2%
Consensus Range: 0.2% to 0.3%
Higher energy was a main factor in February's 0.3 percent increase in producer prices with lower energy pointing to a flat March. Service prices were also a main factor in the February increase and a second month of pressure here could raise expectations for pass through to consumer prices. Forecaster see the PPI-FD headline for March unchanged with less energy and food seen at plus 0.2 percent. When excluding food, energy & trade services, the Econoday consensus gain is also 0.2 percent. Like the CPI and PCE price indexes, the year-on-year rate for the PPI-FD is at a 5-year high, at 2.2 percent in February.
Consumer Sentiment Index, Preliminary April
Consensus Forecast: 97.0
Consensus Range: 95.5 to 97.5
The consumer sentiment index remains strong but has been edging back from post-election highs, peaking at 98.5 in January and ending March at 96.9. The falloff has been centered in the expectations component and includes an unusual decline in inflation expectations. In contrast, the current conditions component has continued to make new highs. Econoday's consensus for preliminary March calls for a steady reading, at 97.0.
Consumer Price Index for March
Consensus Forecast, Month-to-Month Change: 0.0%
Consensus Range: -0.1% to 0.2%
Consumer Price Index
Consensus Forecast, Year-on-Year Change: 2.6%
Consensus Range: 2.6% to 2.8%
CPI Core, Less Food & Energy
Consensus Forecast, Month-to-Month Change: 0.2%
Consensus Range: 0.1% to 0.3%
CPI Core, Less Food & Energy
Consensus Forecast, Year-on-Year Change: 2.3%
Consensus Range: 2.2% to 2.4%
A 2 tenths jump in February's year-on-year consumer price index to 2.7 percent foretold a similar jump in the Federal Reserve's PCE price target, with both at 5-year highs. But when excluding food and importantly energy, the core rate for both the CPI and PCE have been steady and below target and ultimately reflect lack of wage pressure for labor. Forecasters expect the consumer price index to remain unchanged in March with the year-on-year rate slowing 1 tenth to 2.6 percent. When excluding food & energy, a 0.2 percent monthly gain is expected while the call for the yearly rate is 2.3 percent vs February's 2.2 percent.
Retail Sales for March
Consensus Forecast: 0.0%
Consensus Range: -0.5% to 0.3%
Retail Sales Ex-Autos
Consensus Forecast: 0.2%
Consensus Range: -0.2% to 0.4%
Retail Sales Ex-Autos Ex-Gas
Consensus Forecast: 0.3%
Consensus Range: 0.0% to 0.4%
Retail Sales Control Group (Ex-Food Services, Ex-Autos, Ex-Gas, Ex-Building Materials)
Consensus Forecast: 0.3%
Consensus Range: 0.2% to 0.4%
Retail sales are once again expected to be held back by autos and otherwise show only moderate growth. The Econoday consensus is for no change at the headline level and up only 0.2 percent ex-auto. The ex-auto ex-gas reading is seen at 0.3 percent as is the control group. Heavy weather may have been a negative factor in the month.
Business Inventories for February
Consensus Forecast, Month-to-Month Change: 0.3%
Consensus Range: 0.2% to 0.4%
Inventories rose in the fourth quarter though the build may have leveled off since. Business inventories in January rose a moderate 0.3 percent with forecasters looking for another 0.3 percent build in February. Though adding to GDP, rising inventories in a slow growth economy pose risks to future production and future employment.
|
