|
Equities finished the holiday shortened week on the downside. Geopolitical risks and the looming earnings season weighed on investors' risk appetite. Economic data were light with the exception of China where the monthly outpouring of data is currently taking place. Most equity indexes declined with only four indexes of those covered here higher on the week. The PSEi was up 0.6 percent, the SET and All Ordinaries added 0.4 percent and the OMX was 0.2 percent higher. Losses ranged from 0.1 percent (SMI) to 2.1 percent (Topix) and 2.6 percent (MIB). Investors are focused on news from the new U.S. administration and react to it.
In addition to geopolitical risks, bond yields have been driven lower by a growing belief among investors that much of U.S. President Donald Trump's stimulus and deregulation plans will take many months to implement. Yields declined even though FOMC members indicated the Fed could start shrinking its balance sheet later this year.
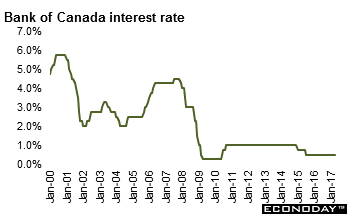 The Bank of Canada announced its monetary policy decision and at the same time released its quarterly Monetary Policy Report (MPR). And as expected, there were no changes to the Bank of Canada's key interest rates. The overnight rate stayed at 0.50 percent where it has been since July 2015 while the deposit rate (0.25 percent) and the Bank Rate (0.75 percent) also remained unchanged. The Bank of Canada announced its monetary policy decision and at the same time released its quarterly Monetary Policy Report (MPR). And as expected, there were no changes to the Bank of Canada's key interest rates. The overnight rate stayed at 0.50 percent where it has been since July 2015 while the deposit rate (0.25 percent) and the Bank Rate (0.75 percent) also remained unchanged.
According to the BoC, global economic growth is strengthening and becoming more broadly based than the Bank had expected in the January MPR. However, there is still considerable uncertainty about the outlook. While the Bank's governing council acknowledged strength in recent data, it remains mindful of the significant uncertainties weighing on the outlook and considers its current policy appropriate.
The BoC noted that economic growth has been faster than had been expected in the January MPR. Growth was temporarily boosted by a resumption of spending in the oil and gas sector and the effects of the Canada Child Benefit on consumer spending. Residential investment has also been stronger than expected. Employment data have been robust, although gains in hours worked are still soft. Meanwhile, export growth has been uneven in the face of ongoing competitive challenges. Despite a recent improvement in business sentiment, business investment remains well below what could be expected at this stage in the recovery. Accordingly, while the recent rebound in GDP is encouraging, the BoC says it is too early to conclude that the economy is on a sustainable growth path.
During the rest of this year and into 2018 and 2019, growth in Canada is expected to moderate but remain above potential. At the same time, its composition is expected to broaden as the pace of household spending — especially residential investment — slows while the contributions from exports and business investment increase. CPI inflation is now at the 2 percent target, largely because of the transitory effects of higher oil prices and carbon pricing measures in two provinces, as well as other temporary factors.
| |
|
2016 |
2017 |
% Change |
|
Index |
Dec 31 |
April 7 |
April 14 |
Week |
2017 |
| Asia/Pacific |
|
|
|
|
|
|
| Australia |
All Ordinaries |
5719.1 |
5902.6 |
5925.87 |
0.4% |
3.6% |
| Japan |
Nikkei 225 |
19114.4 |
18664.6 |
18335.63 |
-1.8% |
-4.1% |
|
Topix |
1518.61 |
1489.77 |
1459.07 |
-2.1% |
-3.9% |
| Hong Kong |
Hang Seng |
22000.6 |
24267.3 |
24261.66 |
0.0% |
10.3% |
| S. Korea |
Kospi |
2026.5 |
2151.7 |
2134.88 |
-0.8% |
5.4% |
| Singapore |
STI |
2880.8 |
3177.3 |
3169.24 |
-0.3% |
10.0% |
| China |
Shanghai Composite |
3103.6 |
3286.6 |
3246.07 |
-1.2% |
4.6% |
|
|
|
|
|
|
|
| India |
Sensex 30 |
26626.5 |
29706.61 |
29461.45 |
-0.8% |
10.6% |
| Indonesia |
Jakarta Composite |
5296.7 |
5653.5 |
5616.55 |
-0.7% |
6.0% |
| Malaysia |
KLCI |
1641.7 |
1741.7 |
1730.99 |
-0.6% |
5.4% |
| Philippines |
PSEi |
6840.6 |
7583.8 |
7629.64 |
0.6% |
11.5% |
| Taiwan |
Taiex |
9253.5 |
9873.4 |
9732.93 |
-1.4% |
5.2% |
| Thailand |
SET |
1542.9 |
1583.5 |
1589.50 |
0.4% |
3.0% |
|
|
|
|
|
|
|
| Europe |
|
|
|
|
|
|
| UK |
FTSE 100 |
7142.8 |
7349.4 |
7327.59 |
-0.3% |
2.6% |
| France |
CAC |
4862.3 |
5135.3 |
5071.10 |
-1.2% |
4.3% |
| Germany |
XETRA DAX |
11481.1 |
12225.1 |
12109.00 |
-0.9% |
5.5% |
| Italy |
FTSE MIB |
19234.6 |
20300.1 |
19773.68 |
-2.6% |
2.8% |
| Spain |
IBEX 35 |
9352.1 |
10529.0 |
10326.10 |
-1.9% |
10.4% |
| Sweden |
OMX Stockholm 30 |
1517.2 |
1569.7 |
1572.81 |
0.2% |
3.7% |
| Switzerland |
SMI |
8219.9 |
8640.9 |
8629.02 |
-0.1% |
5.0% |
|
|
|
|
|
|
|
| North America |
|
|
|
|
|
|
| United States |
Dow |
19762.6 |
20656.10 |
20453.25 |
-1.0% |
3.5% |
|
NASDAQ |
5383.1 |
5877.8 |
5805.15 |
-1.2% |
7.8% |
|
S&P 500 |
2238.8 |
2355.5 |
2328.95 |
-1.1% |
4.0% |
| Canada |
S&P/TSX Comp. |
15287.6 |
15667.1 |
15535.48 |
-0.8% |
1.6% |
| Mexico |
Bolsa |
45642.9 |
49343.6 |
48955.820 |
-0.8% |
7.3% |
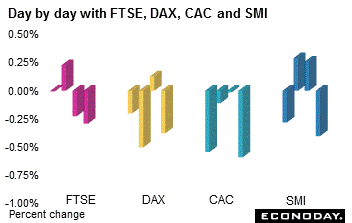 Equities retreated in the holiday shortened week. With markets closed on Friday and Monday, traders were cautious before a four day holiday weekend. Persistent geopolitical concerns and comments from U.S. President Trump on the U.S. dollar weighed on investor sentiment. The FTSE was down 0.3 percent on the week, the CAC declined 1.2 percent, the DAX lost 0.9 percent and the SMI slipped 0.1 percent. The DAX and SMI were down for a second consecutive week. The looming first round in the French national election will be held on April 23 — this also weighed on sentiment with daily polls indicating a very tight race. And continuing geopolitical concerns over Syria and North Korea also resulted in cautious trading. Equities retreated in the holiday shortened week. With markets closed on Friday and Monday, traders were cautious before a four day holiday weekend. Persistent geopolitical concerns and comments from U.S. President Trump on the U.S. dollar weighed on investor sentiment. The FTSE was down 0.3 percent on the week, the CAC declined 1.2 percent, the DAX lost 0.9 percent and the SMI slipped 0.1 percent. The DAX and SMI were down for a second consecutive week. The looming first round in the French national election will be held on April 23 — this also weighed on sentiment with daily polls indicating a very tight race. And continuing geopolitical concerns over Syria and North Korea also resulted in cautious trading.
Data from the UK indicated that consumer and producer output prices were up 2.3 percent and 3.6 percent respectively on the year. The ILO jobless rate for the three months ending in February remained at 4.7 percent. However, the claimant count unemployment climbed by a surprising 25,000 in March. And average weekly earnings excluding bonuses continued to be soft. The ZEW survey indicated that business sentiment in Germany continued to climb with improvements in both the current conditions and expectations components of the index.
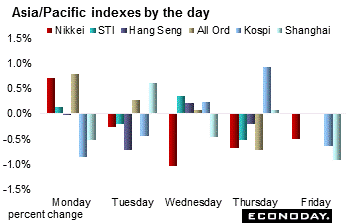 Equities were mostly lower thanks especially to geopolitical worries (especially with North Korea) that dented confidence in the global economy. On the week, declines ranged from 2.1 percent (Topix) to 0.3 percent (STI). The Hang Seng was virtually unchanged (down 5.64 points). Equities were mostly lower thanks especially to geopolitical worries (especially with North Korea) that dented confidence in the global economy. On the week, declines ranged from 2.1 percent (Topix) to 0.3 percent (STI). The Hang Seng was virtually unchanged (down 5.64 points).
Japanese stocks tumbled for a fifth week dropping to a four month low Friday. The Nikkei lost 1.7 percent while the Topix was 2.1 percent lower on the week. Equities continued to reflect changes in the value of the yen to the U.S. dollar — the yen remains a safe haven currency. A stronger yen reduces exporters' overseas profits when repatriated.
The Bank of Japan will continue its massive stimulus until inflation moves near its 2 percent inflation target, BoJ Governor Haruhiko Kuroda said early in the week. He presented a quarterly report that showed a better economic assessment for one of the nine regions.
The Shanghai Composite lost 1.2 percent last week, declining three of five trading days. Shares edged up a bit Thursday thanks to positive merchandise trade data that helped investors shrug off fears of policy tightening. China's producer price inflation cooled for the first time in seven months in March as iron ore and coal prices tumbled, pressured by fears that the country's steel production is outweighing demand and threatening a glut of the metal this year. Beijing announced plans to build Xiongan New Area, modelled on the Shenzhen special economic zone next to Hong Kong that helped kickstart China's economic reforms in 1980.
The All Ordinaries was one of three indexes that was positive for the week adding 0.4 percent. Sentiment was boosted by a better than anticipated labour market report. In March, the Australian economy added 60,900 full time jobs following the loss of 6,400 jobs in the previous month. March business confidence strengthened to the highest level since global financial crisis according to a National Australia Bank survey. The business conditions index rose by 5 points to 14 in March, the highest since 2008.
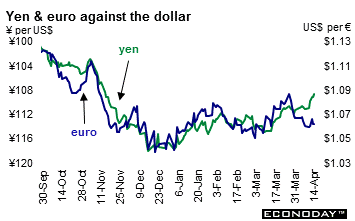 The U.S. dollar tumbled against its major counterparts including the euro, yen, Swiss franc, pound sterling and the Canadian and Australian dollars last week. The currency declined after President Trump's comments earlier in the week that the U.S. currency was "getting too strong" and that he would like to see interest rates stay low. The Japanese yen hit a five month high at week's end. Although the euro also advanced for the first time in three weeks, it was a much more moderate gain. Uncertainty over the French presidential election on April 23 continues to weigh on the currency. The U.S. dollar tumbled against its major counterparts including the euro, yen, Swiss franc, pound sterling and the Canadian and Australian dollars last week. The currency declined after President Trump's comments earlier in the week that the U.S. currency was "getting too strong" and that he would like to see interest rates stay low. The Japanese yen hit a five month high at week's end. Although the euro also advanced for the first time in three weeks, it was a much more moderate gain. Uncertainty over the French presidential election on April 23 continues to weigh on the currency.
The yen climbed to the mid-108 range against the U.S. dollar. Analysts said that profits will suffer if the yen strengthens beyond its current level, and will improve if it weakens, making the 108-yen mark a make-or-break point for corporate earnings.
|
|
2016 |
2017 |
% Change |
|
|
Dec 30 |
April 7 |
April 14 |
Week |
2016 |
| U.S. $ per currency |
|
|
|
|
|
|
| Australia |
A$ |
0.7215 |
0.750 |
0.758 |
1.0% |
5.0% |
| New Zealand |
NZ$ |
0.6948 |
0.694 |
0.701 |
1.0% |
0.8% |
| Canada |
C$ |
0.7443 |
0.746 |
0.751 |
0.6% |
0.8% |
| Eurozone |
euro (€) |
1.0534 |
1.060 |
1.062 |
0.2% |
0.8% |
| UK |
pound sterling (£) |
1.2333 |
1.237 |
1.253 |
1.3% |
1.6% |
|
|
|
|
|
|
|
| Currency per U.S. $ |
|
|
|
|
|
|
| China |
yuan |
6.9450 |
6.901 |
6.885 |
0.2% |
0.9% |
| Hong Kong |
HK$* |
7.7533 |
7.769 |
7.773 |
-0.1% |
-0.2% |
| India |
rupee |
67.9238 |
64.280 |
64.411 |
-0.2% |
5.5% |
| Japan |
yen |
116.8100 |
111.140 |
108.620 |
2.3% |
7.5% |
| Malaysia |
ringgit |
4.4862 |
4.435 |
4.407 |
0.6% |
1.8% |
| Singapore |
Singapore $ |
1.4465 |
1.404 |
1.397 |
0.5% |
3.5% |
| South Korea |
won |
1205.8300 |
1134.450 |
1139.900 |
-0.5% |
5.8% |
| Taiwan |
Taiwan $ |
32.3260 |
30.603 |
30.369 |
0.8% |
6.4% |
| Thailand |
baht |
35.8100 |
34.600 |
34.340 |
0.8% |
4.3% |
| Switzerland |
Swiss franc |
1.0174 |
1.0083 |
1.0043 |
0.4% |
1.3% |
| *Pegged to U.S. dollar |
|
|
|
|
|
|
| Source: Bloomberg |
|
|
|
|
|
|
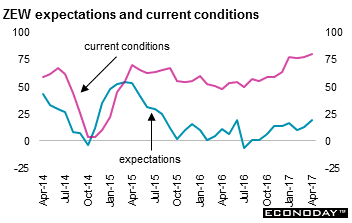 April ZEW survey found analysts somewhat more upbeat about the German economy. Not only was there an improvement in the assessment of current conditions but expectations were also more optimistic. The current conditions gauge was up almost 3 points at 80.1, its fourth rise in the last five months and its highest level since July 2011. Expectations rose a sharper 6.7 points to 19.5, their best reading since August 2015, and have now fallen only once in the last nine months. April ZEW survey found analysts somewhat more upbeat about the German economy. Not only was there an improvement in the assessment of current conditions but expectations were also more optimistic. The current conditions gauge was up almost 3 points at 80.1, its fourth rise in the last five months and its highest level since July 2011. Expectations rose a sharper 6.7 points to 19.5, their best reading since August 2015, and have now fallen only once in the last nine months.
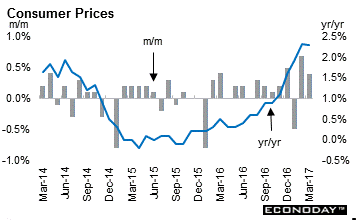 March consumer prices were up a monthly 0.4 percent and 2.3 percent on the year. However, the stability of the headline yearly rate masked some divergent developments within the CPI basket. In particular, food prices rose 0.6 percent on the month but fell in March 2016. Alcohol followed a similar pattern. Combined, these categories provided a significant boost to the change in the annual inflation rate. Clothing prices (a rise of 2.0 percent against a rise of 1.0 percent) also provided a lift. However, transport charges went completely the other way, with a late Easter contributing towards a 3.9 percent monthly drop in air fares last month compared with a nearly 23 percent surge in March 2016. This saw the transport sector subtract almost 0.3 percentage points from the headline annual change. Consequently, the core CPI advanced 0.4 percent from February and, at 1.8 percent, its annual rate was down 0.2 percentage points from last time. This was its first decline in five months. March consumer prices were up a monthly 0.4 percent and 2.3 percent on the year. However, the stability of the headline yearly rate masked some divergent developments within the CPI basket. In particular, food prices rose 0.6 percent on the month but fell in March 2016. Alcohol followed a similar pattern. Combined, these categories provided a significant boost to the change in the annual inflation rate. Clothing prices (a rise of 2.0 percent against a rise of 1.0 percent) also provided a lift. However, transport charges went completely the other way, with a late Easter contributing towards a 3.9 percent monthly drop in air fares last month compared with a nearly 23 percent surge in March 2016. This saw the transport sector subtract almost 0.3 percentage points from the headline annual change. Consequently, the core CPI advanced 0.4 percent from February and, at 1.8 percent, its annual rate was down 0.2 percentage points from last time. This was its first decline in five months.
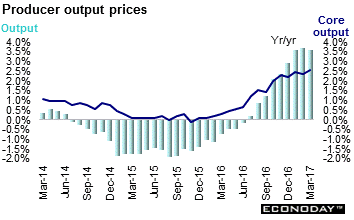 March output producer prices were up 0.4 percent on the month, or double their unrevised February increase. But this advance was still small enough to see their annual rate slip from 3.7 percent to 3.6 percent. Input costs also advanced 0.4 percent from February. On the year, the gain declined from 19.4 percent to 17.9 percent. Output prices were lifted by a 1.6 percent monthly increase in tobacco & alcohol charges as well as a 0.6 percent advance in food. A partial offset came from petroleum products (down 0.9 percent). The core index rose 0.3 percent on the month and 2.5 percent on the year. The monthly increase in raw material & fuel costs was dominated by a 2.5 percent rise in imported metals and 1.5 percent gains in both imported food and imported chemicals. Fuel (down 1.5 percent) and crude oil (down 1.8 percent) acted as a brake. March output producer prices were up 0.4 percent on the month, or double their unrevised February increase. But this advance was still small enough to see their annual rate slip from 3.7 percent to 3.6 percent. Input costs also advanced 0.4 percent from February. On the year, the gain declined from 19.4 percent to 17.9 percent. Output prices were lifted by a 1.6 percent monthly increase in tobacco & alcohol charges as well as a 0.6 percent advance in food. A partial offset came from petroleum products (down 0.9 percent). The core index rose 0.3 percent on the month and 2.5 percent on the year. The monthly increase in raw material & fuel costs was dominated by a 2.5 percent rise in imported metals and 1.5 percent gains in both imported food and imported chemicals. Fuel (down 1.5 percent) and crude oil (down 1.8 percent) acted as a brake.
 March claimant count unemployment jumped 25,500. This followed a smaller revised 6,100 drop in February and saw the jobless rate edge up a tick to 2.2 percent, its first rise since August 2016. ILO unemployment declined 45,000 in the three months to February that left its measure of the jobless rate flat at 4.7 percent. There was also a 16,000 increase in vacancies which lifted them to a new record high. However, wages were again soft with headline average annual earnings growth flat at 2.3 percent and, excluding bonuses, down 0.2 percentage points at 2.2 percent. March claimant count unemployment jumped 25,500. This followed a smaller revised 6,100 drop in February and saw the jobless rate edge up a tick to 2.2 percent, its first rise since August 2016. ILO unemployment declined 45,000 in the three months to February that left its measure of the jobless rate flat at 4.7 percent. There was also a 16,000 increase in vacancies which lifted them to a new record high. However, wages were again soft with headline average annual earnings growth flat at 2.3 percent and, excluding bonuses, down 0.2 percentage points at 2.2 percent.
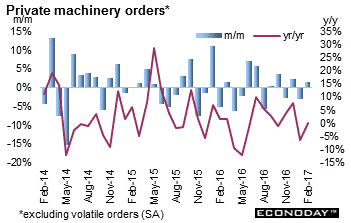 February private sector machinery orders (excluding volatile items) were up 1.5 percent on the month (seasonally adjusted) after dropping 3.2 percent in January. This series, which excludes orders for ships and those from electric power companies, is considered a proxy for capital expenditures. Orders were flat on the year after sinking 6.6 percent the month before. In original terms, machinery orders (excluding volatile items) rose 5.6 percent on the year after falling by 8.2 percent in January. The rebound in February was largely driven by the manufacturing sector, which posted an increase in orders of 6.0 percent after dropping sharply by 10.6 percent in January. Annual growth in machinery manufacturing orders also strengthened from a decline of 22.0 percent to an increase of 9.5 percent. Within the manufacturing sector there was wide variation in the growth of orders among various industries. Non-manufacturing orders (excluding volatile items) were up a monthly 1.8 percent after an increase increasing 2.7 percent. Growth in these orders also showed considerable variation between different industries within the sector. February private sector machinery orders (excluding volatile items) were up 1.5 percent on the month (seasonally adjusted) after dropping 3.2 percent in January. This series, which excludes orders for ships and those from electric power companies, is considered a proxy for capital expenditures. Orders were flat on the year after sinking 6.6 percent the month before. In original terms, machinery orders (excluding volatile items) rose 5.6 percent on the year after falling by 8.2 percent in January. The rebound in February was largely driven by the manufacturing sector, which posted an increase in orders of 6.0 percent after dropping sharply by 10.6 percent in January. Annual growth in machinery manufacturing orders also strengthened from a decline of 22.0 percent to an increase of 9.5 percent. Within the manufacturing sector there was wide variation in the growth of orders among various industries. Non-manufacturing orders (excluding volatile items) were up a monthly 1.8 percent after an increase increasing 2.7 percent. Growth in these orders also showed considerable variation between different industries within the sector.
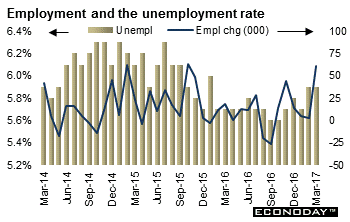 March employment jumped by 60,900 after declining by 6,400 in February. This was the biggest monthly gain since October 2015. The unemployment rate was steady at 5.9 percent, while the participation rate rose from 64.6 to 64.8. The increase in employment was driven by full-time jobs, which were up 74,500 after a drop of 33,500 in February. This was only partly offset by a 13,600 drop in the number of part-time employed persons, partly reversing the increase of 27,100 seen the previous month. Over the last 12 months, seasonally-adjusted full-time employment has increased by 67,800 persons, while part-time employment has increased by 78,100 persons. March employment jumped by 60,900 after declining by 6,400 in February. This was the biggest monthly gain since October 2015. The unemployment rate was steady at 5.9 percent, while the participation rate rose from 64.6 to 64.8. The increase in employment was driven by full-time jobs, which were up 74,500 after a drop of 33,500 in February. This was only partly offset by a 13,600 drop in the number of part-time employed persons, partly reversing the increase of 27,100 seen the previous month. Over the last 12 months, seasonally-adjusted full-time employment has increased by 67,800 persons, while part-time employment has increased by 78,100 persons.
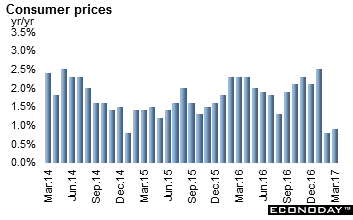 March consumer prices were up 0.9 percent on the year after increasing 0.8 percent the month before. On the month, the CPI was down 0.3 percent. Inflation remains well below the 2.5 percent level recorded in January, when lunar New Year holidays took place. Year-to-date, the CPI was up 1.4 percent compared with the same period in 2016. Weaker food prices are the main factor weighing on headline inflation in March, down 4.4 percent on the year. Non-food inflation, in contrast, has picked up since the end of the year, increasing from 2.0 percent in December to 2.3 percent in March. Transportation & communication prices, in particular, are showing stronger annual increases, while health care costs have also risen more quickly. The urban CPI was up 1.0 percent on the year while the rural CPI was up 0.6 percent. March consumer prices were up 0.9 percent on the year after increasing 0.8 percent the month before. On the month, the CPI was down 0.3 percent. Inflation remains well below the 2.5 percent level recorded in January, when lunar New Year holidays took place. Year-to-date, the CPI was up 1.4 percent compared with the same period in 2016. Weaker food prices are the main factor weighing on headline inflation in March, down 4.4 percent on the year. Non-food inflation, in contrast, has picked up since the end of the year, increasing from 2.0 percent in December to 2.3 percent in March. Transportation & communication prices, in particular, are showing stronger annual increases, while health care costs have also risen more quickly. The urban CPI was up 1.0 percent on the year while the rural CPI was up 0.6 percent.
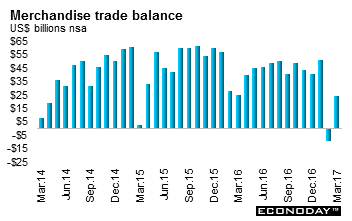 March merchandise trade surplus was $23.93 billion after recording a deficit of $9.15 billion in February. Exports were up 16.4 percent on the year after dropping 1.3 percent in February. Imports were up 20.3 percent on the year, down from a 38.1 percent increase the month before. In seasonally adjusted terms, Chinese exports rose 29.4 percent on the month after dropping by 28.1 percent in February. Seasonally adjusted imports were up 1.2 percent on the month, after a slipping 0.3 percent in February. For the three months to March 2017 China recorded a trade surplus of $65.6 billion, down almost 50 percent from the balance of $125.7 billion recorded in the equivalent period in 2016. Exports were about $19 billion higher year-to-date than they were in 2016, but imports were around $79 billion higher, largely reflecting the impact of higher global oil prices. In local currency terms, China's trade balance swung from a deficit of Y60.4 billion in February to a surplus of Y164.3 billion in March. Exports rose 22.3 percent on the year, while imports rose 26.3 percent on the year. March merchandise trade surplus was $23.93 billion after recording a deficit of $9.15 billion in February. Exports were up 16.4 percent on the year after dropping 1.3 percent in February. Imports were up 20.3 percent on the year, down from a 38.1 percent increase the month before. In seasonally adjusted terms, Chinese exports rose 29.4 percent on the month after dropping by 28.1 percent in February. Seasonally adjusted imports were up 1.2 percent on the month, after a slipping 0.3 percent in February. For the three months to March 2017 China recorded a trade surplus of $65.6 billion, down almost 50 percent from the balance of $125.7 billion recorded in the equivalent period in 2016. Exports were about $19 billion higher year-to-date than they were in 2016, but imports were around $79 billion higher, largely reflecting the impact of higher global oil prices. In local currency terms, China's trade balance swung from a deficit of Y60.4 billion in February to a surplus of Y164.3 billion in March. Exports rose 22.3 percent on the year, while imports rose 26.3 percent on the year.
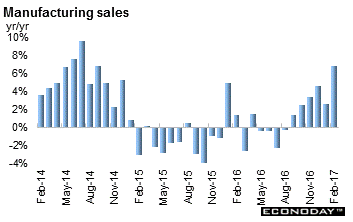 February manufacturing sales edged down 0.2 percent following three consecutive monthly increases. On the year, however, sales were up 6.8 percent. The largest monthly declines were in the motor vehicle assembly (down 5.3 percent) and petroleum & coal product (down 5.0 percent) manufacturing industries. However, these decreases were largely offset by gains in the aerospace products & parts (up 27.0 percent), primary metal and machinery industries (up 3.1 percent). Sales were down in 10 of the 21 industries, representing 37 percent of the Canadian manufacturing sector. Once the effects of price changes are taken into consideration, manufacturing sales in volumes edged up 0.1 percent in February. Inventory levels rose 1.6 percent for a third consecutive monthly gain. Inventories were up in 13 of 21 industries. Unfilled orders rose 0.7 percent for a second straight monthly gain. New orders were up for a third consecutive month, rising 0.8 percent. February manufacturing sales edged down 0.2 percent following three consecutive monthly increases. On the year, however, sales were up 6.8 percent. The largest monthly declines were in the motor vehicle assembly (down 5.3 percent) and petroleum & coal product (down 5.0 percent) manufacturing industries. However, these decreases were largely offset by gains in the aerospace products & parts (up 27.0 percent), primary metal and machinery industries (up 3.1 percent). Sales were down in 10 of the 21 industries, representing 37 percent of the Canadian manufacturing sector. Once the effects of price changes are taken into consideration, manufacturing sales in volumes edged up 0.1 percent in February. Inventory levels rose 1.6 percent for a third consecutive monthly gain. Inventories were up in 13 of 21 industries. Unfilled orders rose 0.7 percent for a second straight monthly gain. New orders were up for a third consecutive month, rising 0.8 percent.
Equities retreated in the shortened trading week thanks to heightened geopolitical pressures on the Korean peninsula and in the Middle East. Also contributing to the declines was the upcoming French election on April 23. If the first round fails to deliver an outright winner, a second round run-off between the two most successful candidates will occur on May 8. Earnings season began in the U.S. on Thursday, just prior to the long weekend. The pace will pick up in the coming week.
While many markets will remain closed for Easter Monday, the pace of new economic data releases will pick up especially in the U.S. China will complete its monthly avalanche of new data as well. The flash PMIs for April will be released at week's end. And it will be wait and see for the outcome of the French election that follows on Sunday.
| Central Bank activities |
|
| April 19 |
United States |
Federal Reserve Beige Book Published |
| |
|
|
| The following indicators will be released this week... |
| Europe |
|
|
| April 19 |
Eurozone |
Merchandise Trade (February) |
|
|
Harmonized Index of Consumer Prices (March final) |
| April 20 |
Eurozone |
EC Consumer Confidence (April flash) |
| April 21 |
Eurozone |
Composite, Manufacturing & Services PMI (April flash) |
|
Germany |
Composite, Manufacturing & Services PMI (April flash) |
|
France |
Composite, Manufacturing & Services PMI (April flash) |
|
UK |
Retail Sales (March) |
| |
|
|
| Asia Pacific |
|
|
| April 17 |
China |
Gross Domestic Product (Q1.2017) |
|
|
Industrial Production (March) |
|
|
Retail Sales (March) |
| April 20 |
Japan |
Merchandise Trade Balance (March) |
| April 21 |
|
Manufacturing PMI (April flash) |
| |
|
|
| Americas |
|
|
| April 21 |
Canada |
Consumer Price Index (March) |
Anne D Picker is the author of International Economic Indicators and Central Banks.
|
