|
Consumers may be saying they're confident, in fact very confident, but they're not spending like they're confident. Retail sales were only the first of the week's one-two punch with the finisher coming from consumer prices which are going into reverse. Lack of consumer spending and lack of inflation will not be building up expectations for Federal Reserve rate hikes.
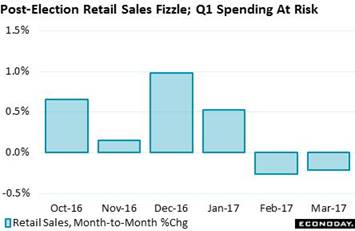 To put if flatly, consumer spending is in doubt. Retail sales fell 0.2 percent with another unwanted surprise coming from a sharp downward revision to February, now at minus 0.3 percent. Weakness in March was wide from autos to restaurants to building materials to furniture and even sporting goods. There are plenty of bad luck wildcards to explain things away: Easter shift, late tax returns, bad weather. But explaining away the even weaker February isn't as easy. To put if flatly, consumer spending is in doubt. Retail sales fell 0.2 percent with another unwanted surprise coming from a sharp downward revision to February, now at minus 0.3 percent. Weakness in March was wide from autos to restaurants to building materials to furniture and even sporting goods. There are plenty of bad luck wildcards to explain things away: Easter shift, late tax returns, bad weather. But explaining away the even weaker February isn't as easy.
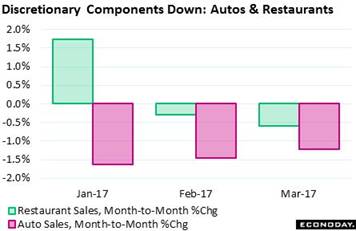 Two discretionary components -- autos and restaurants -- are showing particular weakness. Auto sales closed out the first quarter with a 3rd straight monthly decline, at minus 1.2 percent after dips of 1.5 and 1.6 percent. And restaurant sales aren't much better, down 0.6 and 0.3 percent the last 2 months with the yearly rate at 2.8 percent and a 3-year low. Despite their sky high confidence, consumers aren't celebrating much. Two discretionary components -- autos and restaurants -- are showing particular weakness. Auto sales closed out the first quarter with a 3rd straight monthly decline, at minus 1.2 percent after dips of 1.5 and 1.6 percent. And restaurant sales aren't much better, down 0.6 and 0.3 percent the last 2 months with the yearly rate at 2.8 percent and a 3-year low. Despite their sky high confidence, consumers aren't celebrating much.
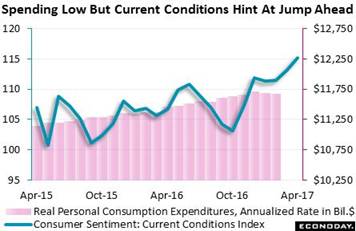 Bulging confidence has been the salient feature of post-election data. April's current conditions in the consumer sentiment report are up 2 points to 115.2 and a 17-year high. Though actual spending has yet to live up to confidence, this is still a strongly positive signal for April spending. But after a weak February and January, the pivotal month right now is March and whether service spending improved. March spending will be bundled in GDP at month-end. Bulging confidence has been the salient feature of post-election data. April's current conditions in the consumer sentiment report are up 2 points to 115.2 and a 17-year high. Though actual spending has yet to live up to confidence, this is still a strongly positive signal for April spending. But after a weak February and January, the pivotal month right now is March and whether service spending improved. March spending will be bundled in GDP at month-end.
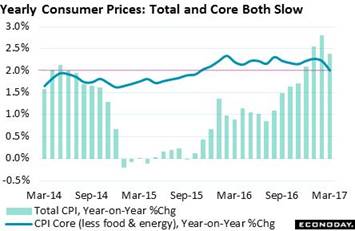 Further news of softness comes from consumer prices where March contraction led to sizable slowing in year-on-year rates. The total rate is 2.4 percent, down 3 tenths from February and sliding back to the Fed's 2 percent target. The core rate, which excludes food & energy, is down 2 tenths and is right at the target line. Energy comparisons are very easy right now given low prices this time last year. This makes the decline in the core a special concern. Further news of softness comes from consumer prices where March contraction led to sizable slowing in year-on-year rates. The total rate is 2.4 percent, down 3 tenths from February and sliding back to the Fed's 2 percent target. The core rate, which excludes food & energy, is down 2 tenths and is right at the target line. Energy comparisons are very easy right now given low prices this time last year. This makes the decline in the core a special concern.
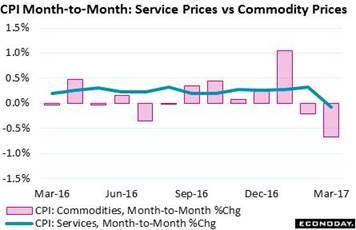 The core decline reflects wide slowing. Service prices fluctuate much less than commodity prices which are routinely hit by swings in oil or import prices. Services posted a rare 0.1 percent decline, a result first telegraphed by producer prices where services also fell in March. But the downswing may prove short lived as changes in cell phone plans are to blame, subtracting 1 tenth from both the total CPI and core. Still, lack of service pressure points to a general lack of price traction consistent with sluggish demand. The core decline reflects wide slowing. Service prices fluctuate much less than commodity prices which are routinely hit by swings in oil or import prices. Services posted a rare 0.1 percent decline, a result first telegraphed by producer prices where services also fell in March. But the downswing may prove short lived as changes in cell phone plans are to blame, subtracting 1 tenth from both the total CPI and core. Still, lack of service pressure points to a general lack of price traction consistent with sluggish demand.
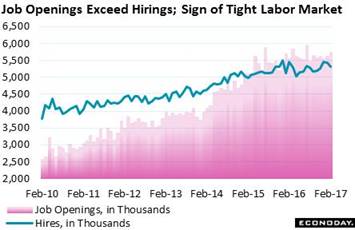 Even the week's good news has a not-so-bright side. Jobs have been the economy's strength but openings are going unfilled. Openings jumped 2.1 percent in February to 5.743 million for the highest level since July last year. In contrast, hires fell 2.0 percent to 5.314 million to once again widen the openings-to-hire gap. This gap suggests that employers, despite 7.2 million Americans looking for work, are having a hard time finding the right people with the right skills. Even the week's good news has a not-so-bright side. Jobs have been the economy's strength but openings are going unfilled. Openings jumped 2.1 percent in February to 5.743 million for the highest level since July last year. In contrast, hires fell 2.0 percent to 5.314 million to once again widen the openings-to-hire gap. This gap suggests that employers, despite 7.2 million Americans looking for work, are having a hard time finding the right people with the right skills.
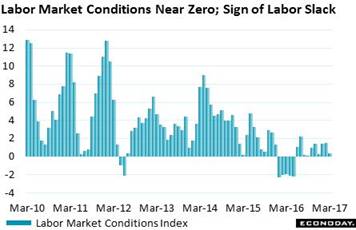 One employment indicator in the bad news column is the Fed's labor market conditions index which is holding barely above zero, at only 0.4 percent in March. This index is a composite of 19 separate components which dilute the effects of healthy payroll gains and a low unemployment rate. Wages are part of this mix as is labor force participation, both of which have been weak. Judging by this index, the Fed has room to maneuver, that is limit future rate hikes. One employment indicator in the bad news column is the Fed's labor market conditions index which is holding barely above zero, at only 0.4 percent in March. This index is a composite of 19 separate components which dilute the effects of healthy payroll gains and a low unemployment rate. Wages are part of this mix as is labor force participation, both of which have been weak. Judging by this index, the Fed has room to maneuver, that is limit future rate hikes.
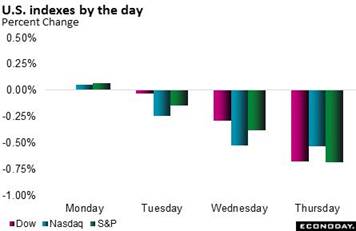 One unavoidable takeaway from the week (especially if you're an FOMC member) is that the president doesn't really want to see rates rise that fast. Donald Trump said on Wednesday that he likes low rates and thinks the dollar is getting too strong. The dollar sold off on the comments but then steadied to end the week down only 0.3 percent. What really moved was the 10-year Treasury yield which fell 16 basis points to 2.23 percent for, by far, the steepest weekly decline this year. And this move, which is a further reversal of the Trump trade that saw the yield peak at 2.60 percent in mid-December, doesn't yet include the likely rally from Friday's retail sales and consumer price data (markets were closed for Good Friday). How much further this bond surge can extend is a key question for all the financial markets. Stocks had a down week with the Dow losing 1.0 percent to 20,453. And perhaps not helping stocks was Trump's decision to have another try at repealing Obamacare before moving to tax cuts. One unavoidable takeaway from the week (especially if you're an FOMC member) is that the president doesn't really want to see rates rise that fast. Donald Trump said on Wednesday that he likes low rates and thinks the dollar is getting too strong. The dollar sold off on the comments but then steadied to end the week down only 0.3 percent. What really moved was the 10-year Treasury yield which fell 16 basis points to 2.23 percent for, by far, the steepest weekly decline this year. And this move, which is a further reversal of the Trump trade that saw the yield peak at 2.60 percent in mid-December, doesn't yet include the likely rally from Friday's retail sales and consumer price data (markets were closed for Good Friday). How much further this bond surge can extend is a key question for all the financial markets. Stocks had a down week with the Dow losing 1.0 percent to 20,453. And perhaps not helping stocks was Trump's decision to have another try at repealing Obamacare before moving to tax cuts.
| Markets at a Glance |
Year-End |
Week Ended |
Week Ended |
Year-To-Date |
Weekly |
|
2016 |
7-Apr-17 |
14-Apr-17 |
Change |
Change |
| DJIA |
19,762.60 |
20,656.10 |
20,453.25 |
3.5% |
-1.0% |
| S&P 500 |
2,238.83 |
2,355.54 |
2,328.95 |
4.0% |
-1.1% |
| Nasdaq Composite |
5,383.12 |
5,877.81 |
5,805.15 |
7.8% |
-1.2% |
|
|
|
|
|
|
| Crude Oil, WTI ($/barrel) |
$53.71 |
$52.24 |
$52.91 |
-1.5% |
1.3% |
| Gold (COMEX) ($/ounce) |
$1,152.50 |
$1,256.50 |
$1,290.10 |
11.9% |
2.7% |
|
|
|
|
|
|
| Fed Funds Target |
0.50 to 0.75% |
0.75 to 1.00% |
0.75 to 1.00% |
25 bp |
0 bp |
| 2-Year Treasury Yield |
1.21% |
1.28% |
1.21% |
0 bp |
–7 bp |
| 10-Year Treasury Yield |
2.45% |
2.39% |
2.23% |
–22 bp |
–16 bp |
| Dollar Index |
102.26 |
100.9 |
100.58 |
-1.6% |
-0.3% |
The decline in rates is a signal from investors that the outlook for economic growth is slowing and that inflation won't be heating up that much at all. Though a flat first quarter can always be explained away by seasonal adjustments whose effects are especially heavy in the winter months, this first quarter is looking to prove unusually weak compared to other first quarters. A second-quarter snapback is undoubtedly the expectation but there are no guarantees, especially with emerging delays in the new administration's stimulus efforts.
Housing looks like the strength of what may be a mixed week for economic news. Gains are expected for Tuesday's industrial production report despite March's heavy weather having pulled down factory hours. Housing starts and permits have been showing life but the March outlook is mixed with a dip expected for starts but continued strength for permits. Friday's highlight will be existing home sales where a big jump is expected. Wednesday's focus will be the Beige Book with updates on the labor market and consumer spending to be closely watched. The week will also include April updates from two regional reports that have been signaling exceptional strength for the factory sector: Empire State on Monday and the Philly Fed on Tuesday.
Empire State Index for April
Consensus Forecast: 15.0
Consensus Range: 13.0 to 17.2
Empire State has been signaling exceptionally strong acceleration in the manufacturing sector and has beaten Econoday's consensus in 4 of the last 5 five reports. New orders are at an 8-year high and unfilled orders are at an 11-year high. Empire State's headline index is tracking at a 3-year high, beating expectations by 1 point in March at 16.4. For April, forecasters see the index tracking only slightly back to 15.0. This report will offer the first advance look at this month's factory conditions.
Housing Market Index for April
Consensus Forecast: 70
Consensus Range: 69 to 71
Confidence among home builders surged in March as the housing market index jumped 5 points to 71, far over breakeven 50 and the best reading of the expansion. Components for both present and future sales jumped to very strong readings of 78, yet it was the traffic component that perhaps showed the most striking strength, up 8 points to 54 for the 3rd plus-50 score in 4 months. Strength in traffic is a hint that first-time buyers, subdued during the whole expansion, are finally looking to buy a new home. Forecasters see the April index edging back only 1 point to 70.
Housing Starts for March
Consensus Forecast, Adjusted Annualized Rate: 1.262 million
Consensus Range: 1.185 to 1.285 million
Building Permits
Consensus Forecast: 1.250 million
Consensus Range: 1.230 to 1.260 million
Optimism among home builders has been very strong and acceleration is beginning to appear in actual residential construction. Growth in single-family starts is rising at a mid-single digit pace with permits, in a strong positive for the new home market, moving at a double-digit pace. For multi-family units, starts are rising in the double digits though permits, after 5 years of steady and strong building, have begun to slow. Forecasters see housing starts in March falling back to a 1.262 million annualized pace but with building permits continuing to strengthen to a 1.250 million rate.
Industrial Production for March
Consensus Forecast, Month-to-Month Change: 0.4%
Consensus Range: -0.1% to 1.1%
Manufacturing Production
Consensus Forecast, Month-to-Month Change: 0.3%
Consensus Range: -0.7% to 0.4%
Capacity Utilization Rate
Consensus Forecast: 76.0%
Consensus Range: 75.5% to 76.6%
Hours worked in the factory sector fell sharply in March likely tied to the Category 3 storm Stella that swept the Northeast at mid-month. Though fewer hours point to reduced volumes, forecasters are calling for a 0.3 percent rise in manufacturing production. Yet the consensus range is wide with the low estimate at minus 0.7 percent. The headline for industrial production is expected to rise 0.4 percent boosted by a bounce back for utility production which fell very sharply during February's warmth. Capacity utilization is seen rising 76.0 percent from 75.4 percent.
Beige Book
Prepared for the May 2 & 3 FOMC Meeting
Modest to moderate, whether for consumer spending or business investment or inflation, is the long-standing general assessment of the Beige Book. Yet the prior edition in March, in an unusual highlight, did warn of widening labor shortages. If further labor tightening is cited and if the assessment of consumer spending holds up, expectations could get a boost for a rate hike, if not at the coming FOMC in May, than the following meeting in June.
Initial Jobless Claims for April 15 week
Consensus Forecast: 244,000
Consensus Range: 236,000 to 250,000
Initial jobless claims have beaten Econoday expectations very sharply in the 2 prior weeks. At 234,000 in the April 8 week, claims were expected to have returned to March's 245,000 trend. And forecasters once again see claims moving higher, to a consensus 244,000 in the April 15 week. Unemployment claims have been very low and favorable consistent with strong demand for labor.
Philadelphia Fed Manufacturing Index for April
Consensus Forecast: 26.0
Consensus Range: 20.0 to 35.4
The Philadelphia Fed index has beaten Econoday's consensus in 6 of the last 7 reports, evidence of how unusually strong acceleration in this report has been. The April consensus is 26.0 which would follow March's 32.8 and February's 44-year high of 43.3. March had its own 44-year high and that was for new orders which at 38.6 point to wide strength for this month's activity including shipments and employment. This closely watched advance indicator has been pointing to strong acceleration for the nation's factory sector.
Index of Leading Economic Indicators for March
Consensus Forecast, Month-to-Month Change: 0.2%
Consensus Range: 0.2% to 0.3%
The index of leading economic indicators has been signaling a shift higher for the economy, rising a very strong 0.6 percent in each of the last 3 reports. Confidence readings from both the consumer and factory sectors have been contributing to the strength but one very strong positive, low levels of jobless claims, reversed in March and is likely to hold the LEI back. Forecasters see the March LEI rising 0.2 percent.
PMI Manufacturing for April, Flash
Consensus Forecast: 53.6
Consensus Range: 53.0 to 54.0
PMI Services for April, Flash
Consensus Forecast: 53.1
Consensus Range: 52.7 to 53.6
Unlike many other anecdotal reports, both the services and manufacturing PMIs slowed in March. For April, forecasters see the services flash, despite weak orders in March, edging 3 tenths higher to a consensus 53.1. The consensus for the manufacturing flash is 53.6 vs 53.3 in March which was held down by slowing orders and also cutbacks in inventories.
Existing Home Sales for March
Consensus Forecast, Annualized Rate: 5.605 million
Consensus Range: 5.485 to 5.800 million
Existing home sales have been trending steadily near the 5.550 million annualized rate for the last 4 reports, not showing much momentum but still holding at expansion highs. The breakdown shows single-family homes steady near 4.950 million and multi-family homes struggling to hold momentum near the low 600,000 rate. But a breakout may be in store based on the pending home sales index which surged to signal strength in final resales during the March and April period. Forecasters are calling for a significant gain to a consensus 5.605 million in April.
|
