|
Early data from the second quarter are underscoring, not upending, the message from the first quarter: consumer demand is soft. Retail sales in April, despite an easy comparison with March, came in no better than moderate in tepid news made more tepid by unexpected softness in the consumer price report. What many bulls thought would prove an explosive year for the economy may be falling further and further behind.
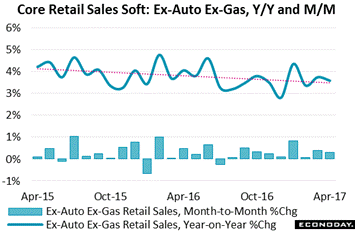 Core retail sales (ex-autos ex-gas) are tracking at a gradually diminishing rate of annual growth, at 3.7 percent in April vs just over 4.0 percent this time last year. The monthly gain for the core, instead of accelerating in April as was expected, slowed 1 tenth to a not-so-hot 0.3 percent. This is not a report being skewed by a bunch of one-time flukes. General merchandise has fallen for 3 months straight with department stores only barely positive. Health & personal care, clothes and furniture have all been soft. Core retail sales (ex-autos ex-gas) are tracking at a gradually diminishing rate of annual growth, at 3.7 percent in April vs just over 4.0 percent this time last year. The monthly gain for the core, instead of accelerating in April as was expected, slowed 1 tenth to a not-so-hot 0.3 percent. This is not a report being skewed by a bunch of one-time flukes. General merchandise has fallen for 3 months straight with department stores only barely positive. Health & personal care, clothes and furniture have all been soft.
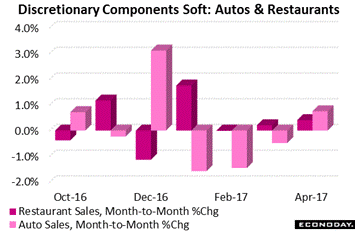 The retail report's lack of punch includes two key discretionary categories as well. Auto sales did recover in April with a 0.7 percent gain which however does not make up for 3 prior declines. Restaurant sales were also in the plus column in April but the trend here is slowing as well. Year-on-year rates for both vehicles and restuarants have been moving from the 5 to 6 percent range to no better than 4 percent which puts them back in the middle of the pack. The retail report's lack of punch includes two key discretionary categories as well. Auto sales did recover in April with a 0.7 percent gain which however does not make up for 3 prior declines. Restaurant sales were also in the plus column in April but the trend here is slowing as well. Year-on-year rates for both vehicles and restuarants have been moving from the 5 to 6 percent range to no better than 4 percent which puts them back in the middle of the pack.
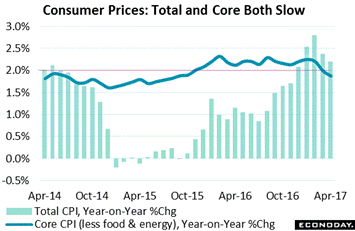 Part of the weakness in retail sales can be explained by retail prices which, judging by the consumer price report, are frustratingly flat. The CPI slowed in April to a year-on-year 2.2 percent which missed Econoday expectations by 1 tenth and the prior month by 2 tenths. Core CPI (less food & energy) is also slowing, down 1 tenth and back under the Federal Reserve's 2 percent target for the first time since October 2015. These results are certain to pull down the Fed's own PCE price gauges. Part of the weakness in retail sales can be explained by retail prices which, judging by the consumer price report, are frustratingly flat. The CPI slowed in April to a year-on-year 2.2 percent which missed Econoday expectations by 1 tenth and the prior month by 2 tenths. Core CPI (less food & energy) is also slowing, down 1 tenth and back under the Federal Reserve's 2 percent target for the first time since October 2015. These results are certain to pull down the Fed's own PCE price gauges.
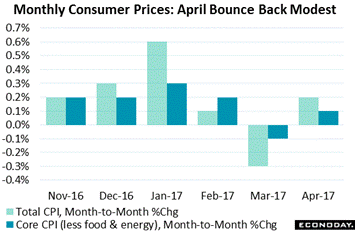 Looking at the results on a month-to-month basis, however, does show progress but not that much. The CPI rose 0.2 percent in April to only partially offset March's 0.3 percent decline. But it's the core that the Fed watches with special care and here the story is little better, up only 0.1 percent in April following March's unusual 0.1 percent decline. Communication costs are down as providers fight out a price war and medical costs have been slowing. Apparel is also falling. Looking at the results on a month-to-month basis, however, does show progress but not that much. The CPI rose 0.2 percent in April to only partially offset March's 0.3 percent decline. But it's the core that the Fed watches with special care and here the story is little better, up only 0.1 percent in April following March's unusual 0.1 percent decline. Communication costs are down as providers fight out a price war and medical costs have been slowing. Apparel is also falling.
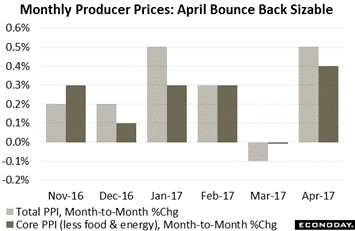 Softness in the CPI is made more surprising by clear indications of price pressures down the pipeline, tangible pressures that apparently aren't being passed through to the consumer and must therefore be squeezing profits. Producer prices beat estimates in April, up a sizable 0.5 percent with the core rate up a nearly as strong 0.4 percent. Cigarette costs were up in April as were the costs of computers and cars. These results confirm similar indications in the regional factory surveys. Softness in the CPI is made more surprising by clear indications of price pressures down the pipeline, tangible pressures that apparently aren't being passed through to the consumer and must therefore be squeezing profits. Producer prices beat estimates in April, up a sizable 0.5 percent with the core rate up a nearly as strong 0.4 percent. Cigarette costs were up in April as were the costs of computers and cars. These results confirm similar indications in the regional factory surveys.
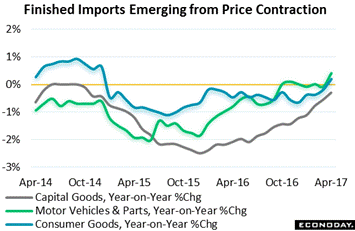 Another set of data down the price chain are import & export prices which here too are pointing to a business squeeze. Each month the U.S. imports about $50 billion of consumer goods where prices are finally emerging from long contraction. Import prices will show their effect by either raising consumer prices or lowering margins or some mix in between. Prices of imported vehicles and capital goods are on the same path higher, the latter pointing to a further squeeze for businesses. Another set of data down the price chain are import & export prices which here too are pointing to a business squeeze. Each month the U.S. imports about $50 billion of consumer goods where prices are finally emerging from long contraction. Import prices will show their effect by either raising consumer prices or lowering margins or some mix in between. Prices of imported vehicles and capital goods are on the same path higher, the latter pointing to a further squeeze for businesses.
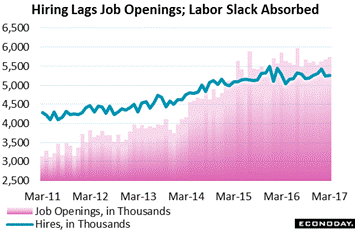 There's also another squeeze going on and that's in the sensitive territory of the labor market. At 5.743 million, job openings are very plentiful, in fact more plentiful than hirings which are way back at 5.260 million. The inability to fill openings points to a lack of qualified candidates and gets to the heart of the low productivity expansion. This mismatch also hints at something that has yet to really appear, that is wage inflation as employers up their offers to pull workers from their rivals. There's also another squeeze going on and that's in the sensitive territory of the labor market. At 5.743 million, job openings are very plentiful, in fact more plentiful than hirings which are way back at 5.260 million. The inability to fill openings points to a lack of qualified candidates and gets to the heart of the low productivity expansion. This mismatch also hints at something that has yet to really appear, that is wage inflation as employers up their offers to pull workers from their rivals.
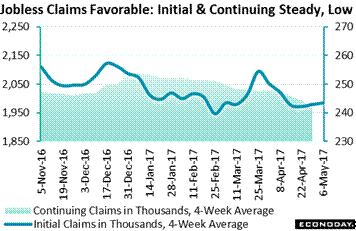 But employers, at least for now, are not letting their people go. Unemployment claims have been at rock bottom and continue to edge lower. Initial claims are tracking at just over 240,000 per week which is sizably below levels in early April and late March and are offering the first hints of a strong employment report for May. Continuing claims, tracking at just under 2.0 million in total, are also moving lower. Both of these claims readings are at generational lows. But employers, at least for now, are not letting their people go. Unemployment claims have been at rock bottom and continue to edge lower. Initial claims are tracking at just over 240,000 per week which is sizably below levels in early April and late March and are offering the first hints of a strong employment report for May. Continuing claims, tracking at just under 2.0 million in total, are also moving lower. Both of these claims readings are at generational lows.
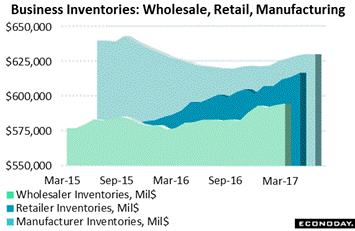 The retail sales report offers some of the early inputs for second-quarter GDP. Ending the first quarter in a neutral stance relative to GDP were business inventories which edged higher in line with only modest gains for underlying sales. Wholesalers have been adding to their inventories more aggressively than retailers and much more so than manufacturers who, after fighting off overhang following the 2014 oil collapse and related business downturn, are now building inventories cautiously. The retail sales report offers some of the early inputs for second-quarter GDP. Ending the first quarter in a neutral stance relative to GDP were business inventories which edged higher in line with only modest gains for underlying sales. Wholesalers have been adding to their inventories more aggressively than retailers and much more so than manufacturers who, after fighting off overhang following the 2014 oil collapse and related business downturn, are now building inventories cautiously.
 Health care re-reform has moved out of the House but passage in the Senate is not on the fast track. Deregulation is getting underway but movement on tax reform, though beginning, hasn't been that fast either. This isn't great news for optimists who were hoping to see something close to 3 percent GDP this year. And the sacking of Comey at the FBI isn't focusing extra attention on the economy. Stocks were flat with the Dow, at 20,896, down 0.5 percent on the week. Health care re-reform has moved out of the House but passage in the Senate is not on the fast track. Deregulation is getting underway but movement on tax reform, though beginning, hasn't been that fast either. This isn't great news for optimists who were hoping to see something close to 3 percent GDP this year. And the sacking of Comey at the FBI isn't focusing extra attention on the economy. Stocks were flat with the Dow, at 20,896, down 0.5 percent on the week.
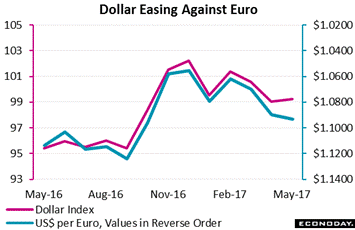 The dollar firmed in the week but is still down on the year, 3.0 percent lower on the dollar index at just over the 99 level. The currency showing 2017 strength is the euro which, after sliding through the second-half of 2016 on the Brexit breakup, could conceivably get a boost from new cohesion in Europe. Populist failures in the Netherlands and now France point perhaps to a continental Europe more certain than before in its unity. The dollar firmed in the week but is still down on the year, 3.0 percent lower on the dollar index at just over the 99 level. The currency showing 2017 strength is the euro which, after sliding through the second-half of 2016 on the Brexit breakup, could conceivably get a boost from new cohesion in Europe. Populist failures in the Netherlands and now France point perhaps to a continental Europe more certain than before in its unity.
| Markets at a Glance |
Year-End |
Week Ended |
Week Ended |
Year-To-Date |
Weekly |
|
2016 |
5-May-17 |
12-May-17 |
Change |
Change |
| DJIA |
19,762.60 |
21,006.94 |
20,896.61 |
5.7% |
-0.5% |
| S&P 500 |
2,238.83 |
2,399.29 |
2,390.90 |
6.8% |
-0.3% |
| Nasdaq Composite |
5,383.12 |
6,100.76 |
6,121.23 |
13.7% |
0.3% |
|
|
|
|
|
|
| Crude Oil, WTI ($/barrel) |
$53.71 |
$46.30 |
$47.67 |
-11.2% |
3.0% |
| Gold (COMEX) ($/ounce) |
$1,152.50 |
$1,228.20 |
$1,229.10 |
6.6% |
0.1% |
|
|
|
|
|
|
| Fed Funds Target |
0.50 to 0.75% |
0.75 to 1.00% |
0.75 to 1.00% |
25 bp |
0 bp |
| 2-Year Treasury Yield |
1.21% |
1.31% |
1.29% |
8 bp |
–2 bp |
| 10-Year Treasury Yield |
2.45% |
2.35% |
2.33% |
–12 bp |
–2 bp |
| Dollar Index |
102.26 |
98.56 |
99.23 |
-3.0% |
0.7% |
Seasonal adjustments really weren't the reason that March was so weak as April, both for retail sales and also consumer prices, failed to show a dramatic snapback. Lack of consumer spending, despite a strong jobs market and sky high confidence, is still an unresolved negative for the economic outlook. And lack of price traction is also a mystery and one that could be resolved by long awaited strength for wages.
Manufacturing and housing are the week's highlights, the former having promised strength and the latter having mostly delivered strength. Empire State on Monday and the Philly Fed on Thursday have both been signaling unusual acceleration for the factory sector and will offer their updates for May. Definitive data on the factory sector, however, have yet to bolt higher though respectable strength is the call for April manufacturing in Tuesday's industrial production report. Strength in housing has been one of the pluses of the nation's economic data. The latest comes on Monday with what has been a very strong housing market index that has been reflecting unusual optimism among the nation's home builders. Actual data on housing starts and permits have been up-and-down but year-on-year growth in permits, led by multi-family units, is tracking at a 20 percent growth rate.
Empire State Index for May
Consensus Forecast: 7.0
Consensus Range: 5.0 to 9.2
Strength in the Empire State report has been so acute that cooling in April was a welcome outcome. Delivery times have been tracking at record highs to indicate tight congestion in the New York economy's supply chain. New orders continued to rise in April, though at a slower rate, and backlogs continued to rise, holding near record rates of growth. After a 5.2 headline for April that followed 16.4 and 18.7 in the two prior months, forecasters are calling for 7.0 in May.
Housing Market Index for May
Consensus Forecast: 68
Consensus Range: 65 to 69
Improvement in traffic has been the key to the housing market index which has been tracking at unusual levels of strength. Traffic had been in extended contraction for most of the expansion until moving over the breakeven 50 level back in December and holding there in 4 of the last 5 months. Sales readings, well into the 70s, have been very strong and are expected to underpin May's consensus headline at 68, unchanged from April.
Housing Starts for April
Consensus Forecast, Adjusted Annualized Rate: 1.256 million
Consensus Range: 1.215 to 1.290 million
Building Permits
Consensus Forecast: 1.271 million
Consensus Range: 1.255 to 1.290 million
Permit strength for multi-family starts saved what was otherwise a weak housing starts report for March. Rebounds are expected for April with the starts consensus at an annualized rate of 1.256 million vs March's 1.215 million. Permits are seen rising to a 1.271 million rate vs 1.260 million. One positive back in March was a big gain in single-family completions which will help boost what is a low supply of new homes on the market.
Industrial Production for April
Consensus Forecast, Month-to-Month Change: 0.4%
Consensus Range: 0.2% to 1.1%
Manufacturing Production
Consensus Forecast, Month-to-Month Change: 0.3%
Consensus Range: 0.2% to 0.6%
Capacity Utilization Rate
Consensus Forecast: 76.3%
Consensus Range: 75.9% to 76.4%
Manufacturing production is expected to bounce back from March's 0.4 percent decline with a consensus gain of 0.3 percent. Heavy weather was behind March's manufacturing drop and also March's record 8.6 percent monthly surge in utility output which lifted overall industrial production to a 0.5 percent gain. The consensus for the overall rate in April is 0.4 percent with the capacity utilization consensus at 76.3 percent vs March's 76.1 percent.
Initial Jobless Claims for May 13 week
Consensus Forecast: 240,000
Consensus Range: 239,000 to 245,000
Jobless claims have been very low and pointing to unusually strong demand for labor. Forecasters sees initial claims coming in at 240,000 in the May 13 week vs 236,000 in the prior week.
Philadelphia Fed Manufacturing Index for May
Consensus Forecast: 19.6
Consensus Range: 16.0 to 25.0
The Philadelphia Fed index was the first advance report to signal what has been, however, mostly phantom acceleration in the factory sector. Of special note, like it is in the Empire State report, is unusual lengthening in delivery times, delays consistent with demand-related congestion in the supply. New orders have been showing great strength in this report with backlog orders up in each of the prior 6 reports. Forecasters are calling for sustained strength, at a consensus 19.6 vs April's 22.0.
Index of Leading Economic Indicators for April
Consensus Forecast, Month-to-Month Change: 0.3%
Consensus Range: 0.3% to 0.4%
The index of leading economic indicators has been signaling a shift higher for the economy, rising a very solid 0.4 percent in April vs gains of 0.5 in March and 0.6 percent in both February and January. These readings point to strong second-half acceleration for the economy. Gains have been broad-based and in April included strength for consumer expectations and building permits. The consensus for May is another gain, of 0.3 percent.
|
