|
Although investors traded with some trepidation, most indexes advanced during the week — and most advanced in May as well. Investors evaluated a slew of economic data including May manufacturing purchasing managers' surveys amongst other key data. The week's climax was the U.S. employment report. It disappointed. On the week, gains ranged from 2.7 percent (Topix) down to 0.1 percent (CAC). The Shanghai Composite and SET were 0.1 percent lower while the MIB lost 1.3 percent.
In May, most indexes advanced. The FTSE gained 4.4 percent while the CAC and Dow added only 0.3 percent. The All Ordinaries retreated 3.1 percent with the KLCI edging down 0.1 percent.
| |
|
2016 |
2017 |
% Change |
|
Index |
Dec 31 |
May 26 |
June 2 |
Week |
May |
2017 |
| Asia/Pacific |
|
|
|
|
|
|
|
| Australia |
All Ordinaries |
5719.1 |
5792.1 |
5821.1 |
0.5% |
-3.1% |
1.8% |
| Japan |
Nikkei 225 |
19114.4 |
19686.8 |
20177.3 |
2.5% |
2.4% |
5.6% |
|
Topix |
1518.61 |
1569.42 |
1612.2 |
2.7% |
2.4% |
6.2% |
| Hong Kong |
Hang Seng |
22000.6 |
25639.3 |
25924.1 |
1.1% |
4.2% |
17.8% |
| S. Korea |
Kospi |
2026.5 |
2355.3 |
2371.7 |
0.7% |
6.4% |
17.0% |
| Singapore |
STI |
2880.8 |
3219.4 |
3240.0 |
0.6% |
1.1% |
12.5% |
| China |
Shanghai Composite |
3103.6 |
3110.1 |
3105.5 |
-0.1% |
-1.2% |
0.1% |
|
|
|
|
|
|
|
|
| India |
Sensex 30 |
26626.5 |
31028.21 |
31273.3 |
0.8% |
4.1% |
17.5% |
| Indonesia |
Jakarta Composite |
5296.7 |
5716.8 |
5742.5 |
0.4% |
0.9% |
8.4% |
| Malaysia |
KLCI |
1641.7 |
1772.3 |
1777.0 |
0.3% |
-0.1% |
8.2% |
| Philippines |
PSEi |
6840.6 |
7867.5 |
7907.7 |
0.5% |
2.3% |
15.6% |
| Taiwan |
Taiex |
9253.5 |
10102.0 |
10152.5 |
0.5% |
1.7% |
9.7% |
| Thailand |
SET |
1542.9 |
1569.3 |
1567.6 |
-0.1% |
-0.3% |
1.6% |
|
|
|
|
|
|
|
|
| Europe |
|
|
|
|
|
|
|
| UK |
FTSE 100 |
7142.8 |
7547.6 |
7547.6 |
0.0% |
4.4% |
5.7% |
| France |
CAC |
4862.3 |
5336.6 |
5343.4 |
0.1% |
0.3% |
9.9% |
| Germany |
XETRA DAX |
11481.1 |
12602.2 |
12822.9 |
1.8% |
1.4% |
11.7% |
| Italy |
FTSE MIB |
19234.6 |
21210.6 |
20928.2 |
-1.3% |
0.6% |
8.8% |
| Spain |
IBEX 35 |
9352.1 |
10904.2 |
10905.9 |
0.0% |
1.5% |
16.6% |
| Sweden |
OMX Stockholm 30 |
1517.2 |
1635.8 |
1646.7 |
0.7% |
0.7% |
8.5% |
| Switzerland |
SMI |
8219.9 |
9042.0 |
9044.0 |
0.0% |
2.3% |
10.0% |
|
|
|
|
|
|
|
|
| North America |
|
|
|
|
|
|
|
| United States |
Dow |
19762.6 |
21080.28 |
21206.3 |
0.6% |
0.3% |
7.3% |
|
NASDAQ |
5383.1 |
6210.2 |
6305.8 |
1.5% |
2.5% |
17.1% |
|
S&P 500 |
2238.8 |
2415.8 |
2439.1 |
1.0% |
1.2% |
8.9% |
| Canada |
S&P/TSX Comp. |
15287.6 |
15416.9 |
15442.8 |
0.2% |
-1.5% |
1.0% |
| Mexico |
Bolsa |
45642.9 |
49688.3 |
49317.4 |
-0.7% |
-1.0% |
8.1% |
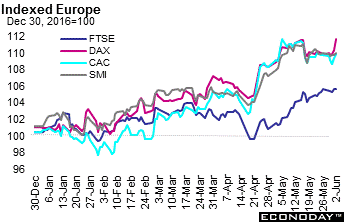 Equity indexes advanced last week with the exception of Italy's MIB which lost 1.3 percent. The FTSE, SMI and IBEX were flat, recording no change. However, the DAX added 1.8 percent while the CAC inched up 0.1 percent. Friday's gains were eroded by the weaker than expected U.S. jobs report. But stock markets in Europe are highly sensitive to growth in the U.S. as the country is a major consumer of European products and generally a driver of global growth. Despite the pullback, the markets still finished firmly in positive territory. For the month of May, most indexes recorded healthy increases — the FTSE soared 4.4 percent, the SMI added 2.3 percent, the DAX advanced 1.4 percent and the CAC managed a 0.3 percent increase. Equity indexes advanced last week with the exception of Italy's MIB which lost 1.3 percent. The FTSE, SMI and IBEX were flat, recording no change. However, the DAX added 1.8 percent while the CAC inched up 0.1 percent. Friday's gains were eroded by the weaker than expected U.S. jobs report. But stock markets in Europe are highly sensitive to growth in the U.S. as the country is a major consumer of European products and generally a driver of global growth. Despite the pullback, the markets still finished firmly in positive territory. For the month of May, most indexes recorded healthy increases — the FTSE soared 4.4 percent, the SMI added 2.3 percent, the DAX advanced 1.4 percent and the CAC managed a 0.3 percent increase.
The indexes gained despite geopolitical concerns in the UK where Prime Minister Theresa May's Conservative Party's seemingly huge margin of victory in the June 8 snap election according to opinion polls has eroded and its lead over the opposition Labour party is dwindling. The prospect of a possible election in Italy also weighed on investors as did the ongoing debt negotiations with Greece. Fears of an early election in Italy hit the banking sector Tuesday — Italians vote no later than the spring of 2018 in a general election. But Matteo Renzi, the leader of Italy's ruling centre-left Democratic Party, said that it would make sense to have the vote in September, when a German election is also planned.
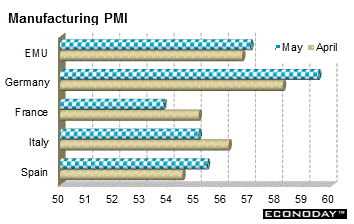 Eurozone manufacturing activity as measured by the purchasing managers index was 57.0 and 0.3 points above its final April reading and at a 6-year high. The headline improvement reflected accelerated gains in production (strongest since April 2011) and new orders (strongest in 74-months). Backlogs were also up, for a 25th successive month and at the fastest rate since early 2011. Employment was especially robust, rising at a 20-year survey record pace and business optimism remained elevated. The buoyancy of demand was reflected in increasing pressure on capacity and delivery times lengthened by more than at any time in the last six years. This was a factor in another sizeable increase in input costs although the inflation rate here still declined to a 6-month low. Much the same applied to factory gate prices which also rose appreciably but still saw their annual rate ease to a 4-month trough. Regionally the best performer was Germany (59.5) ahead of Austria (58.0) and the Netherlands (57.6). Spain (55.4) and Italy (55.1) were not far behind but France (53.8) lagged. Greece (49.6) was the only country below the 50 growth threshold. Eurozone manufacturing activity as measured by the purchasing managers index was 57.0 and 0.3 points above its final April reading and at a 6-year high. The headline improvement reflected accelerated gains in production (strongest since April 2011) and new orders (strongest in 74-months). Backlogs were also up, for a 25th successive month and at the fastest rate since early 2011. Employment was especially robust, rising at a 20-year survey record pace and business optimism remained elevated. The buoyancy of demand was reflected in increasing pressure on capacity and delivery times lengthened by more than at any time in the last six years. This was a factor in another sizeable increase in input costs although the inflation rate here still declined to a 6-month low. Much the same applied to factory gate prices which also rose appreciably but still saw their annual rate ease to a 4-month trough. Regionally the best performer was Germany (59.5) ahead of Austria (58.0) and the Netherlands (57.6). Spain (55.4) and Italy (55.1) were not far behind but France (53.8) lagged. Greece (49.6) was the only country below the 50 growth threshold.
Economic data were mostly positive with both French and Italian first quarter growth revised upward from their respective flash estimates. Unemployment in the Eurozone and Germany both improved. However, both consumer and producer prices weakened while German retail sales declined.
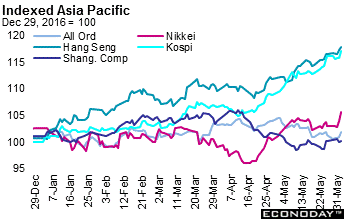 Most equity indexes advanced last week and for the month of May. A slew of positive economic data helped bolster investor morale that was weighed down by geopolitical worries that loomed in Europe. The upbeat data from the U.S. and Europe helped investors shrug off U.S. President Donald Trump's decision to withdraw from the Paris climate agreement on Friday. Investor focus remained on the U.S. employment report which was published after markets here closed for the week. Chinese investors fretted over tighter liquidity and slowing economic growth. Most equity indexes advanced last week and for the month of May. A slew of positive economic data helped bolster investor morale that was weighed down by geopolitical worries that loomed in Europe. The upbeat data from the U.S. and Europe helped investors shrug off U.S. President Donald Trump's decision to withdraw from the Paris climate agreement on Friday. Investor focus remained on the U.S. employment report which was published after markets here closed for the week. Chinese investors fretted over tighter liquidity and slowing economic growth.
On the week, only the Shanghai Composite and the SET slipped — each by 0.1 percent. Gains ranged from 0.3 percent (KLCI) to 2.5 percent and 2.7 percent (Nikkei and Topix respectively).
 Indian shares hit fresh record highs Friday with a surging rupee, hopes of good southwest monsoon rains and robust monthly sales figures from automakers helping to underpin investor sentiment. However, overall gains were capped somewhat due to caution ahead of the Reserve Bank of India's monetary policy announcement on June 7. India's GDP grew just 6.1 percent from a year earlier in the March quarter, down substantially from 7 percent growth in the previous quarter, mirroring the impact of demonetization on key sectors including construction and financial services. Indian shares hit fresh record highs Friday with a surging rupee, hopes of good southwest monsoon rains and robust monthly sales figures from automakers helping to underpin investor sentiment. However, overall gains were capped somewhat due to caution ahead of the Reserve Bank of India's monetary policy announcement on June 7. India's GDP grew just 6.1 percent from a year earlier in the March quarter, down substantially from 7 percent growth in the previous quarter, mirroring the impact of demonetization on key sectors including construction and financial services.
Japanese equities continued to fluctuate with the value of the yen against the U.S. dollar. On Friday, the Nikkei vaulted over the 20,000 level for the first time since early December 2015. The broader Topix was above 1,600 points — also for the first time in 18 months. Despite mounting global political risks, including the general election in the UK and a credit crunch in China, analysts expect the Nikkei to remain above 20,000 for some time.
Different samples of China's manufacturing sector continued to give disparate readings. May CFLP manufacturing PMI reading was 51.2, unchanged from the April reading. However, the Caixin PMI indicated that the manufacturing sector contracted in May with a reading of 49.6, down from April's 50.3.
Most Japanese economic data for April advanced with the exception of household spending. Among the increases were retail sales, industrial production, capital spending and the May manufacturing PMI.
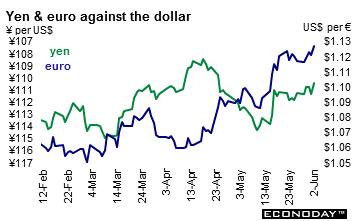 The U.S. dollar tumbled Friday after the May employment report did not meet analysts' expectations. The currency fell to seven-month lows after the U.S. economy created only 138,000 jobs — not the 174,000 expected. The implication was that it could possibly derail a third interest rate increase by the Federal Reserve in the second half of this year. Opinion remains mixed on that. On the week, the U.S. dollar was down against the yen, euro, pound sterling and Swiss franc. It advanced however, against the commodity currencies of Canada and Australia. The U.S. dollar tumbled Friday after the May employment report did not meet analysts' expectations. The currency fell to seven-month lows after the U.S. economy created only 138,000 jobs — not the 174,000 expected. The implication was that it could possibly derail a third interest rate increase by the Federal Reserve in the second half of this year. Opinion remains mixed on that. On the week, the U.S. dollar was down against the yen, euro, pound sterling and Swiss franc. It advanced however, against the commodity currencies of Canada and Australia.
 The Chinese yuan jumped in a holiday shortened week after China's central bank — the People's Bank of China — took aggressive steps to prop up the currency, a move that left traders and analysts guessing at its motivations. The PBoC surprised markets last week when it announced it would add an as-yet undefined "counter-cyclical" factor to its daily reference point calculations to overcome depreciation expectations. Coming after a period of relative stability, traders and economists searched for reasons behind the timing and purpose of the PBoC's strong midpoint fixing. Some pointed to a downgrade of China's sovereign credit rating by Moody's Investors Service last week as a contributing factor. The Chinese yuan jumped in a holiday shortened week after China's central bank — the People's Bank of China — took aggressive steps to prop up the currency, a move that left traders and analysts guessing at its motivations. The PBoC surprised markets last week when it announced it would add an as-yet undefined "counter-cyclical" factor to its daily reference point calculations to overcome depreciation expectations. Coming after a period of relative stability, traders and economists searched for reasons behind the timing and purpose of the PBoC's strong midpoint fixing. Some pointed to a downgrade of China's sovereign credit rating by Moody's Investors Service last week as a contributing factor.
|
|
2016 |
2017 |
% Change |
|
|
Dec 30 |
May 26 |
June 2 |
Week |
2017 |
| U.S. $ per currency |
|
|
|
|
|
|
| Australia |
A$ |
0.7215 |
0.745 |
0.744 |
-0.1% |
3.1% |
| New Zealand |
NZ$ |
0.6948 |
0.707 |
0.714 |
1.0% |
2.8% |
| Canada |
C$ |
0.7443 |
0.743 |
0.741 |
-0.3% |
-0.4% |
| Eurozone |
euro (€) |
1.0534 |
1.117 |
1.128 |
1.0% |
7.1% |
| UK |
pound sterling (£) |
1.2333 |
1.281 |
1.289 |
0.6% |
4.5% |
|
|
|
|
|
|
|
| Currency per U.S. $ |
|
|
|
|
|
|
| China |
yuan |
6.9450 |
6.856 |
6.810 |
0.7% |
2.0% |
| Hong Kong |
HK$* |
7.7533 |
7.792 |
7.790 |
0.0% |
-0.5% |
| India |
rupee |
67.9238 |
64.445 |
64.441 |
0.0% |
5.4% |
| Japan |
yen |
116.8100 |
111.250 |
110.420 |
0.8% |
5.8% |
| Malaysia |
ringgit |
4.4862 |
4.269 |
4.280 |
-0.3% |
4.8% |
| Singapore |
Singapore $ |
1.4465 |
1.382 |
1.381 |
0.1% |
4.8% |
| South Korea |
won |
1205.8300 |
1120.820 |
1121.880 |
-0.1% |
7.5% |
| Taiwan |
Taiwan $ |
32.3260 |
30.112 |
30.120 |
0.0% |
7.3% |
| Thailand |
baht |
35.8100 |
34.050 |
34.040 |
0.0% |
5.2% |
| Switzerland |
Swiss franc |
1.0174 |
0.9749 |
0.9627 |
1.3% |
5.7% |
| *Pegged to U.S. dollar |
|
|
|
|
|
|
| Source: Bloomberg |
|
|
|
|
|
|
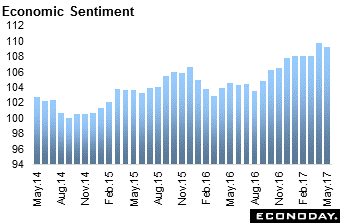 May EU Commission's economic sentiment index was 109.2 and down from April's revised 109.7 — the first decline this month since last August. However, the latest reading was still the second highest since the financial crisis. The decline in the headline index was mainly due to a lower level of confidence in services (13.0 after 14.2) although retail morale (2.0 after 3.1) also deteriorated. Losses here masked stronger posts by both households (minus 3.3 after minus 3.6) and goods producing industries (2.8 after 2.6). Construction (minus 5.7 after minus 6.0) similarly recorded a modest gain. At a country level, there were advances in the national ESI in France (107.7 after 106.2) and a smaller increase in Spain (108.4 after 107.9) but losses in Germany (109.5 after 111.0) and Italy (106.1 after 1070). May EU Commission's economic sentiment index was 109.2 and down from April's revised 109.7 — the first decline this month since last August. However, the latest reading was still the second highest since the financial crisis. The decline in the headline index was mainly due to a lower level of confidence in services (13.0 after 14.2) although retail morale (2.0 after 3.1) also deteriorated. Losses here masked stronger posts by both households (minus 3.3 after minus 3.6) and goods producing industries (2.8 after 2.6). Construction (minus 5.7 after minus 6.0) similarly recorded a modest gain. At a country level, there were advances in the national ESI in France (107.7 after 106.2) and a smaller increase in Spain (108.4 after 107.9) but losses in Germany (109.5 after 111.0) and Italy (106.1 after 1070).
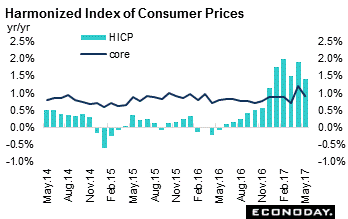 May flash harmonized index of consumer prices was up 1.4 percent on the year — down 0.5 percentage points from its final April reading and at its lowest mark since December. The slide in the headline rate was in large part mirrored in the core measures. Excluding energy, food, alcohol & tobacco the HICP was down 0.3 percentage points at 0.9 percent while omitting just energy and unprocessed food inflation dropped 0.2 percentage points to 1.0 percent. Following Easter distortions to the March and April data, the latest core rates were much in line with their respective February results, suggesting a still broadly flat underlying trend. Inflation in services declined from 1.8 percent to 1.3 percent while the rate in non-energy industrial goods was flat at 0.3 percent. Energy dropped 3 percentage points to 4.6 percent but, at 1.5 percent, food, alcohol and tobacco recorded no change. May flash harmonized index of consumer prices was up 1.4 percent on the year — down 0.5 percentage points from its final April reading and at its lowest mark since December. The slide in the headline rate was in large part mirrored in the core measures. Excluding energy, food, alcohol & tobacco the HICP was down 0.3 percentage points at 0.9 percent while omitting just energy and unprocessed food inflation dropped 0.2 percentage points to 1.0 percent. Following Easter distortions to the March and April data, the latest core rates were much in line with their respective February results, suggesting a still broadly flat underlying trend. Inflation in services declined from 1.8 percent to 1.3 percent while the rate in non-energy industrial goods was flat at 0.3 percent. Energy dropped 3 percentage points to 4.6 percent but, at 1.5 percent, food, alcohol and tobacco recorded no change.
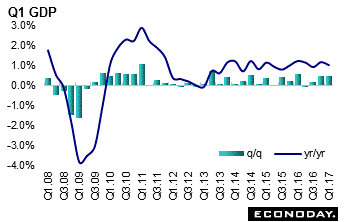 First quarter gross domestic product was up 0.4 percent on the quarter and 1.0 percent from the same quarter a year ago. Final domestic demand added 0.4 percentage points to the quarterly increase, down from 0.5 percentage points in October to December quarter and largely reflecting a (stronger revised) 1.2 percent increase in gross fixed capital formation. Within this, business investment was up 1.9 percent after a 0.9 percent advance in the fourth quarter while residential investment increased 1.0 percent. However, household consumption edged up 0.1 percent while government consumption inched down a tick to 0.3 percent. Business inventories contributed a hefty 0.7 percentage points. With exports falling 0.8 percent and imports rising 1.4 percent, net foreign trade subtracted 0.7 percentage points from quarterly growth. First quarter gross domestic product was up 0.4 percent on the quarter and 1.0 percent from the same quarter a year ago. Final domestic demand added 0.4 percentage points to the quarterly increase, down from 0.5 percentage points in October to December quarter and largely reflecting a (stronger revised) 1.2 percent increase in gross fixed capital formation. Within this, business investment was up 1.9 percent after a 0.9 percent advance in the fourth quarter while residential investment increased 1.0 percent. However, household consumption edged up 0.1 percent while government consumption inched down a tick to 0.3 percent. Business inventories contributed a hefty 0.7 percentage points. With exports falling 0.8 percent and imports rising 1.4 percent, net foreign trade subtracted 0.7 percentage points from quarterly growth.
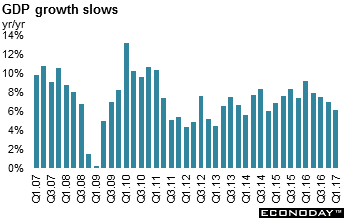
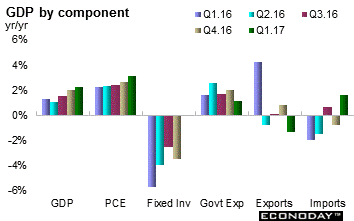
 January to March quarter gross domestic product expanded 0.3 on the quarter and was up 1.1 percent from the same months a year ago. The acceleration was largely due to a rebound in investment and a marked improvement in the real trade balance. Investment in equipment & software was up 1.7 percent on the quarter after a 0.5 percent decline last time and construction gained 0.4 percent following a 0.3 percent drop. However, household consumption was only 0.1 percent firmer and growth of government expenditure almost halved to 0.4 percent. At the same time, business inventories subtracted a sizeable 1.7 percentage points having boosted GDP by 0.5 percentage points in the fourth quarter. A 3.9 percent quarterly jump in goods exports (ex-valuables) more than reversed the fourth quarter's 3.5 percent plunge. Imports contracted 1.5 percent. Exports of services (3.2 percent) picked up as well. Inflation was a good deal stronger with the GDP deflator rising 0.8 percent on the year, up from minus 0.2 percent last time and following a run of 13 successive negative prints. Among the major GDP components, only construction prices (down 0.7 percent) failed to register a rise. January to March quarter gross domestic product expanded 0.3 on the quarter and was up 1.1 percent from the same months a year ago. The acceleration was largely due to a rebound in investment and a marked improvement in the real trade balance. Investment in equipment & software was up 1.7 percent on the quarter after a 0.5 percent decline last time and construction gained 0.4 percent following a 0.3 percent drop. However, household consumption was only 0.1 percent firmer and growth of government expenditure almost halved to 0.4 percent. At the same time, business inventories subtracted a sizeable 1.7 percentage points having boosted GDP by 0.5 percentage points in the fourth quarter. A 3.9 percent quarterly jump in goods exports (ex-valuables) more than reversed the fourth quarter's 3.5 percent plunge. Imports contracted 1.5 percent. Exports of services (3.2 percent) picked up as well. Inflation was a good deal stronger with the GDP deflator rising 0.8 percent on the year, up from minus 0.2 percent last time and following a run of 13 successive negative prints. Among the major GDP components, only construction prices (down 0.7 percent) failed to register a rise.
 April industrial production rose 4.0 on the month after declining 1.9 percent in March. The monthly gain was the largest since June 2011. On the year, output was up 7.2 percent. The monthly increase reflected stronger output in transport equipment, general purpose, production & business oriented machinery and electronic parts & devices. This was partially offset by weaker output of information & communication electronics equipment, pulp, paper & paper products and petroleum & coal products. April industrial production rose 4.0 on the month after declining 1.9 percent in March. The monthly gain was the largest since June 2011. On the year, output was up 7.2 percent. The monthly increase reflected stronger output in transport equipment, general purpose, production & business oriented machinery and electronic parts & devices. This was partially offset by weaker output of information & communication electronics equipment, pulp, paper & paper products and petroleum & coal products.
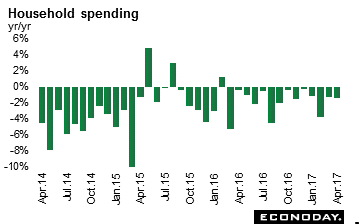 April household spending was down 1.4 percent on the year after declining 1.3 percent the month before. Housing recorded the biggest increase, up 12.1 percent. Spending on fuel, light & water charges were up 0.8 percent after contracting by 2.0 percent in March, while spending on food was down 0.7 percent after a drop of 1.3 percent the previous month. Core household spending which excludes housing, motor vehicles and other volatile items and tends to track more closely the consumption component of gross domestic product declined 1.3 percent in April, after a decline of 1.9 percent in March. April household spending was down 1.4 percent on the year after declining 1.3 percent the month before. Housing recorded the biggest increase, up 12.1 percent. Spending on fuel, light & water charges were up 0.8 percent after contracting by 2.0 percent in March, while spending on food was down 0.7 percent after a drop of 1.3 percent the previous month. Core household spending which excludes housing, motor vehicles and other volatile items and tends to track more closely the consumption component of gross domestic product declined 1.3 percent in April, after a decline of 1.9 percent in March.
 April retail sales jumped 1.0 percent after slipping 0.2 percent in March — the strongest monthly gain since 2014. On the year, sales were up 3.1 percent. All major categories increased. Food retailing (1.2 percent), cafes, restaurants & takeaway food services (1.1 percent), department stores (2.5 percent), clothing, footwear & personal accessories (0.3 percent), household goods (0.4 percent), and other retailing (0.6 percent) all advanced. Sales were up in all eight Australian states and territories. April retail sales jumped 1.0 percent after slipping 0.2 percent in March — the strongest monthly gain since 2014. On the year, sales were up 3.1 percent. All major categories increased. Food retailing (1.2 percent), cafes, restaurants & takeaway food services (1.1 percent), department stores (2.5 percent), clothing, footwear & personal accessories (0.3 percent), household goods (0.4 percent), and other retailing (0.6 percent) all advanced. Sales were up in all eight Australian states and territories.
 First quarter gross domestic product was up 0.9 percent on the quarter after increasing 0.7 percent in the fourth quarter. On an annualized basis, GDP expanded 3.7 percent, and near to the 3.8 percent growth that the Bank of Canada had expected. Growth was led by final domestic demand (plus 1.2 percent on the quarter) while exports edged down. Household final consumption expenditure rose a quarterly 1.1 percent following a 0.7 percent gain the previous quarter. Outlays on goods grew 1.5 percent while spending on services (plus 0.7 percent) also rose. Business gross fixed capital formation rose 2.9 percent following declines in eight of the previous nine quarters. Growth was driven by housing investment (plus 3.7 percent) and investment in machinery & equipment (plus 5.8 percent). Exports edged down while imports of goods & services increased. First quarter gross domestic product was up 0.9 percent on the quarter after increasing 0.7 percent in the fourth quarter. On an annualized basis, GDP expanded 3.7 percent, and near to the 3.8 percent growth that the Bank of Canada had expected. Growth was led by final domestic demand (plus 1.2 percent on the quarter) while exports edged down. Household final consumption expenditure rose a quarterly 1.1 percent following a 0.7 percent gain the previous quarter. Outlays on goods grew 1.5 percent while spending on services (plus 0.7 percent) also rose. Business gross fixed capital formation rose 2.9 percent following declines in eight of the previous nine quarters. Growth was driven by housing investment (plus 3.7 percent) and investment in machinery & equipment (plus 5.8 percent). Exports edged down while imports of goods & services increased.
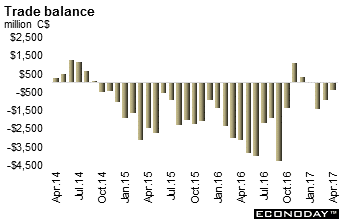 April's merchandise trade deficit narrowed to C$370 million from a revised C$936 million deficit in March. Exports rose 1.8 percent led by higher exports of passenger cars & light trucks. Imports were up 0.6 percent on the strength of import prices. Total exports rose 1.8 percent on the month to a record high C$47.7 billion with advances in 8 of 11 sections. Volumes were up 1.1 percent and prices increased 0.7 percent. On the year, total exports increased 14.7 percent. Total imports rose a monthly 0.6 percent to a record high C$48.1 billion, a fifth consecutive monthly increase, with gains in 7 of 11 sections. Prices increased 1.0 percent, while volumes were down 0.3 percent. On the year, total imports were up 7.4 percent. Exports to the United States rose 5.4 percent mostly on passenger cars, natural gas and softwood lumber. Imports from the United States were up 1.1 percent. As a result, Canada's trade surplus with the United States widened from C$3.4 billion in March to C$5.0 billion in April, the largest surplus since May 2014. Exports to countries other than the United States declined 7.8 percent in April partially offsetting the gain in exports to the United States. Canada's trade deficit with countries other than the United States widened from C$4.4 billion in March to C$5.3 billion in April. April's merchandise trade deficit narrowed to C$370 million from a revised C$936 million deficit in March. Exports rose 1.8 percent led by higher exports of passenger cars & light trucks. Imports were up 0.6 percent on the strength of import prices. Total exports rose 1.8 percent on the month to a record high C$47.7 billion with advances in 8 of 11 sections. Volumes were up 1.1 percent and prices increased 0.7 percent. On the year, total exports increased 14.7 percent. Total imports rose a monthly 0.6 percent to a record high C$48.1 billion, a fifth consecutive monthly increase, with gains in 7 of 11 sections. Prices increased 1.0 percent, while volumes were down 0.3 percent. On the year, total imports were up 7.4 percent. Exports to the United States rose 5.4 percent mostly on passenger cars, natural gas and softwood lumber. Imports from the United States were up 1.1 percent. As a result, Canada's trade surplus with the United States widened from C$3.4 billion in March to C$5.0 billion in April, the largest surplus since May 2014. Exports to countries other than the United States declined 7.8 percent in April partially offsetting the gain in exports to the United States. Canada's trade deficit with countries other than the United States widened from C$4.4 billion in March to C$5.3 billion in April.
Most equity indexes advanced both for the week and the month of May. Economic data, in large part, supported the increases. However, U.S. employment gains were less than analysts expected.
The Reserve Banks of Australia and India announce their respective monetary policy decisions on June 6 and 7 while the European Central Bank publishes its decision on June 9. The three central banks are expected to leave their policies unchanged. Economic data releases will be dominated by May composite purchasing managers' surveys along with merchandise trade balances and industrial output reports. Germany releases April data for both manufacturing orders and output. Canada however reports its labour force survey and key housing starts, both for May. The British snap election will be held on Thursday, June 8. The French election will take place in two rounds on June 11.
| Central Bank activities |
|
| June 6 |
Australia |
Reserve Bank of Australia Monetary Policy Announcement |
| June 7 |
India |
Reserve Bank of India Monetary Policy Announcement |
| June 8 |
Eurozone |
European Central Bank Monetary Policy Announcement |
| |
|
|
| The following indicators will be released this week... |
| Europe |
|
|
| June 6 |
Eurozone |
Composite & Services PMI (May) |
|
Germany |
Composite & Services PMI (May) |
|
France |
Composite & Services PMI (May) |
| June 7 |
Eurozone |
Gross Domestic Product (Q1.2017 final) |
|
Germany |
Manufacturing Orders (April) |
| June 8 |
Germany |
Industrial Production (April) |
|
France |
Merchandise Trade Balance (April) |
| June 9 |
Germany |
Merchandise Trade Balance (April) |
|
UK |
Merchandise Trade Balance (April) |
|
|
Industrial Production (April) |
|
France |
Industrial Production (April) |
| |
|
|
| Asia Pacific |
|
|
| June 7 |
Australia |
Gross Domestic Product (Q1.2017) |
| June 8 |
Japan |
Gross Domestic Product (Q1.2017 revised) |
|
Australia |
Merchandise Trade Balance (April) |
|
China |
Merchandise Trade Balance (May) |
| June 9 |
China |
Consumer Price Index (May) |
|
|
Producer Price Index (May) |
| |
|
|
| Americas |
|
|
| June 8 |
Canada |
Housing Starts (May) |
| June 9 |
Canada |
Labour Force Survey (May) |
Anne D Picker is the author of International Economic Indicators and Central Banks.
|
