|
The week's economic news is led by inflation data where once again pressures are mysteriously missing. Productivity was also released in the week and was also once again soft, at only a 0.9 percent annualized rate in the second quarter with compensation not much better. Lack of compensation isn't the greatest motivator to improve productivity, yet it's the general lack of inflation that may be keeping workers quietly content with whatever it is they earn.
 Consumer prices are struggling and are not raising alarms to remove Federal Reserve stimulus. The CPI rose a monthly 0.106 percent with the core rate up 0.114 percent (multiple decimal places are common in CPI data which underline their importance). This year's run is the weakest since 2013. Vehicle sales are soft and it's reflected in prices which fell 0.5 percent in July. And travel may also be weak given a record 4.2 percent monthly decline for hotel and motel rates. Consumer prices are struggling and are not raising alarms to remove Federal Reserve stimulus. The CPI rose a monthly 0.106 percent with the core rate up 0.114 percent (multiple decimal places are common in CPI data which underline their importance). This year's run is the weakest since 2013. Vehicle sales are soft and it's reflected in prices which fell 0.5 percent in July. And travel may also be weak given a record 4.2 percent monthly decline for hotel and motel rates.
 Wireless services, in keeping with the telecom revolution, continue to extend their long price decline with the year-on-year rate at minus 13.3 percent. This has been holding down overall rates as it did last year when wireless fell 10.8 percent. Whether looking at total prices or just the core, annual inflation is below the Fed's 2 percent target for the 3rd month in a row as both came in at a disappointing 1.7 percent in July. Other areas of annual weakness are apparel, down 0.4 percent, and food, up only 1.1 percent. Wireless services, in keeping with the telecom revolution, continue to extend their long price decline with the year-on-year rate at minus 13.3 percent. This has been holding down overall rates as it did last year when wireless fell 10.8 percent. Whether looking at total prices or just the core, annual inflation is below the Fed's 2 percent target for the 3rd month in a row as both came in at a disappointing 1.7 percent in July. Other areas of annual weakness are apparel, down 0.4 percent, and food, up only 1.1 percent.
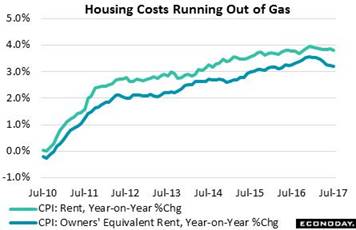 But these areas of weakness, whether one-time or constant, are dwarfed by housing which makes up more than 40 percent of the CPI. The accompanying graph tracks rental costs and also the cost of owners to live in their own home. Both are topping out with rents stalling at the 4 percent line and owner costs falling toward 3 percent. This is their softest stretch of the expansion and is not consistent with an inflationary flashpoint. Housing costs are not setting a fire under workers to earn more and produce more. But these areas of weakness, whether one-time or constant, are dwarfed by housing which makes up more than 40 percent of the CPI. The accompanying graph tracks rental costs and also the cost of owners to live in their own home. Both are topping out with rents stalling at the 4 percent line and owner costs falling toward 3 percent. This is their softest stretch of the expansion and is not consistent with an inflationary flashpoint. Housing costs are not setting a fire under workers to earn more and produce more.
 Productivity, that is inflation-adjusted output per hour, is generally always on the rise given ever unfolding efficiencies in production, but it has been rising less so than before. A slower pace of efficiency improvement equates to a slower pace for compensation. The last great boost in productivity came with the 2008 and 2009 recession and the massive culling of the least efficient workers. Before that, productivity got a strong boost from the dotcom emergence in the late 1990s and early 2000s. Productivity, that is inflation-adjusted output per hour, is generally always on the rise given ever unfolding efficiencies in production, but it has been rising less so than before. A slower pace of efficiency improvement equates to a slower pace for compensation. The last great boost in productivity came with the 2008 and 2009 recession and the massive culling of the least efficient workers. Before that, productivity got a strong boost from the dotcom emergence in the late 1990s and early 2000s.
 Other data in the week include inflation-adjusted wages, part of the CPI report. Earning the title of "real", average hourly earnings slipped 2 tenths in July to a year-on-year 0.7 percent. This reading has been under the 1 percent line since October last year. The monthly reading for this measure did finally show some life in the prior week's employment report with an unadjusted 0.3 percent gain, but it will take a continued run of strength to level out the 2-year trend line which remains in a deep downslope. Other data in the week include inflation-adjusted wages, part of the CPI report. Earning the title of "real", average hourly earnings slipped 2 tenths in July to a year-on-year 0.7 percent. This reading has been under the 1 percent line since October last year. The monthly reading for this measure did finally show some life in the prior week's employment report with an unadjusted 0.3 percent gain, but it will take a continued run of strength to level out the 2-year trend line which remains in a deep downslope.
 If wages aren't up then, sticking to the usual law of supply and demand, demand for labor must not be that strong. But this is not the signal from job openings in JOLTS data which are at a record 6.163 million. Year-on-year, openings are up a strong 11.3 percent. There are so many jobs to be filled that hiring isn't keeping pace, falling to 5.356 million for only a 3.5 percent yearly gain. But this mismatch between openings and hirings, evident for the last 2 years, has yet to force employers to raise their offers. If wages aren't up then, sticking to the usual law of supply and demand, demand for labor must not be that strong. But this is not the signal from job openings in JOLTS data which are at a record 6.163 million. Year-on-year, openings are up a strong 11.3 percent. There are so many jobs to be filled that hiring isn't keeping pace, falling to 5.356 million for only a 3.5 percent yearly gain. But this mismatch between openings and hirings, evident for the last 2 years, has yet to force employers to raise their offers.
 Yes, but JOLTS data have only been around for 17 years and can be volatile month-to-month. So let's turn to jobless claims. Initial claims start in 1948 and are at their lowest since the early 1970s. And relative to the size of the workforce, they've never been this low. Continuing claims don't go back as far but they too are at record lows. The unemployment rate? It's at 4.3 percent which is a 16 year low. Saying there's still slack in the labor market is not an easy argument to make, at least based on economic data. Yes, but JOLTS data have only been around for 17 years and can be volatile month-to-month. So let's turn to jobless claims. Initial claims start in 1948 and are at their lowest since the early 1970s. And relative to the size of the workforce, they've never been this low. Continuing claims don't go back as far but they too are at record lows. The unemployment rate? It's at 4.3 percent which is a 16 year low. Saying there's still slack in the labor market is not an easy argument to make, at least based on economic data.
 The week also saw the end of the labor market conditions index which backfired for the Fed. The index, an eclectic composite of 19 indicators from both government and private sources, was an effort by the Fed to track job conditions and offer an advance signal for wage changes. But as the graph shows, it went up and down while wages went nowhere. This index's demise won't be hurting economic modeling much and will mean one less unpleasant question for Janet Yellen to answer at her press conferences. The week also saw the end of the labor market conditions index which backfired for the Fed. The index, an eclectic composite of 19 indicators from both government and private sources, was an effort by the Fed to track job conditions and offer an advance signal for wage changes. But as the graph shows, it went up and down while wages went nowhere. This index's demise won't be hurting economic modeling much and will mean one less unpleasant question for Janet Yellen to answer at her press conferences.
 The week in the markets wasn't about economics. It was about rising tension with North Korea that sent shares down sharply. Money that moved out of stocks moved into both Treasuries and gold where valuations are near their best levels of the year. Gold's year-to-date appreciation, at over 12 percent, is almost up there with the Nasdaq. An easing in tensions would likely reverse these moves though the lack of inflation, and with it the signal that interest rates will remain low, may well keep up demand for bonds. The week in the markets wasn't about economics. It was about rising tension with North Korea that sent shares down sharply. Money that moved out of stocks moved into both Treasuries and gold where valuations are near their best levels of the year. Gold's year-to-date appreciation, at over 12 percent, is almost up there with the Nasdaq. An easing in tensions would likely reverse these moves though the lack of inflation, and with it the signal that interest rates will remain low, may well keep up demand for bonds.
| Markets at a Glance |
Year-End |
Week Ended |
Week Ended |
Year-To-Date |
Weekly |
|
2016 |
4-Aug-17 |
11-Aug-17 |
Change |
Change |
| DJIA |
19,762.60 |
22,092.81 |
21,858.32 |
10.6% |
-1.1% |
| S&P 500 |
2,238.83 |
2,476.83 |
2,441.32 |
9.0% |
-1.4% |
| Nasdaq Composite |
5,383.12 |
6,351.56 |
6,256.56 |
16.2% |
-1.5% |
|
|
|
|
|
|
| Crude Oil, WTI ($/barrel) |
$53.71 |
$49.22 |
$48.79 |
-9.2% |
-0.9% |
| Gold (COMEX) ($/ounce) |
$1,152.50 |
$1,262.00 |
$1,296.70 |
12.5% |
2.7% |
|
|
|
|
|
|
| Fed Funds Target |
0.50 to 0.75% |
1.00 to 1.25% |
1.00 to 1.25% |
50 bp |
0 bp |
| 2-Year Treasury Yield |
1.21% |
1.35% |
1.28% |
7 bp |
–7 bp |
| 10-Year Treasury Yield |
2.45% |
2.26% |
2.19% |
–26 bp |
–7 bp |
| Dollar Index |
102.26 |
93.63 |
93.07 |
-9.0% |
-0.6% |
The Fed will no doubt be scrambling to find inflationary pressures in the economy, perhaps continuing to argue that wireless prices are bound to stop falling or maybe shifting their focus to new moving averages or annualized rates that can help their cause. And their cause? The realization of their long telegraphed plans to raise interest rates and begin tapering down their massive bond holdings. But the bread-and-butter inflation measures -- month-to-month percentage change in the CPI and most importantly year-on-year percentage change -- are really not pointing to the risk of overheating. The laws of economics appear to be in flux: Strong demand for labor is not resulting in upward pressure for wages.
Consumer spending starts the week off on Tuesday with retail sales expected to rebound in moderate strength. Empire State, also on Tuesday, will start the week's manufacturing data off which follow on Thursday with industrial production and also the Philly Fed. The sum of manufacturing expectations is for moderate strength. Housing data also begin on Tuesday with the housing market index followed as always on the next day by housing starts and permits. For housing, volatility along an improving path is the likely outcome. Wednesday sees FOMC minutes from last month's meeting which produced no action and no hint on when balance-sheet unwinding begins. Friday winds up with August consumer sentiment, a report that has long faded and is running far behind the rival consumer confidence report which has been holding steady at enormous highs.
Retail Sales for July
Consensus Forecast: 0.3%
Consensus Range: 0.2% to 0.5%
Retail Sales Ex-Autos
Consensus Forecast: 0.3%
Consensus Range: 0.2% to 0.5%
Retail Sales Ex-Autos Ex-Gas
Consensus Forecast: 0.4%
Consensus Range: 0.3% to 0.4%
Retail Sales Control Group (Ex-Food Services, Ex-Autos, Ex-Gas, Ex-Building Materials)
Consensus Forecast: 0.5%
Consensus Range: 0.3% to 0.6%
Retail sales have been among the most disappointing of any economic indicator this year but expectations are looking for a constructive rebound in July. The Econoday consensus is calling for a 0.3 percent gain vs a 0.2 percent decline in June. With unit vehicle sales flat in July, cars and trucks are not expected to impact monthly change as the ex-autos reading is also expected to come in at plus 0.3 percent. Two other readings -- less autos & gas and control group sales -- both declined 0.1 percent in June and forecasters are looking for strong respective rebounds of 0.4 percent and 0.5 percent.
Empire State Index for August
Consensus Forecast: 9.8
Consensus Range: 7.0 to 15.0
The Empire State report will be the first factory indication on the month of August and yet another solid score, at a consensus 9.8, is expected in what would compare with July's 9.8. New orders in July, which are a leading indication for general August strength, were very solid though backlog orders did contract which could be a negative for employment.
Import Prices for July
Consensus Forecast, Month-to-Month Change: 0.2%
Consensus Range: -0.1% to 0.2%
Export Prices
Consensus Forecast, Month-to-Month Change: 0.2%
Consensus Range: 0.0% to 0.3%
Consumer prices and producer prices were both weak in July but moderate gains are expected for import and export prices. Import prices, which have fallen for 2 straight months, are expected to rise 0.2 percent vs minus 0.2 percent in June. Export prices, which also fell 0.2 percent in June, are likewise expected to rise 0.2 percent.
Business Inventories for June
Consensus Forecast, Month-to-Month Change: 0.4%
Consensus Range: 0.2% to 0.6%
Business inventories have been inching higher, up 0.3 percent in May but following a 0.2 percent decline in April. But advance indications for June were very strong, rising 0.6 percent each for the wholesale and retail components with manufacturing rising 0.2 percent. Econoday forecasters are calling for a 0.4 percent gain in June in data that could affect revision estimates for second-quarter GDP.
Housing Market Index for August
Consensus Forecast: 65
Consensus Range: 63 to 66
Optimism among home builders has been fading in recent months as the housing market index, reflecting a downturn in buyer traffic, came in at 64 in July vs high 60 readings earlier in the year. High prices for new homes along with thin supply have been holding back the market. The consensus for August is 65.
Housing Starts for July
Consensus Forecast, Adjusted Annualized Rate: 1.225 million
Consensus Range: 1.174 to 1.250 million
Building Permits
Consensus Forecast: 1.246 million
Consensus Range: 1.230 to 1.270 million
Starts and permits proved unexpectedly weak in both April and May but then surged in June, up a monthly 8.3 percent to a 1.215 million annualized rate for starts and up 7.4 percent for permits to a 1.254 million rate. Still both readings relative to the first quarter slowed. Housing starts for July are seen rising to a 1.225 million rate with housing permits at 1.246 million. This report is often very volatile and sharp revisions to June's starts could affect revision estimates for second-quarter GDP.
FOMC Minutes
Covering the July 25 & 26 Meeting
Federal Reserve policy makers took a pass at the July FOMC, holding rates unchanged and offering no hints whether balance sheet unwinding would begin as early as the September meeting or perhaps later in the year. The crack in the armor holding back further withdrawal of stimulus was inflation which was described as "declining" vs "somewhat declining" at the June meeting. Any dissent in the FOMC minutes over unwinding, whether sooner or later, could move the markets.
Initial Jobless Claims for August 12 week
Consensus Forecast: 241,000
Consensus Range: 238,000 to 245,000
The summer's auto retooling season has yet to be a factor in weekly jobless claims which, apparently benefiting from good seasonal adjustments, have held very steady at very low levels. Forecasters sees initial claims coming in at 241,000 in the August 12 week vs 244,000 in the August 5 week.
Philadelphia Fed Manufacturing Index for August
Consensus Forecast: 17.0
Consensus Range: 13.0 to 22.0
Growth in the factory sector has been getting underway, well behind but still consistent at least in direction with the Philadelphia Fed index which has been showing exceptional strength since late last year. But new orders did show only marginal strength in the July report which is limiting Econoday's August consensus for the overall index, at 17.0 vs 19.5 in July.
Industrial Production for July
Consensus Forecast, Month-to-Month Change: 0.3%
Consensus Range: 0.2% to 0.4%
Manufacturing Production
Consensus Forecast, Month-to-Month Change: 0.2%
Consensus Range: 0.0% to 0.3%
Capacity Utilization Rate
Consensus Forecast: 76.7%
Consensus Range: 76.4% to 76.9%
Driven by another month of unusual strength for the mining component, industrial production rose 0.4 percent in June to overshadow a less impressive 0.2 percent gain for the more important and mostly sluggish manufacturing component. Industrial production is seen rising 0.3 percent in July with manufacturing posting another 0.2 percent gain. Capacity utilization is expected to firm to 76.7 percent vs June's 76.6 percent.
Index of Leading Economic Indicators for July
Consensus Forecast, Month-to-Month Change: 0.3%
Consensus Range: 0.2% to 0.4%
The index of leading economic indicators surged 0.6 percent in July and was led by a strong rebound in housing permits which had held down the index during the Spring. Low short-term interest rates as well as strength in consumer confidence have been consistent positives in this report.
Consumer Sentiment Index, preliminary August
Consensus Forecast: 93.9
Consensus Range: 93.0 to 96.0
Unlike the consumer confidence index which is holding steady near 20-year highs, the consumer sentiment index has been falling back, down more than 5 points from its highs early in the year to 93.4 in July. Econoday's consensus for the preliminary August report is calling for a modest rebound to 93.9. July showed continued strength in current conditions but a noticeable slowing in expectations in a divergence that hints at year-end erosion for the headline index.
|
