|
The hurricane shock in Houston is catastrophic but the effects on the national economy look to be temporary. The labor market is healthy and economic growth has been solid and is not likely to be derailed. There are some areas of the economy, however, that may very well spike and dip and there may be one oddly beneficial effect, that is an increase in consumer energy prices.
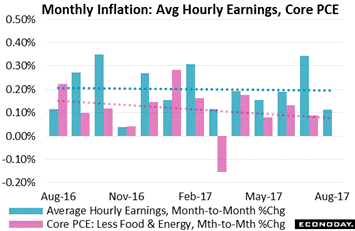 And inflation needs all the help it can get. Economic news in the week is led by average hourly earnings which failed to meet even modest expectations, up only 0.11 percent in August to match March as the weakest month of the year. This is the first major inflation reading for the month of August and follows the final and definitive reading for July which was also released in the week, an equally dismal 0.09 percent rise for the core PCE -- the central price index for monetary policy. And inflation needs all the help it can get. Economic news in the week is led by average hourly earnings which failed to meet even modest expectations, up only 0.11 percent in August to match March as the weakest month of the year. This is the first major inflation reading for the month of August and follows the final and definitive reading for July which was also released in the week, an equally dismal 0.09 percent rise for the core PCE -- the central price index for monetary policy.
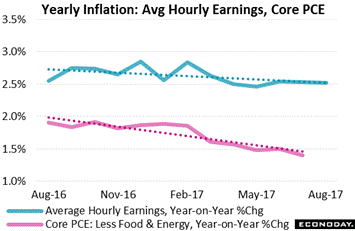 The popular comparison for inflation is year-on-year and the word dismal also fits here. Hourly earnings are simply going nowhere. After approaching 3 percent early in the year, earnings have been stuck at 2.5 percent for the last 5 months. This needs to move above 3 percent and even toward 4 percent before it begins to pull up the core PCE which, instead of moving sideways, is actually moving lower: from 1.9 percent in February to 1.4 percent in July. The popular comparison for inflation is year-on-year and the word dismal also fits here. Hourly earnings are simply going nowhere. After approaching 3 percent early in the year, earnings have been stuck at 2.5 percent for the last 5 months. This needs to move above 3 percent and even toward 4 percent before it begins to pull up the core PCE which, instead of moving sideways, is actually moving lower: from 1.9 percent in February to 1.4 percent in July.
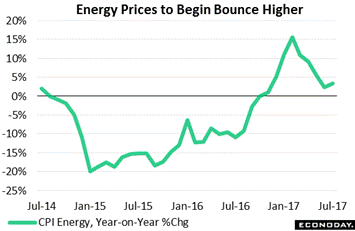 But energy, after Harvey, may be moving up. Gasoline prices are 20 cents higher to a wholesale $1.74 per gallon in just one week. But prices for crude actually fell in the week in a reminder that the nation, after a decade of new drilling techniques, is awash in energy. How long gasoline can hold the gain is in question. Hurricane Katrina, which hit Gulf production in 2005 though not as hard as Harvey, made for an initial 14 percent spike in consumer energy prices which was reversed by dips in the 3 following months. But energy, after Harvey, may be moving up. Gasoline prices are 20 cents higher to a wholesale $1.74 per gallon in just one week. But prices for crude actually fell in the week in a reminder that the nation, after a decade of new drilling techniques, is awash in energy. How long gasoline can hold the gain is in question. Hurricane Katrina, which hit Gulf production in 2005 though not as hard as Harvey, made for an initial 14 percent spike in consumer energy prices which was reversed by dips in the 3 following months.
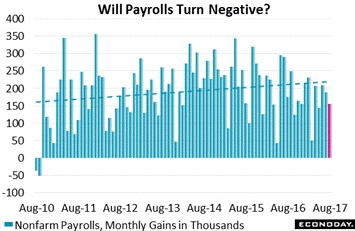 Harvey's effect on payroll growth is another question. August payrolls were one of the week's disappointments, coming in on the soft side at 156,000 which, however, is still a useful level of growth. And growth, uninterrupted for nearly seven years, may now be in jeopardy. Sandy, the second costliest hurricane behind Katrina, hit the Mid-Atlantic in 2012 but had no visible effect on employment. Yet Katrina did have an effect, sweeping away more than 200,000 payroll jobs, at least initially. Harvey's effect on payroll growth is another question. August payrolls were one of the week's disappointments, coming in on the soft side at 156,000 which, however, is still a useful level of growth. And growth, uninterrupted for nearly seven years, may now be in jeopardy. Sandy, the second costliest hurricane behind Katrina, hit the Mid-Atlantic in 2012 but had no visible effect on employment. Yet Katrina did have an effect, sweeping away more than 200,000 payroll jobs, at least initially.
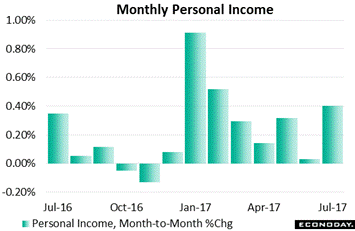 One area that Katrina did not hurt, despite the temporary loss of jobs, was personal income where gains held steady through late 2005. And this is where the week's good news starts. Personal income, which tracks all sources of income including for instance rents, rose a solid 0.40 percent in July for the best result since February in what is a partial offset to August's weakness in average hourly earnings. Yet the yearly trend for personal income is still soft, stuck at 2.7 percent vs 3.4 percent early in the year. One area that Katrina did not hurt, despite the temporary loss of jobs, was personal income where gains held steady through late 2005. And this is where the week's good news starts. Personal income, which tracks all sources of income including for instance rents, rose a solid 0.40 percent in July for the best result since February in what is a partial offset to August's weakness in average hourly earnings. Yet the yearly trend for personal income is still soft, stuck at 2.7 percent vs 3.4 percent early in the year.
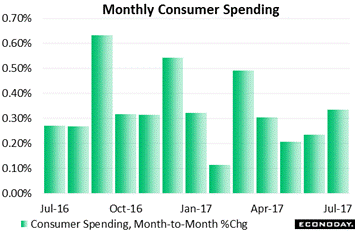 Consumer spending is the other side of the personal income report and here too the news is good. In fact, third-quarter GDP is off to a solid start based on July spending which rose 0.34 percent for the best result since March. Yet this was a bit below consensus with downward pull due to services coming in at 0.23 percent. But services are the steadiest of the spending components which hints at a service-related rebound for coming reports. Katrina and Sandy had no major impact on consumer spending. Consumer spending is the other side of the personal income report and here too the news is good. In fact, third-quarter GDP is off to a solid start based on July spending which rose 0.34 percent for the best result since March. Yet this was a bit below consensus with downward pull due to services coming in at 0.23 percent. But services are the steadiest of the spending components which hints at a service-related rebound for coming reports. Katrina and Sandy had no major impact on consumer spending.
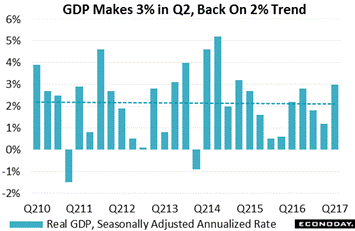 And it was prior consumer spending that made for the best news in the week as the second estimate of second-quarter GDP was revised 4 tenths higher to hit the 3 percent annualized rate for the first time in more than 2 years. Consumer spending, which makes up more than 2/3 of GDP, rose at a very solid inflation-adjusted rate of 3.3 percent for the best showing since the second quarter of last year. GDP has been struggling the past couple of years but is now trending right at the 2 percent line. And it was prior consumer spending that made for the best news in the week as the second estimate of second-quarter GDP was revised 4 tenths higher to hit the 3 percent annualized rate for the first time in more than 2 years. Consumer spending, which makes up more than 2/3 of GDP, rose at a very solid inflation-adjusted rate of 3.3 percent for the best showing since the second quarter of last year. GDP has been struggling the past couple of years but is now trending right at the 2 percent line.
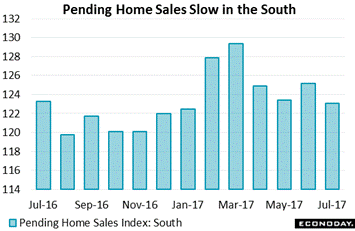 Turning to specific sectors and what to expect from Harvey we move to housing. The south is by far the largest housing region, making up more than 40 percent of the nation's resale market. This size will limit the hurricane's effect on the region's sales. Following Katrina, both resales and new home sales showed no major effects. Pending sales of existing homes were another of the week's disappointments including data for the south where sales fell to an index of 123.1 for a 1.7 percent monthly decline. Turning to specific sectors and what to expect from Harvey we move to housing. The south is by far the largest housing region, making up more than 40 percent of the nation's resale market. This size will limit the hurricane's effect on the region's sales. Following Katrina, both resales and new home sales showed no major effects. Pending sales of existing homes were another of the week's disappointments including data for the south where sales fell to an index of 123.1 for a 1.7 percent monthly decline.
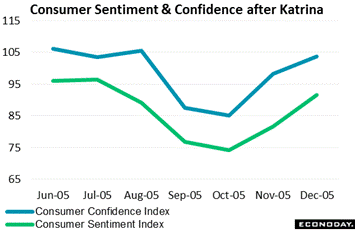 Now let's turn to areas that are very likely to show hurricane effects. Confidence readings plunged after both Katrina and also following Sandy. Let's look back at what happened to the consumer confidence and consumer sentiment indexes in the wake of Katrina. The psychological impact of New Orleans' destruction in 2005 made for deep declines after the hurricane. Yet this was followed by major rebounds late in the year. A repeat of this pattern should be no surprise. Now let's turn to areas that are very likely to show hurricane effects. Confidence readings plunged after both Katrina and also following Sandy. Let's look back at what happened to the consumer confidence and consumer sentiment indexes in the wake of Katrina. The psychological impact of New Orleans' destruction in 2005 made for deep declines after the hurricane. Yet this was followed by major rebounds late in the year. A repeat of this pattern should be no surprise.
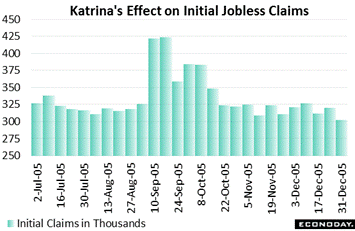 The most dramatic effect Harvey will likely have on economic data will be initial jobless claims, which ironically have been rock steady at historic lows all year long. Back in 2005, claims were trending in the 320,000 range before Katrina struck late in August. The result is obvious: a giant 100,000 spike to 425,000 before people got back to work and claims resumed their prior trend. Sandy in 2012 had a very similar but less dramatic effect. Going into Harvey's effect, claims have been steady at the 235,000 level. The most dramatic effect Harvey will likely have on economic data will be initial jobless claims, which ironically have been rock steady at historic lows all year long. Back in 2005, claims were trending in the 320,000 range before Katrina struck late in August. The result is obvious: a giant 100,000 spike to 425,000 before people got back to work and claims resumed their prior trend. Sandy in 2012 had a very similar but less dramatic effect. Going into Harvey's effect, claims have been steady at the 235,000 level.
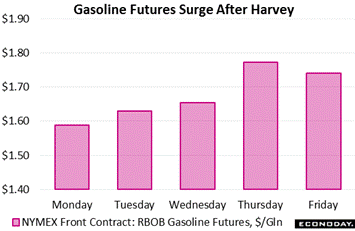 Investors take pride in anticipating events and allocating funds in the most efficient manner, right? Well maybe not. Yes there's a glut of crude but gasoline is a refined commodity. It wasn't until Thursday that reality set in and gasoline futures surged 8 percent in one day! This was money waiting to be had. Gasoline futures actually hit a low of $1.54 on the Friday before. Harvey was a giant storm hitting the central infrastructure of the Gulf petroluem sector. Wasn't anybody looking at the radar? Investors take pride in anticipating events and allocating funds in the most efficient manner, right? Well maybe not. Yes there's a glut of crude but gasoline is a refined commodity. It wasn't until Thursday that reality set in and gasoline futures surged 8 percent in one day! This was money waiting to be had. Gasoline futures actually hit a low of $1.54 on the Friday before. Harvey was a giant storm hitting the central infrastructure of the Gulf petroluem sector. Wasn't anybody looking at the radar?
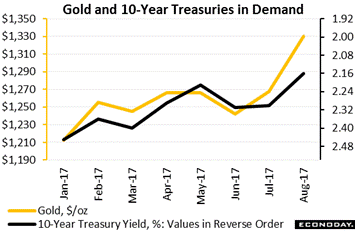 Following Katrina and Sandy, demand for bonds rose making for 10 basis point dips in the 10-year Treasury yield in each case. Gold showed no effects but is on the rise right now apart from hurricane worries. Helping gold, along with the 10-year bond, is the month-end budget standoff and the risk of a shutdown when the government runs out of available cash, a possibility being pulled forward by the drain on Federal coffers from hurricane assistance. It's fireworks, not another flood, that await us. Following Katrina and Sandy, demand for bonds rose making for 10 basis point dips in the 10-year Treasury yield in each case. Gold showed no effects but is on the rise right now apart from hurricane worries. Helping gold, along with the 10-year bond, is the month-end budget standoff and the risk of a shutdown when the government runs out of available cash, a possibility being pulled forward by the drain on Federal coffers from hurricane assistance. It's fireworks, not another flood, that await us.
| Markets at a Glance |
Year-End |
Week Ended |
Week Ended |
Year-To-Date |
Weekly |
|
2016 |
25-Aug-17 |
1-Sep-17 |
Change |
Change |
| DJIA |
19,762.60 |
21,813.67 |
21,987.56 |
11.3% |
0.8% |
| S&P 500 |
2,238.83 |
2,443.05 |
2,476.55 |
10.6% |
1.4% |
| Nasdaq Composite |
5,383.12 |
6,265.64 |
6,435.33 |
19.5% |
2.7% |
|
|
|
|
|
|
| Crude Oil, WTI ($/barrel) |
$53.71 |
$47.79 |
$47.31 |
-11.9% |
-1.0% |
| Gold (COMEX) ($/ounce) |
$1,152.50 |
$1,296.30 |
$1,330.50 |
15.4% |
2.6% |
|
|
|
|
|
|
| Fed Funds Target |
0.50 to 0.75% |
1.00 to 1.25% |
1.00 to 1.25% |
50 bp |
0 bp |
| 2-Year Treasury Yield |
1.21% |
1.35% |
1.34% |
13 bp |
–1 bp |
| 10-Year Treasury Yield |
2.45% |
2.17% |
2.16% |
–29 bp |
–1 bp |
| Dollar Index |
102.26 |
92.56 |
92.83 |
-9.2% |
0.3% |
Amid reports that 1/2 million vehicles have been lost, autos are another area that Harvey may skew even though the flooding of New Orleans during Katrina had no visible effect on unit sales. What we generally should expect is several months of up-and-down results for some data though the bigger picture is likely to remain unchanged: a full employment economy running at a moderate pace of growth and with, other than blips for gasoline, surprisingly little inflationary pressures. And what does Harvey mean for Fed policy? Aside from statements on temporary effects, it probably doesn't mean very much.
A light holiday-shortened week for economic data starts off Tuesday with factory orders where a sharp aircraft-related decline in the headline will mask, based on advance data for durable goods, underlying strength in ex-transportation orders. International trade will start off Wednesday's data and a widening deficit is the call based again on advance data that showed weakness in goods exports in what looks to be a negative opening for third-quarter net exports. August data on the service sector will follow on Wednesday morning with sample results from PMI services, where the month's flash was very solid, followed by ISM's non-manufacturing survey where enormous strength is the usual routine. But it will be the afternoon release of the Beige Book that will cap off Wednesday in a report where modest to moderate strength has been the result report after report. Thursday sees jobless claims, where forecasters do not see any initial effects from Hurricane Harvey appearing, followed by the second estimate for productivity and costs on Thursday.
Factory Orders for July
Consensus Forecast, Month-to-Month Change: -3.1%
Consensus Range: -3.4% to -0.2%
Factory orders are expected to fall 3.1 percent in July though most underlying data are likely to show strength based on the advance release of the durables side of the report. There was one mystery, however, on the durables side and that was strength in capital goods orders even though the machinery component, which is at the heart of capital goods, fell sharply.
International Trade Balance for July
Consensus Forecast: -$44.6 billion
Consensus Range: -$44.8 to -$43.0 billion
Forecasters see the international trade gap for goods and services widening to a consensus $44.6 billion in July from $43.6 billion in June. This would be in line with advance data on the goods part of the report which, reflecting weak June exports for vehicles and consumer goods, widened sharply.
PMI Services for August, Final
Consensus Forecast: 56.9
Consensus Range: 54.6 to 56.9
PMI services surged nearly 3 points in the August flash to 56.9 which is the level that forecasters see the index holding at in the final reading. New orders, employment and selling prices were all positives in August's flash report.
ISM Non-Manufacturing Index for August
Consensus Forecast: 55.4
Consensus Range: 53.8 to 56.5
In a rare outcome, the ISM non-manufacturing report for July did not beat all estimates, coming in instead at 53.9 to show the least strength since August last year. Growth in new orders slowed as did employment though there were still signs of strength with gains for backlog orders and slowing in delivery times. Forecasters are calling for a bounce back in August to 55.4.
Beige Book
Prepared for the September 19 & 20 FOMC Meeting
The Beige Book has been very soft with economic growth, in the weakest result all year, described in the last report as no better than "slight-to-moderate" across the Federal Reserve's 12 districts. And inflation got a downgrade with some districts reporting an easing in pressure. The latest report, especially the description of consumer spending, will offer early hints on how strong the breadth of the August economy was.
Initial Jobless Claims for September 2 week
Consensus Forecast: 239,000
Consensus Range: 235,000 to 246,000
The effects of Hurricane Harvey are not expected to be visible in weekly jobless claims for the September 2 week. Forecasters sees initial claims coming in at 239,000, little changed from 236,000 in the August 26 week.
Nonfarm Productivity, 2nd Estimate, 2nd Quarter
Consensus Forecast, Annualized Rate: 1.3%
Consensus Range: 0.9% to 1.5%
Unit Labor Costs
Consensus Forecast, Annualized Rate: 0.3%
Consensus Range: 0.0% to 0.6%
Upwardly revised 3.0 percent GDP points to an upgrade for second-quarter productivity and a downward revision for labor costs. For the second estimate of the second quarter, forecasters see nonfarm productivity rising 1.3 percent vs an initial gain of 0.9 percent and unit labor costs at plus 0.3 percent vs an initial 0.6 percent rise.
Wholesale Inventories for July
Consensus Forecast, Month-to-Month Change: 0.4%
Consensus Range: 0.2% to 0.4%
Wholesale trade inventories are expected to rise 0.4 percent, matching July's advance estimate. Wholesalers, after keeping their inventories down early in the year, began to restock, and significantly, in April.
Consumer Credit for July
Consensus Forecast: $15.7 billion
Consensus Range: $14.4 to $18.0 billion
Growth in consumer credit is expected to firm with the Econoday consensus calling for growth of $15.7 billion in July vs $12.4 billion in June. Revolving credit, where growth has been limited, is on the climb and raising questions whether financial firms are now lending to less qualified borrowers.
|
