|
Investors began 2018 in a chipper mood and continued where they left off in 2017 — they sent equities flying in the first week of the year, especially in Japan. While there were robust weekly gains elsewhere, in only two days of trading, the Nikkei managed to add 4.2 percent. Elsewhere, numerous indexes increased more than 3 percent for the week including the Topix (3.5 percent), Hang Seng (3.0 percent), CAC (3.0 percent), DAX (3.1 percent), FTSE MIB (4.2 percent), IBEX (3.7 percent) and Nasdaq (3.4 percent).
Bank of Canada expectations change
Odds that the Bank of Canada will raise interest rates at their meeting scheduled for January 17 jumped Friday after an unexpectedly strong December employment report. The report sparked talk that the Bank will reassess their cautious stance and move towards further interest rate increases this year. After raising its main policy interest rates by 25 basis points twice in 2017 to 1.0 percent, the BoC has been more dovish in recent months, warning that the blistering pace of growth seen during the first six months of the year was expected to sharply moderate. However, recent data suggests that the Canadian economy has remained surprisingly resilient despite the rate increases thanks in part to the ongoing rally in global oil prices.
| |
|
2017 |
2017-2018 |
% Change |
|
Index |
Dec 29 |
Dec 29 |
Jan 5 |
Week |
2018 |
| Asia/Pacific |
|
|
|
|
|
|
| Australia |
All Ordinaries |
6167.3 |
6167.3 |
6167.29 |
1.0% |
1.0% |
| Japan |
Nikkei 225 |
22764.9 |
22764.9 |
22764.94 |
4.2% |
4.2% |
|
Topix |
1817.56 |
1817.56 |
1817.56 |
3.5% |
3.5% |
| Hong Kong |
Hang Seng |
29919.2 |
29919.2 |
29919.15 |
3.0% |
3.0% |
| S. Korea |
Kospi |
2467.5 |
2467.5 |
2467.49 |
1.2% |
1.2% |
| Singapore |
STI |
3402.9 |
3402.9 |
3402.92 |
2.5% |
2.5% |
| China |
Shanghai Composite |
3307.2 |
3307.2 |
3307.17 |
2.6% |
2.6% |
|
|
|
|
|
|
|
| India |
Sensex 30 |
34056.8 |
34056.83 |
34056.83 |
0.3% |
0.3% |
| Indonesia |
Jakarta Composite |
6355.7 |
6355.7 |
6355.65 |
0.0% |
0.0% |
| Malaysia |
KLCI |
1796.8 |
1796.8 |
1796.81 |
1.2% |
1.2% |
| Philippines |
PSEi |
8558.4 |
8558.4 |
8558.42 |
2.5% |
2.5% |
| Taiwan |
Taiex |
10642.9 |
10642.9 |
10642.86 |
2.2% |
2.2% |
| Thailand |
SET |
1753.7 |
1753.7 |
1753.71 |
2.4% |
2.4% |
|
|
|
|
|
|
|
| Europe |
|
|
|
|
|
|
| UK |
FTSE 100 |
7687.8 |
7687.8 |
7687.77 |
0.5% |
0.5% |
| France |
CAC |
5312.6 |
5312.6 |
5312.56 |
3.0% |
3.0% |
| Germany |
XETRA DAX |
12917.6 |
12917.6 |
12917.64 |
3.1% |
3.1% |
| Italy |
FTSE MIB |
21853.3 |
21853.3 |
21853.34 |
4.2% |
4.2% |
| Spain |
IBEX 35 |
10043.9 |
10043.9 |
10043.90 |
3.7% |
3.7% |
| Sweden |
OMX Stockholm 30 |
1576.9 |
1576.9 |
1576.94 |
2.2% |
2.2% |
| Switzerland |
SMI |
9381.9 |
9381.9 |
9381.87 |
1.9% |
1.9% |
|
|
|
|
|
|
|
| North America |
|
|
|
|
|
|
| United States |
Dow |
24719.2 |
24719.22 |
25295.87 |
2.3% |
2.3% |
|
NASDAQ |
6903.4 |
6903.4 |
7136.56 |
3.4% |
3.4% |
|
S&P 500 |
2673.6 |
2673.6 |
2743.15 |
2.6% |
2.6% |
| Canada |
S&P/TSX Comp. |
16209.1 |
16209.1 |
16349.44 |
0.9% |
0.9% |
| Mexico |
Bolsa |
49354.4 |
49354.4 |
49887.7 |
1.1% |
1.1% |
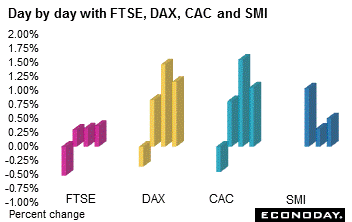 After a hesitant start, equities rallied for three days. The continuing global rally helped markets extend their gains after the Dow reached a new record high on Thursday and Asian markets turned in a strong performance as well. For the holiday shortened week, the FTSE was up 0.5 percent, the SMI added 1.9 percent and the CAC and DAX gained 3.0 percent and 3.1 percent respectively. European shares had their best week since last April Friday, with the British and Swiss indexes hitting records, propelled by optimism about a strengthening regional economy and fresh new highs in the U.S. Analysts are now saying that there is little to impede continued gains as economic conditions that currently exist over the last few months continue. After a hesitant start, equities rallied for three days. The continuing global rally helped markets extend their gains after the Dow reached a new record high on Thursday and Asian markets turned in a strong performance as well. For the holiday shortened week, the FTSE was up 0.5 percent, the SMI added 1.9 percent and the CAC and DAX gained 3.0 percent and 3.1 percent respectively. European shares had their best week since last April Friday, with the British and Swiss indexes hitting records, propelled by optimism about a strengthening regional economy and fresh new highs in the U.S. Analysts are now saying that there is little to impede continued gains as economic conditions that currently exist over the last few months continue.
Solid economic data contributed to the positive mood among investors. The Eurozone private sector expanded the most since early 2011. The larger than expected increase in U.S. private sector employment as measured by ADP gave investors reason to be confident prior to the release of the U.S. December employment report. In Germany, retail sales surprisingly jumped while unemployment declined sending the unemployment rate in December to a record low of 5.5 percent. In the UK, data was mixed with the services and composite PMIs gaining but the manufacturing PMI slipping.
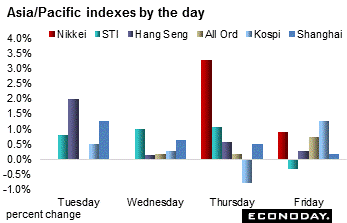 The gains in equity indexes last week were especially impressive for a four day week. Equities climbed as more investors exhibited optimism towards growth — especially in Japan and China. The main impetus came from the plethora of positive purchasing managers' indexes. They all indicated growth and boosted morale. Though Japan's markets were open only two days, the Nikkei soared 4.2 percent for the week while the Topix was 3.5 percent higher. The Nikkei is at its highest level in 26 years. The gains in equity indexes last week were especially impressive for a four day week. Equities climbed as more investors exhibited optimism towards growth — especially in Japan and China. The main impetus came from the plethora of positive purchasing managers' indexes. They all indicated growth and boosted morale. Though Japan's markets were open only two days, the Nikkei soared 4.2 percent for the week while the Topix was 3.5 percent higher. The Nikkei is at its highest level in 26 years.
The Shanghai Composite was up 2.6 percent while the Hang Seng climbed 3.0 percent higher. And the Sensex hit a fresh record high Friday thanks to the rally in global markets and optimism about growth.
Economic data in Japan over the holiday period were good by and large. The stronger global economy along with domestic political stability and the Bank of Japan's ultra-easy monetary policy are underpinning Japanese corporate earnings. The vigorous start to 2018 hints investors are anticipating a repeat of 2017's gains for Asian stocks. In Japan, household spending and retail sales advanced as did industrial production. The composite PMI was unchanged but services slipped. China's PMI readings were mixed while in Australia, the trade deficit widened.
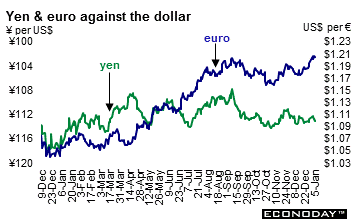 The U.S. dollar continued to weaken in the first week of January. The currency declined against all of its major counterparts excluding the yen. It was lower against the euro, pound sterling, Swiss franc and the Canadian and Australian dollars. Even though the labor market remains strong despite Friday's lower than anticipated employment gain, the dollar continues to look soft. Some analysts attribute to the weak currency to the very low U.S. long term bond yields even though the Federal Reserve has increased interest rates. Expectations are that inflation will remain tepid given the anemic wage increases that have occurred so far. The U.S. dollar is not the only currency that is retreating in value — the yen has declined as well. The yen tends to be a funding currency for investments in higher-yielding assets. The U.S. dollar continued to weaken in the first week of January. The currency declined against all of its major counterparts excluding the yen. It was lower against the euro, pound sterling, Swiss franc and the Canadian and Australian dollars. Even though the labor market remains strong despite Friday's lower than anticipated employment gain, the dollar continues to look soft. Some analysts attribute to the weak currency to the very low U.S. long term bond yields even though the Federal Reserve has increased interest rates. Expectations are that inflation will remain tepid given the anemic wage increases that have occurred so far. The U.S. dollar is not the only currency that is retreating in value — the yen has declined as well. The yen tends to be a funding currency for investments in higher-yielding assets.
|
|
2017 |
2017-2018 |
% Change |
|
|
Dec 29 |
Dec 29 |
Jan 5 |
Week |
2018 |
| U.S. $ per currency |
|
|
|
|
|
|
| Australia |
A$ |
0.779 |
0.779 |
0.787 |
1.0% |
1.0% |
| New Zealand |
NZ$ |
0.709 |
0.709 |
0.718 |
1.3% |
1.3% |
| Canada |
C$ |
0.796 |
0.796 |
0.806 |
1.3% |
1.3% |
| Eurozone |
euro (€) |
1.194 |
1.194 |
1.204 |
0.8% |
0.8% |
| UK |
pound sterling (£) |
1.344 |
1.344 |
1.357 |
0.9% |
0.9% |
|
|
|
|
|
|
|
| Currency per U.S. $ |
|
|
|
|
|
|
| China |
yuan |
6.534 |
6.534 |
6.489 |
0.7% |
0.7% |
| Hong Kong |
HK$* |
7.816 |
7.816 |
7.819 |
0.0% |
0.0% |
| India |
rupee |
64.081 |
64.081 |
63.374 |
1.1% |
1.1% |
| Japan |
yen |
112.850 |
112.850 |
113.120 |
-0.2% |
-0.2% |
| Malaysia |
ringgit |
4.067 |
4.067 |
3.998 |
1.7% |
1.7% |
| Singapore |
Singapore $ |
1.338 |
1.338 |
1.326 |
0.9% |
0.9% |
| South Korea |
won |
1070.630 |
1070.630 |
1062.660 |
0.8% |
0.8% |
| Taiwan |
Taiwan $ |
29.775 |
29.775 |
29.495 |
0.9% |
0.9% |
| Thailand |
baht |
32.696 |
32.696 |
32.176 |
1.6% |
1.6% |
| Switzerland |
Swiss franc |
0.979 |
0.9785 |
0.975 |
0.3% |
0.3% |
| *Pegged to U.S. dollar |
|
|
|
|
|
|
| Source: Bloomberg |
|
|
|
|
|
|
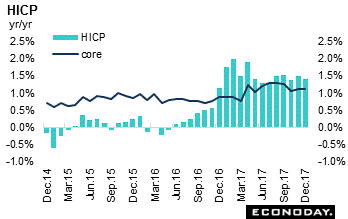 December flash harmonized index of consumer prices was up 1.4 percent on the year, down from November's 1.5 percent. Core HICP rates held steady at their respective mid-quarter levels. The narrowest measure, which excludes energy, food, alcohol and tobacco, remained at a 0.9 percent annual rate while omitting just energy and unprocessed food the rate was stable at 1.1 percent. Both measures have now been flat for three consecutive months. Inflation in the key services area was similarly unchanged at 1.2 percent while non-energy industrial goods edged a tick firmer to 0.5 percent, a 3-month high. Food, alcohol and tobacco recorded a 2.1 percent rate, down from 2.2 percent and energy 3.0 percent after 4.7 percent. December flash harmonized index of consumer prices was up 1.4 percent on the year, down from November's 1.5 percent. Core HICP rates held steady at their respective mid-quarter levels. The narrowest measure, which excludes energy, food, alcohol and tobacco, remained at a 0.9 percent annual rate while omitting just energy and unprocessed food the rate was stable at 1.1 percent. Both measures have now been flat for three consecutive months. Inflation in the key services area was similarly unchanged at 1.2 percent while non-energy industrial goods edged a tick firmer to 0.5 percent, a 3-month high. Food, alcohol and tobacco recorded a 2.1 percent rate, down from 2.2 percent and energy 3.0 percent after 4.7 percent.
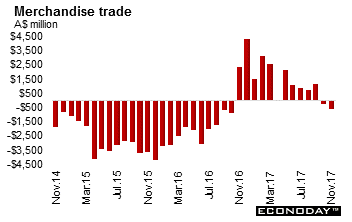 November trade balance deteriorated to a deficit of A$928 million from a negatively revised deficit of A$302 million in October (revised from a surplus of A$105 million). The move into deficit over the last two months followed eleven consecutive months of trade surpluses. Exports were up a monthly 0.4 percent while imports were up 1.5 percent. Although there was solid growth in exports of non-rural goods (around 60 percent of total exports) and services (around 20 percent), as well as a more moderate increase in exports of rural goods (around 15 percent), these gains were largely offset by a sharp decline in exports of non-monetary gold. On the year, total exports slowed from an increase of 10.1 percent in October to a fall of 0.7 percent. Imports of consumption goods, intermediate and other merchandise goods, capital goods, and services increased but were offset by a decline in imports of non-monetary gold. Total imports increased 9.4 percent on the year, up from an increase of 7.6 percent in October. November trade balance deteriorated to a deficit of A$928 million from a negatively revised deficit of A$302 million in October (revised from a surplus of A$105 million). The move into deficit over the last two months followed eleven consecutive months of trade surpluses. Exports were up a monthly 0.4 percent while imports were up 1.5 percent. Although there was solid growth in exports of non-rural goods (around 60 percent of total exports) and services (around 20 percent), as well as a more moderate increase in exports of rural goods (around 15 percent), these gains were largely offset by a sharp decline in exports of non-monetary gold. On the year, total exports slowed from an increase of 10.1 percent in October to a fall of 0.7 percent. Imports of consumption goods, intermediate and other merchandise goods, capital goods, and services increased but were offset by a decline in imports of non-monetary gold. Total imports increased 9.4 percent on the year, up from an increase of 7.6 percent in October.
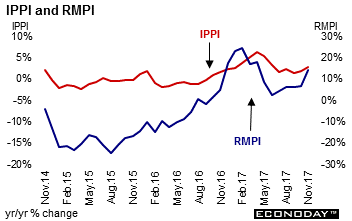 November industrial product price index was up a monthly 1.4 percent. It was the largest gain since February 2015. Excluding the impact of the 1.3 percent depreciation of the Canadian dollar against its U.S. counterpart, on average over the month, the IPPI would have been up 1.1 percent instead of 1.4 percent. Of the 21 major commodity groups in the IPPI, 16 were up, 4 were down and 1 was unchanged. The increase was mainly attributable to higher prices for energy and petroleum products. On the year, the IPPI rose 2.7 percent following a 1.7 percent gain in October. Compared with a year ago, the increase in the IPPI was largely due to higher prices for energy and petroleum products. The IPPI excluding energy and petroleum products rose 0.4 percent on the month. The raw materials price index (RMPI) rose 5.5 percent, primarily due to higher prices for crude energy products. In the RMPI, prices in all six major commodity groups increased compared on the month. The increase in the RMPI was mainly due to higher prices for crude energy products. On the year, the RMPI rose 14.2 percent following a 6.6 percent gain in October. November industrial product price index was up a monthly 1.4 percent. It was the largest gain since February 2015. Excluding the impact of the 1.3 percent depreciation of the Canadian dollar against its U.S. counterpart, on average over the month, the IPPI would have been up 1.1 percent instead of 1.4 percent. Of the 21 major commodity groups in the IPPI, 16 were up, 4 were down and 1 was unchanged. The increase was mainly attributable to higher prices for energy and petroleum products. On the year, the IPPI rose 2.7 percent following a 1.7 percent gain in October. Compared with a year ago, the increase in the IPPI was largely due to higher prices for energy and petroleum products. The IPPI excluding energy and petroleum products rose 0.4 percent on the month. The raw materials price index (RMPI) rose 5.5 percent, primarily due to higher prices for crude energy products. In the RMPI, prices in all six major commodity groups increased compared on the month. The increase in the RMPI was mainly due to higher prices for crude energy products. On the year, the RMPI rose 14.2 percent following a 6.6 percent gain in October.
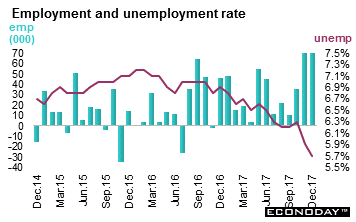 December employment jumped 78,600 after increasing 79,500 in November. For the year 2017 employment was up 422,500 for the largest expansion since 2002 with most of the gains in full time employment. At the same time, the unemployment rate declined from 5.9 percent to 5.7 percent — the lowest since January 1976. The participation rate climbed to 65.8 percent from 65.7 percent. The employment increase was concentrated in part-time jobs which were up 55,000. The largest employment gains in December were in Quebec and Alberta, while there were smaller increases in Nova Scotia, Saskatchewan, New Brunswick and Prince Edward Island. Employment increased in finance, insurance, real estate, rental and leasing following three months of little change. Employment was up in educational services for a second month. December employment jumped 78,600 after increasing 79,500 in November. For the year 2017 employment was up 422,500 for the largest expansion since 2002 with most of the gains in full time employment. At the same time, the unemployment rate declined from 5.9 percent to 5.7 percent — the lowest since January 1976. The participation rate climbed to 65.8 percent from 65.7 percent. The employment increase was concentrated in part-time jobs which were up 55,000. The largest employment gains in December were in Quebec and Alberta, while there were smaller increases in Nova Scotia, Saskatchewan, New Brunswick and Prince Edward Island. Employment increased in finance, insurance, real estate, rental and leasing following three months of little change. Employment was up in educational services for a second month.
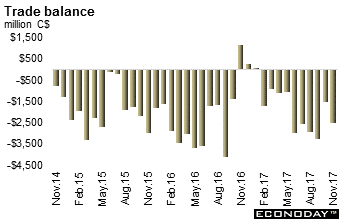 November merchandise trade deficit widened to C$2.5 billion from a deficit of C$1.6 billion as imports rose faster than exports. Monthly exports jumped 3.7 percent but imports climbed even faster at 5.8 percent. Exports were led by motor vehicles and parts, which were up 14.6 percent for the largest gain since March 2015. Volumes rose 13.4 percent. Elsewhere, consumer goods were up 7.4 percent thanks to a rise in pharmaceutical products, mainly to Italy. The surplus with the United States was nearly unchanged at C$3.3 billion but well down from C$4.7 billion a year earlier. Exports were up in eight of 11 sections. There was a widespread increase in imports — the strongest since July of 2009, occurring in 10 of the 11 sections. Volumes were up 5.0 percent and prices rose 0.7 percent. After two consecutive monthly decreases, imports of motor vehicles and parts rose 5.4 percent following planned shutdowns as well as work stoppages in September and October. November merchandise trade deficit widened to C$2.5 billion from a deficit of C$1.6 billion as imports rose faster than exports. Monthly exports jumped 3.7 percent but imports climbed even faster at 5.8 percent. Exports were led by motor vehicles and parts, which were up 14.6 percent for the largest gain since March 2015. Volumes rose 13.4 percent. Elsewhere, consumer goods were up 7.4 percent thanks to a rise in pharmaceutical products, mainly to Italy. The surplus with the United States was nearly unchanged at C$3.3 billion but well down from C$4.7 billion a year earlier. Exports were up in eight of 11 sections. There was a widespread increase in imports — the strongest since July of 2009, occurring in 10 of the 11 sections. Volumes were up 5.0 percent and prices rose 0.7 percent. After two consecutive monthly decreases, imports of motor vehicles and parts rose 5.4 percent following planned shutdowns as well as work stoppages in September and October.
Equities rallied in the first week of the year. There were no central bank meetings during the holiday-shortened week. Economic data for the most part was positive globally. Japan's end of month data saw both household spending and retail sales increasing.
Data in the coming week focuses on merchandise trade balances and industrial production. Germany releases its important manufacturing orders and industrial production data along with its merchandise trade surplus. China begins to post its monthly data with December consumer and producer prices and merchandise trade balance. Australia posts retail sales for December as well.
| Central Bank activities |
|
| Jan 11 |
Eurozone |
European Central Bank Minutes |
| |
|
|
| The following indicators will be released this week... |
| Europe |
|
|
| Jan 8 |
Eurozone |
EC Consumer & Business Sentiment (December) |
|
|
Retail Sales (November) |
|
Germany |
Manufacturing Orders (November) |
| Jan 9 |
Eurozone |
Unemployment (November) |
|
Germany |
Merchandise Trade (November) |
|
|
Industrial Production (November) |
|
France |
Merchandise Trade (November) |
| Jan 10 |
France |
Industrial Production (November) |
|
UK |
Industrial Production (November) |
|
|
Merchandise Trade (November) |
| Jan 11 |
Eurozone |
Industrial Production (November) |
| |
|
|
| Asia Pacific |
|
|
| Jan 8 |
China |
Merchandise Trade (December) |
| Jan 9 |
China |
Consumer Price Index (December) |
|
|
Producer Price Index (December) |
| Jan 11 |
Australia |
Retail Sales (November) |
| Jan 12 |
India |
Consumer Price Index (December) |
| |
|
|
| Americas |
|
|
| Jan 9 |
Canada |
Housing Starts (December) |
Anne D Picker is the author of International Economic Indicators and Central Banks.
|
