|
No more than modest growth fills February's personal income and spending data which overshadows an important update on a lurking issue for the financial markets: wage growth. Yet the report's overall inflation measures were soft as was consumer spending where weakness, together with a deepening trade deficit, may spell immediate trouble for first-quarter GDP.
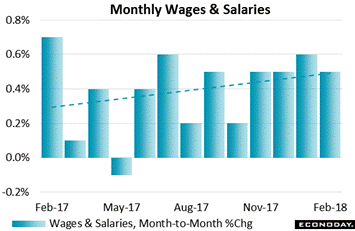 Wages & salaries are the strongest news in the income and spending report, up 0.5 percent in February vs a 0.6 percent gain in January and two other 0.5 percent gains in December and November. The trend line has moved from 0.3 percent monthly gains over the past year to the 0.5 percent level. This measure includes all forms of compensation including employer contributions to medical insurance and pensions and has been showing more life than average hourly earnings, which is part of the monthly employment report and is the most closely watched of all wage measures. Average hourly earnings have shown only sporadic pressure the past six months though the consistent strength of the wages & salaries data should make a new uptick for the earnings measure no surprise. Wages & salaries are the strongest news in the income and spending report, up 0.5 percent in February vs a 0.6 percent gain in January and two other 0.5 percent gains in December and November. The trend line has moved from 0.3 percent monthly gains over the past year to the 0.5 percent level. This measure includes all forms of compensation including employer contributions to medical insurance and pensions and has been showing more life than average hourly earnings, which is part of the monthly employment report and is the most closely watched of all wage measures. Average hourly earnings have shown only sporadic pressure the past six months though the consistent strength of the wages & salaries data should make a new uptick for the earnings measure no surprise.
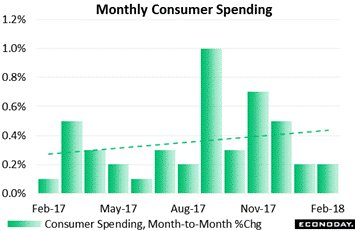 February's rise in income, however, didn't give much boost to consumer spending. Back-to-back monthly showings of only 0.2 percent are the weakest since last spring and if it wasn't for September's giant 1.0 percent spike, the result of hurricane replacement for vehicles, the trend line could well be flat. March spending will have to prove very strong to offset the weakness of January and February and provide support for first-quarter GDP. Inflation data in the income and spending report were also decidedly soft with only a 0.2 percent monthly gain for the core PCE price index though the yearly rate did inch forward 1 tenth to 1.6 percent. This may only be a little bit closer to the Fed's 2 percent target but it's moving in the right direction. February's rise in income, however, didn't give much boost to consumer spending. Back-to-back monthly showings of only 0.2 percent are the weakest since last spring and if it wasn't for September's giant 1.0 percent spike, the result of hurricane replacement for vehicles, the trend line could well be flat. March spending will have to prove very strong to offset the weakness of January and February and provide support for first-quarter GDP. Inflation data in the income and spending report were also decidedly soft with only a 0.2 percent monthly gain for the core PCE price index though the yearly rate did inch forward 1 tenth to 1.6 percent. This may only be a little bit closer to the Fed's 2 percent target but it's moving in the right direction.
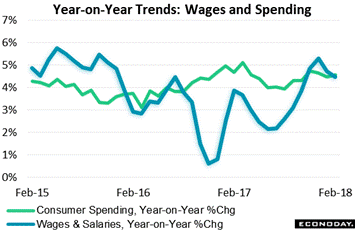 It was the year-on-year rate of average hourly earnings in December, which spiked to 2.9 percent, that back in January arguably triggered the ongoing wobble in the stock market. The yearly rate for wages & salaries, like that for average hourly earnings, peaked in December's data at 5.3 percent but has since eased to 4.5 percent in February. Yet the acceleration over the last year, from under 1 percent, has been impressive. Spending growth has been steady all along, peaking briefly over 5 percent early last year and coming in at 4.6 percent in February. But if the upward curve for wages & salaries is any indication, acceleration for consumer spending may be in store. It was the year-on-year rate of average hourly earnings in December, which spiked to 2.9 percent, that back in January arguably triggered the ongoing wobble in the stock market. The yearly rate for wages & salaries, like that for average hourly earnings, peaked in December's data at 5.3 percent but has since eased to 4.5 percent in February. Yet the acceleration over the last year, from under 1 percent, has been impressive. Spending growth has been steady all along, peaking briefly over 5 percent early last year and coming in at 4.6 percent in February. But if the upward curve for wages & salaries is any indication, acceleration for consumer spending may be in store.
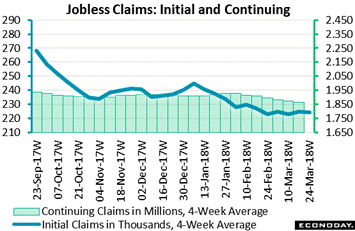 Wage growth and its relation to labor demand have been elusive this expansion. When and if they begin to accelerate is still unknown. The national unemployment rate, at 4.1 percent in February's employment report, is well under what the Fed had previously defined as full employment and well past what should have been a scarcity-related spike in wages. The quarterly FOMC forecasts see the unemployment rate falling to 3.8 percent this year and hitting a low at 3.6 percent next year, and these forecasts look reasonable based on the latest unemployment claims. At a 4-week average of 224,500, initial claims (blue line in graph) are at 45-year lows as are continuing claims (green columns) where the 4-week average is 1.862 million. And talking about unemployment rates, the rate for insured workers is also at record lows, at 1.3 percent the past four weeks. Wage growth and its relation to labor demand have been elusive this expansion. When and if they begin to accelerate is still unknown. The national unemployment rate, at 4.1 percent in February's employment report, is well under what the Fed had previously defined as full employment and well past what should have been a scarcity-related spike in wages. The quarterly FOMC forecasts see the unemployment rate falling to 3.8 percent this year and hitting a low at 3.6 percent next year, and these forecasts look reasonable based on the latest unemployment claims. At a 4-week average of 224,500, initial claims (blue line in graph) are at 45-year lows as are continuing claims (green columns) where the 4-week average is 1.862 million. And talking about unemployment rates, the rate for insured workers is also at record lows, at 1.3 percent the past four weeks.
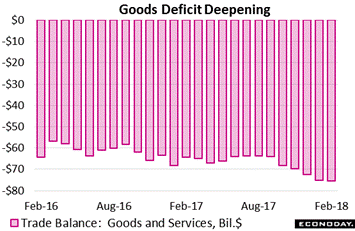 But however strong the March employment report may prove, it won't be offsetting the weakness in consumer spending nor the deepening in the trade deficit. International trade looks to be a major negative for first-quarter GDP following the week's goods data, coming in at a whopping $75.4 billion in February vs $75.3 billion in January. For comparison, the goods deficit in the third quarter averaged $70.1 billion per month which is an enormous outflow of dollars and which made for a deeply negative contribution, at minus 1.2 percent for total trade, to the fourth quarter's 2.9 percent GDP rate. Trimming the goods gap could have the single most positive impact on GDP. But however strong the March employment report may prove, it won't be offsetting the weakness in consumer spending nor the deepening in the trade deficit. International trade looks to be a major negative for first-quarter GDP following the week's goods data, coming in at a whopping $75.4 billion in February vs $75.3 billion in January. For comparison, the goods deficit in the third quarter averaged $70.1 billion per month which is an enormous outflow of dollars and which made for a deeply negative contribution, at minus 1.2 percent for total trade, to the fourth quarter's 2.9 percent GDP rate. Trimming the goods gap could have the single most positive impact on GDP.
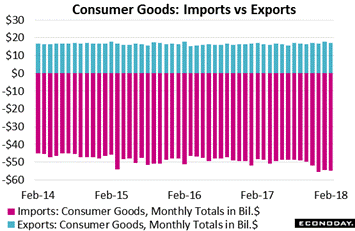 The most serious of the nation's shortfall is in consumer goods where monthly exports have been unable to approach the $20 billion line at the same time that imports keep expanding, to a $54.7 billion level in February that makes last year's deficits look tame. For the month of February alone, the nation's net deficit in consumer trade totaled $37.5 billion. Turning back to questions of inflation, much of this deepening is related to the depreciation of the dollar which is making foreign goods more expensive to domestic buyers. Note that the Trump administration's efforts to impose import tariffs fall in line with the downturn in the dollar, both of which make imports less affordable. The less imports, the higher GDP. The most serious of the nation's shortfall is in consumer goods where monthly exports have been unable to approach the $20 billion line at the same time that imports keep expanding, to a $54.7 billion level in February that makes last year's deficits look tame. For the month of February alone, the nation's net deficit in consumer trade totaled $37.5 billion. Turning back to questions of inflation, much of this deepening is related to the depreciation of the dollar which is making foreign goods more expensive to domestic buyers. Note that the Trump administration's efforts to impose import tariffs fall in line with the downturn in the dollar, both of which make imports less affordable. The less imports, the higher GDP.
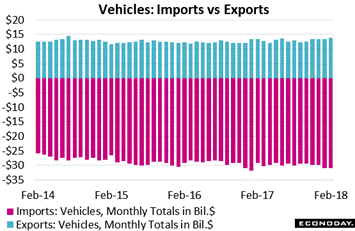 Vehicle imports are another trade component to keep an eye on. Imports on this score totaled $30.9 billion in both January and February and once again are deeper than prior months. But exports here are showing some life, rising to $13.9 billion in a good result. Still the nation's net vehicle deficit came to $17.0 billion in February and together with the consumer goods deficit make trade an uphill battle for first-quarter GDP. For comparison, the nation's oil deficit, which has been infamously negative for generations, totaled only $13.2 billion in the latest data which for this reading is January. Vehicle imports are another trade component to keep an eye on. Imports on this score totaled $30.9 billion in both January and February and once again are deeper than prior months. But exports here are showing some life, rising to $13.9 billion in a good result. Still the nation's net vehicle deficit came to $17.0 billion in February and together with the consumer goods deficit make trade an uphill battle for first-quarter GDP. For comparison, the nation's oil deficit, which has been infamously negative for generations, totaled only $13.2 billion in the latest data which for this reading is January.
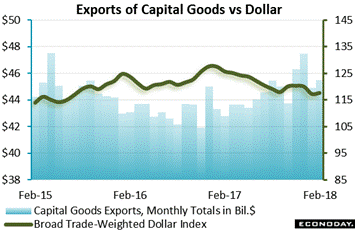 But the U.S. is not without its trade strength and that is focused in capital goods, whether heavy equipment for construction or machinery for manufacturers. Export totals for capital goods have been trending higher the past year from a monthly low near $42 billion in late 2016 to a high over $47 billion in December last year. Yet the showings for January and February have been disappointing, at $44.9 billion and $45.5 billion respectively. Yet here the dollar is a plus as exports tend to rise as the dollar moves down. And the direction for the dollar is definitely down, falling roughly 10 percent in 2017 and down about 2.5 percent so far this year which, if extended through the year, would match last year's depreciation. But the U.S. is not without its trade strength and that is focused in capital goods, whether heavy equipment for construction or machinery for manufacturers. Export totals for capital goods have been trending higher the past year from a monthly low near $42 billion in late 2016 to a high over $47 billion in December last year. Yet the showings for January and February have been disappointing, at $44.9 billion and $45.5 billion respectively. Yet here the dollar is a plus as exports tend to rise as the dollar moves down. And the direction for the dollar is definitely down, falling roughly 10 percent in 2017 and down about 2.5 percent so far this year which, if extended through the year, would match last year's depreciation.
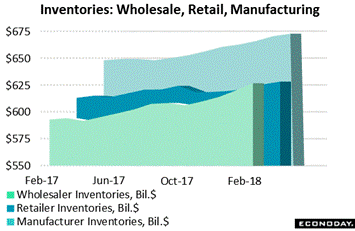 But there will be offsets to the first-quarter trade deficit, if not consumer spending which looks flat then perhaps business fixed investment, based on a recent jump in capital-goods orders, or perhaps residential investment where housing starts are moving up. And one component which is gaining healthy steam is inventory growth, rising solidly to a $627 billion total for wholesalers and $628 billion for retailers. Manufacturer inventories are yet to be posted though indications from durable inventories are positive. Inventory growth slowed last year which pulled down fourth-quarter GDP by 0.5 percentage points yet this quarter's acceleration, which is a response to the prior quarter's slowing, looks to make a solid contribution. Balanced inventory growth at times of solid demand are positives not only for production but also for employment as businesses hire hands to restock. But there will be offsets to the first-quarter trade deficit, if not consumer spending which looks flat then perhaps business fixed investment, based on a recent jump in capital-goods orders, or perhaps residential investment where housing starts are moving up. And one component which is gaining healthy steam is inventory growth, rising solidly to a $627 billion total for wholesalers and $628 billion for retailers. Manufacturer inventories are yet to be posted though indications from durable inventories are positive. Inventory growth slowed last year which pulled down fourth-quarter GDP by 0.5 percentage points yet this quarter's acceleration, which is a response to the prior quarter's slowing, looks to make a solid contribution. Balanced inventory growth at times of solid demand are positives not only for production but also for employment as businesses hire hands to restock.
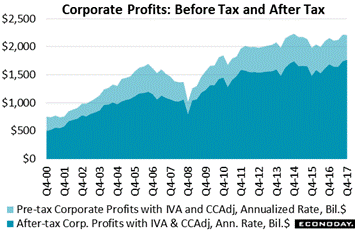 Corporate profit data look to get close scrutiny as the effects of this year's big tax cut play out. But these data are slow to come out with the fourth quarter now finally reported. Pre-tax corporate profits, which in this reading include inventory and capital consumption adjustments, came in at a $2.213 trillion annualized rate, which is $446 billion above the after-tax rate of $1.767 billion. Presumably as 2018 data come in, this margin will begin to narrow and begin pinching the separation of the two areas in the graph. Profit growth has been flat this expansion, showing only a 10 percent rise from the $2 trillion pretax level back in 2011 and roughly the same proportions for aftertax as well. But when it comes to profits, the stock market takes its day-to-day turns not on this set of long-range data but on immediate changes in company forecasts and anaylst estimates. And it was a good week for what has been a very bumpy year for the Dow, rising 2.4 percent to trim its year-to-date loss to 2.5 percent. Corporate profit data look to get close scrutiny as the effects of this year's big tax cut play out. But these data are slow to come out with the fourth quarter now finally reported. Pre-tax corporate profits, which in this reading include inventory and capital consumption adjustments, came in at a $2.213 trillion annualized rate, which is $446 billion above the after-tax rate of $1.767 billion. Presumably as 2018 data come in, this margin will begin to narrow and begin pinching the separation of the two areas in the graph. Profit growth has been flat this expansion, showing only a 10 percent rise from the $2 trillion pretax level back in 2011 and roughly the same proportions for aftertax as well. But when it comes to profits, the stock market takes its day-to-day turns not on this set of long-range data but on immediate changes in company forecasts and anaylst estimates. And it was a good week for what has been a very bumpy year for the Dow, rising 2.4 percent to trim its year-to-date loss to 2.5 percent.
| Markets at a Glance |
Year-End |
Week Ended |
Week Ended |
Year-To-Date |
Weekly |
|
2017 |
23-Mar-18 |
30-Mar-18 |
Change |
Change |
| DJIA |
24,719.22 |
23,533.20 |
24,103.11 |
-2.5% |
2.4% |
| S&P 500 |
2,673.61 |
2,588.26 |
2,640.87 |
-1.2% |
2.0% |
| Nasdaq Composite |
6,903.39 |
6,992.67 |
7,063.44 |
2.3% |
1.0% |
|
|
|
|
|
|
| Crude Oil, WTI ($/barrel) |
$60.15 |
$65.91 |
$64.94 |
8.0% |
-1.5% |
| Gold (COMEX) ($/ounce) |
$1,305.50 |
$1,352.30 |
$1,329.70 |
1.9% |
-1.7% |
|
|
|
|
|
|
| Fed Funds Target |
1.25 to 1.50% |
1.50 to 1.75% |
1.50 to 1.75% |
25 bp |
25 bp |
| 2-Year Treasury Yield |
1.89% |
2.27% |
2.27% |
38 bp |
0 bp |
| 10-Year Treasury Yield |
2.41% |
2.81% |
2.74% |
33 bp |
−7 bp |
| Dollar Index |
92.29 |
89.48 |
90.07 |
-2.4% |
0.7% |
It was the risk of inflation, specifically wage inflation, that toppled the market earlier this year and it has been a subsequent run of soft inflation numbers that has helped the market to recover. But there is no easing in the basic economic elements pointing to an increase in inflation, that is strength in employment and risk of accelerating strength for wages. A strong employment report looks likely for March and throw in the effects of a falling dollar and rising tariffs not to mention the stimulative impact of tax cuts, and an increase in the pace of inflation should at least take no one by surprise.
A busy week topped by the employment report starts off with close looks at two sectors that have been posting outstanding payroll growth: manufacturing and construction. The week kicks off with the March final for the manufacturing PMI followed by ISM's manufacturing index which, in what would be rare form, is expected to hold the 60 level. Construction spending is also out on Monday and improvement here is the call. Tuesday's news will be unit auto sales and the first hard indication on consumer spending during March with Wednesday's focus on March updates out of the service sector including the ISM non-manufacturing index which itself has been flirting with a 60 score. The trade deficit will dominate Thursday's calendar and may raise questions over the strength of first-quarter GDP, leading to Friday's employment report where moderate readings for payrolls and wages are the expectations despite what is expected to be a downtick in the unemployment rate to 4.0 percent.
PMI Manufacturing for March, Final
Consensus Forecast: 55.7
Consensus Range: 55.7 to 55.7
The PMI manufacturing index is expected to come in at a final of 55.7 in March, unchanged from the mid-month flash and down slightly from February. Though orders and employment have been strong, this report has been running cooler than the ISM manufacturing index.
ISM Manufacturing Index for March
Consensus Forecast: 60.0
Consensus Range: 58.8 to 61.0
March's consensus for the ISM manufacturing index is 60.0 vs 60.8 in February, a month that marked a 14-year high and which easily beat Econoday's top-end forecast. New orders and backlog orders have been rising sharply in this sample and capacity stress is evident with deliveries lengthening sharply and input prices going up.
Construction Spending for February
Consensus Forecast, Month-to-Month Change: 0.5%
Consensus Range: -0.1% to 0.8%
After an unchanged result in January, construction spending is expected to bounce 0.5 percent higher in February. Residential spending has been posting respectable gains but has been offset by subpar results for nonresidential construction.
Total Unit Vehicle Sales for March
Consensus Forecast, Annualized Rate: 17.0 million
Consensus Range: 16.8 to 17.2 million
Vehicle sales have been very soft in recent months and more of the same is expected for March. Forecasters see unit sales slipping to a 17.0 million annualized rate from February's 17.2 million in a result that would point to a fourth straight month of weakness for the retail sales report.
ADP, Private Payrolls for March
Consensus Forecast: 180,000
Consensus Range: 110,000 to 225,000
Employment reports have proven to be strong and strong has been the recent calls from ADP. But the consensus for March's ADP estimate is looking for slowing, to 180,000 vs 235,000 and 234,000 for ADP in February and January.
PMI Services for March, Final
Consensus Forecast: 54.1
Consensus Range: 54.1 to 54.9
PMI services moved lower in the flash for March and are expected to hold at the 54.1 result for the final reading. Despite the slowing, orders and employment were strong with price pressures also evident.
Factory Orders for February
Consensus Forecast, Month-to-Month Change: 1.7%
Consensus Range: 1.3% to 1.9%
The durable goods report for February showed impressive strength especially for capital goods orders. Total factory orders for February are expected to rise a very solid 1.7 percent and offset a 1.4 percent downswing in January that was skewed lower by aircraft orders.
ISM Non-Manufacturing Index for March
Consensus Forecast: 59.0
Consensus Range: 57.0 to 59.7
The ISM non-manufacturing index toyed with the 60 level in January and February but, at a consensus 59.0, isn't expected to breakthrough in March. Yet order readings, whether for new orders or export orders or backlogs, have all been building and look certain to support business activity and employment in the March report.
International Trade Balance for February
Consensus Forecast: -$56.8 billion
Consensus Range: -$57.6 to -$55.5 billion
The international trade deficit for goods and services is expected to widen slightly in February to $56.8 billion which would be in line with a deepening in the month's goods deficit (already reported). Exports may be solid in the February report but look to be offset by a further rise for imports.
Initial Jobless Claims for March 31 week
Consensus Forecast: 226,000
Consensus Range: 222,000 to 230,000
Initial claims are expected to come in at 226,000 in the March 31 week vs a 45-year low of 215,000 in the prior week. Claims have been low and consistent with liminal layoffs and strong demand for labor.
Nonfarm Payrolls for March
Consensus Forecast: 167,000
Consensus Range: 115,000 to 215,000
Unemployment Rate
Consensus Forecast: 4.0%
Consensus Range: 3.9% to 4.1%
Private Payrolls
Consensus Forecast: 170,000
Consensus Range: 110,000 to 212,000
Manufacturing Payrolls
Consensus Forecast: 22,000
Consensus Range: 12,000 to 25,000
Participation Rate
Consensus Forecast: 62.8%
Consensus Range: 62.8% to 62.8%
Average Hourly Earnings
Consensus Forecast, Month-to-Month Change: 0.2%
Consensus Range: 0.1% to 0.3%
Average Hourly Earnings
Consensus Forecast, Year-on-Year Change: 2.7%
Consensus Range: 2.7% to 2.8%
Average Workweek
Consensus Forecast: 34.5 hours
Consensus Range: 34.5 to 34.5 hours
After two months of standout strength, cooling is Econoday's consensus for March nonfarm payrolls which are nevertheless seen rising a very respectable 167,000. And movement is the call for the unemployment rate which is expected to fall 1 tenth further to 4.0 percent which would increasingly point to full employment and the risk of wage inflation. Yet wages aren't expected to rock March's report with the monthly consensus for average hourly earnings at only 0.2 percent growth though the yearly rate is seen moving up a tick to 2.7 percent. Private payrolls are expected to rise 170,000 with manufacturing payrolls expected to increase 22,000. The workweek is seen unchanged at 34.5 hours and the labor participation rate, which jumped in February, expected to come back 2 tenths to 62.8 percent.
Consumer Credit for February
Consensus Forecast: $15.0 billion
Consensus Range: $11.7 to $18.4 billion
Another increase in consumer credit is the call for February, at a consensus $15.0 billion vs $13.9 billion in January. Credit card use had been on the rise but not in January's report as the revolving component showed only a small increase.
|
