|
Rarely are employment reports ever as healthy as they are in the Labor Department's June edition, a perfection achieved right as the drums of a reciprocal trade war are getting louder. Like the summer of 1914, economies were strong and people were working and vacationing all at the same time that an inevitable motion, a mechanical tit for tat between the great powers, was to plunge the world into inconceivable doom. But let's look on the bright side instead. Americans have jobs and are joining the workforce, inflation is steady and contained, the trade gap is narrowing, and all this against a backdrop of strong business and consumer confidence.
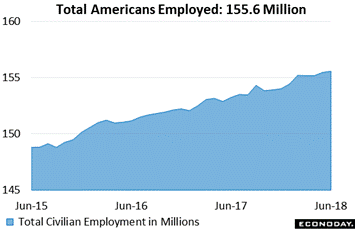 Total civilian employment, that includes those on payrolls and also those who work for themselves. has been very solid as tracked in the accompanying graph. Since June 2015, total employment has risen 6.8 million to 155.6 million in June this year. More than 2.3 million jobs have been created since June last year and 1.5 million have been created so far this year. Total civilian employment, that includes those on payrolls and also those who work for themselves. has been very solid as tracked in the accompanying graph. Since June 2015, total employment has risen 6.8 million to 155.6 million in June this year. More than 2.3 million jobs have been created since June last year and 1.5 million have been created so far this year.
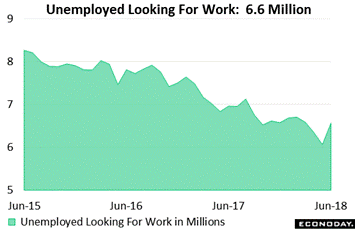 These employment gains have been pulling down the number of those actively seeking work. Back in June 2015, this reading was 8.3 million and is now at 6.6 million which is up, however, from a deep low of 6.1 million in May. But the monthly rise in June is actually good news not bad news! The increase suggests that discouraged workers and others at the margin moved into the labor force in June to once again begin looking for a job. That speaks to confidence in the outlook and strong word-of-mouth that jobs can be had. This rise in the number of unemployed, again a good thing not a bad thing, is what is behind a 2 tenths rise in the unemployment rate to 4.0 percent which is still very low and also behind a 2 tenths rise in the labor participation rate to 62.9 percent. It's the idea of greater participation in the labor force that's key. It's this combination of employed and unemployed that makes for the Labor Department's total count of the labor force, at 162.1 million in June. These employment gains have been pulling down the number of those actively seeking work. Back in June 2015, this reading was 8.3 million and is now at 6.6 million which is up, however, from a deep low of 6.1 million in May. But the monthly rise in June is actually good news not bad news! The increase suggests that discouraged workers and others at the margin moved into the labor force in June to once again begin looking for a job. That speaks to confidence in the outlook and strong word-of-mouth that jobs can be had. This rise in the number of unemployed, again a good thing not a bad thing, is what is behind a 2 tenths rise in the unemployment rate to 4.0 percent which is still very low and also behind a 2 tenths rise in the labor participation rate to 62.9 percent. It's the idea of greater participation in the labor force that's key. It's this combination of employed and unemployed that makes for the Labor Department's total count of the labor force, at 162.1 million in June.
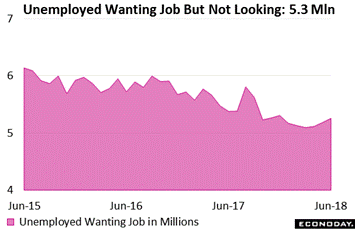 But there's the risk that job growth is too strong and could very well drain the number of unemployed looking for work. This in theory would pose concerns of capacity stress leading to wage inflation. But there is another body of possible workers which is outside the civilian labor force that the Labor Department also tracks, and that's those who say they want a job but aren't yet pounding the pavement. This group rose solidly to 5.3 million in June and looks increasingly likely to shift into the workforce as more and more actively begin to look for a job. This is the group that Fed Chair Jerome Powell is targeting, in his stated intent to bring more people on board. This number together with the unemployed makes up the pool of available labor which edged up to 11.8 million in June. But there's the risk that job growth is too strong and could very well drain the number of unemployed looking for work. This in theory would pose concerns of capacity stress leading to wage inflation. But there is another body of possible workers which is outside the civilian labor force that the Labor Department also tracks, and that's those who say they want a job but aren't yet pounding the pavement. This group rose solidly to 5.3 million in June and looks increasingly likely to shift into the workforce as more and more actively begin to look for a job. This is the group that Fed Chair Jerome Powell is targeting, in his stated intent to bring more people on board. This number together with the unemployed makes up the pool of available labor which edged up to 11.8 million in June.
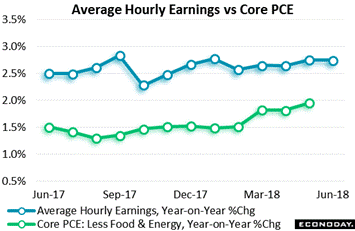 What makes the rise in the number of those looking for work so important is that it offers employers more choices of candidates and it also eases the risk of overheating. Average hourly earnings, which is the measure of wage inflation in the employment report, has been very tame, holding at 2.7 percent in June and, as seen in the blue line of the graph, showing very little acceleration if any over the last year. This is a key part of the perfection of June's report. Wages feed into overall inflation and the flat line isn't a major threat to FOMC policy makers who now have more freedom in monetary policy, facing less risk from wages and perhaps extending out their rate-hike path in what is very good news for the stock market. The green line in the graph is the core consumer price index which is the highlight of the coming week's calendar. What makes the rise in the number of those looking for work so important is that it offers employers more choices of candidates and it also eases the risk of overheating. Average hourly earnings, which is the measure of wage inflation in the employment report, has been very tame, holding at 2.7 percent in June and, as seen in the blue line of the graph, showing very little acceleration if any over the last year. This is a key part of the perfection of June's report. Wages feed into overall inflation and the flat line isn't a major threat to FOMC policy makers who now have more freedom in monetary policy, facing less risk from wages and perhaps extending out their rate-hike path in what is very good news for the stock market. The green line in the graph is the core consumer price index which is the highlight of the coming week's calendar.
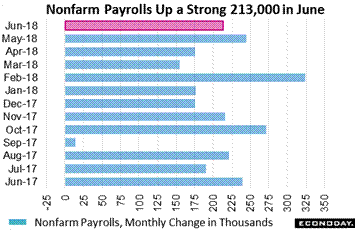 The final perfection in June's report is payrolls, a count that excludes the self-employed. Nonfarm payrolls rose 213,000 in June following a 244,000 rise in May. June's gain was led by a 50,000 rise in professional & business services as businesses, contending with bustling conditions, turned to contractors as they try to keep up. The temporary help sub-component for this reading rose a sharp 9,000 to underscore the strength in immediate demand for labor. The final perfection in June's report is payrolls, a count that excludes the self-employed. Nonfarm payrolls rose 213,000 in June following a 244,000 rise in May. June's gain was led by a 50,000 rise in professional & business services as businesses, contending with bustling conditions, turned to contractors as they try to keep up. The temporary help sub-component for this reading rose a sharp 9,000 to underscore the strength in immediate demand for labor.
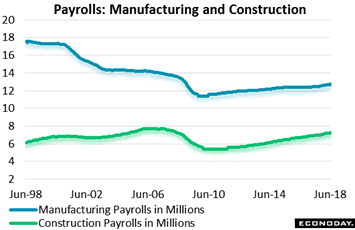 Also headlining the payroll results is manufacturing where 36,000 jobs were added. Yet at 12.7 million in June, manufacturing jobs are up less than 300,000 over the last year and are up only 100,000 so far this year. But the gain comes against a secular down pull for manufacturing payrolls as seen in the blue line of the graph. Unfortunately unique, manufacturing suffered an offshore evaporation that made for outright declines in the prior expansion ending in 2009, after which payrolls have been rising but ever so slowly. The green line is construction payrolls which were also positive in June, up 13,000 for a third straight strong gain. Unlike manufacturing, offshoring is less of a risk for construction jobs. Also headlining the payroll results is manufacturing where 36,000 jobs were added. Yet at 12.7 million in June, manufacturing jobs are up less than 300,000 over the last year and are up only 100,000 so far this year. But the gain comes against a secular down pull for manufacturing payrolls as seen in the blue line of the graph. Unfortunately unique, manufacturing suffered an offshore evaporation that made for outright declines in the prior expansion ending in 2009, after which payrolls have been rising but ever so slowly. The green line is construction payrolls which were also positive in June, up 13,000 for a third straight strong gain. Unlike manufacturing, offshoring is less of a risk for construction jobs.
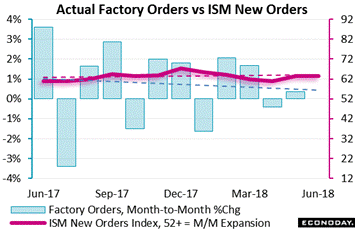 Manufacturing payrolls in the employment report offered the first definitive signs of acceleration for the sector which appeared about this time last year. The latest data for factory orders, which closes the book on May, were positive though modest, a 0.4 percent gain overall as tracked in the blue columns. This included a good showing for capital goods and a nice build in total backlogs where steel and aluminum orders, reflecting the impact of import tariffs, are piling up. The red line in the graph is an early look at what to expect for June with the ISM new orders index which has been trending a bit more favorably that actual orders. The results are very positive. Manufacturing payrolls in the employment report offered the first definitive signs of acceleration for the sector which appeared about this time last year. The latest data for factory orders, which closes the book on May, were positive though modest, a 0.4 percent gain overall as tracked in the blue columns. This included a good showing for capital goods and a nice build in total backlogs where steel and aluminum orders, reflecting the impact of import tariffs, are piling up. The red line in the graph is an early look at what to expect for June with the ISM new orders index which has been trending a bit more favorably that actual orders. The results are very positive.
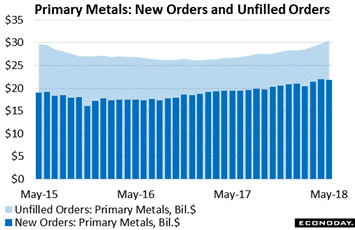 Perhaps the biggest positive in the factory orders report is a fourth straight strong build for unfilled orders, up 0.5 percent in June. The more backlogs pile up, the more manufacturers will be in need of new workers. This is a very promising sign for future growth in manufacturing payrolls. Making an outsized contribution in unfilled orders is a sharp build underway for primary metals which were first hit by import tariffs in March, the month when pre-buying picked up pace. Total unfilled orders come to $1.161 trillion with unfilled orders for primary metals, the light blue area of the graph, rising sharply to $30.5 billion. Primary metals make up only 2.6 percent of factory orders yet they represent 8.7 percent of the $23 billion build in total unfilled orders since February. Perhaps the biggest positive in the factory orders report is a fourth straight strong build for unfilled orders, up 0.5 percent in June. The more backlogs pile up, the more manufacturers will be in need of new workers. This is a very promising sign for future growth in manufacturing payrolls. Making an outsized contribution in unfilled orders is a sharp build underway for primary metals which were first hit by import tariffs in March, the month when pre-buying picked up pace. Total unfilled orders come to $1.161 trillion with unfilled orders for primary metals, the light blue area of the graph, rising sharply to $30.5 billion. Primary metals make up only 2.6 percent of factory orders yet they represent 8.7 percent of the $23 billion build in total unfilled orders since February.
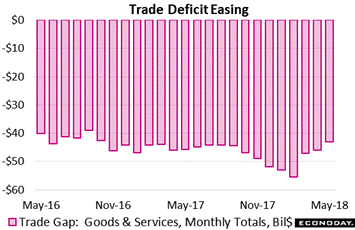
International trade was another favorable set of data in the week as the nation's trade gap narrowed sharply in May, to $43.1 billion from $46.1 billion in April. This is the lowest monthly deficit since October 2016. Exports jumped 1.9 percent to $215.3 billion to well exceed a 0.4 percent rise in imports which totaled $258.4 billion. Exports of goods were very strong, up 2.6 percent to $144.9 billion with imports up 0.5 percent to $210.7 billion. Exports of capital goods including aircraft showed special strength as did exports of food. Exports of services rose 0.6 percent to $70.4 billion with imports of services down 0.1 percent to $47.7 billion. China's trade surplus with the United States (something of increasing urgency) was $33.2 billion in May and $152.2 billion year-to-date, up 13.5 percent from the same period last year. This report is very positive for second-quarter GDP and also underscores the strength of cross-border trade -- especially increasing demand for U.S. goods & services -- going into what appears to be a period blow-for-blow tariff exchanges.
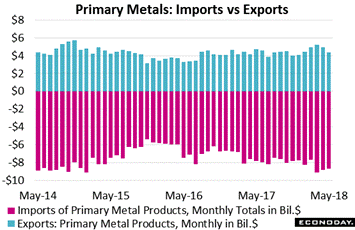 Steel and aluminum were of course the first tariff battlefields and the early results show a spike followed by an easing in imports and a slump for related exports. Imports of primary steel totaled $8.6 billion in May as tracked in the red columns of the graph which, compared to February, is up from $7.6 billion but well down from an initial $9.1 billion spike in March. Exports of primary metals were at $4.9 billion in March and have since fallen to $4.4 billion. Our narrow focus on metals, however, will be a thing of the past given the wide array of products that are just now subject to increasing foreign tarrifs and the equally wide array of foreign products in addition to primary metals that the U.S. is now targeting. Steel and aluminum were of course the first tariff battlefields and the early results show a spike followed by an easing in imports and a slump for related exports. Imports of primary steel totaled $8.6 billion in May as tracked in the red columns of the graph which, compared to February, is up from $7.6 billion but well down from an initial $9.1 billion spike in March. Exports of primary metals were at $4.9 billion in March and have since fallen to $4.4 billion. Our narrow focus on metals, however, will be a thing of the past given the wide array of products that are just now subject to increasing foreign tarrifs and the equally wide array of foreign products in addition to primary metals that the U.S. is now targeting.
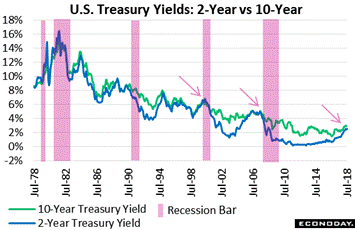 Ever so slowly the noose is tightening is a grim metaphor for the incremental approach of the 2-year Treasury yield, now at 2.53 percent, and the 10-year yield, now at 2.81 percent. This spread is now trying to hold inside the 30-basis-point zone in a trend that points to a test of the 20-basis-point area in the coming weeks or months. When these yields meet, as evidenced in the graph, recessions often appear. Why? The rise in the short-term rate is tied to Fed increases in its overnight target rate. And the Fed's gradual path of rate hikes is pointing to only one direction for the 2-year yield and that is up. In contrast, the 10-year yield is less subject to the effect of changes in short rates and is a popular safe-haven investment for investors, whether domestic or global, who want to sit back in security as the vicissitudes of a trade war, or possible trade war, play out. Ever so slowly the noose is tightening is a grim metaphor for the incremental approach of the 2-year Treasury yield, now at 2.53 percent, and the 10-year yield, now at 2.81 percent. This spread is now trying to hold inside the 30-basis-point zone in a trend that points to a test of the 20-basis-point area in the coming weeks or months. When these yields meet, as evidenced in the graph, recessions often appear. Why? The rise in the short-term rate is tied to Fed increases in its overnight target rate. And the Fed's gradual path of rate hikes is pointing to only one direction for the 2-year yield and that is up. In contrast, the 10-year yield is less subject to the effect of changes in short rates and is a popular safe-haven investment for investors, whether domestic or global, who want to sit back in security as the vicissitudes of a trade war, or possible trade war, play out.
| Markets at a Glance |
Year-End |
Week Ended |
Week Ended |
Year-To-Date |
Weekly |
|
2017 |
29-Jun-18 |
6-Jul-18 |
Change |
Change |
| DJIA |
24,719.22 |
24,271.41 |
24,456.48 |
-1.1% |
0.8% |
| S&P 500 |
2,673.61 |
2,718.37 |
2,759.82 |
3.2% |
1.5% |
| Nasdaq Composite |
6,903.39 |
7,510.30 |
7,688.39 |
11.4% |
2.4% |
|
|
|
|
|
|
| Crude Oil, WTI ($/barrel) |
$60.15 |
$74.35 |
$73.78 |
22.7% |
-0.8% |
| Gold (COMEX) ($/ounce) |
$1,305.50 |
$1,252.90 |
$1,256.00 |
-3.8% |
0.2% |
|
|
|
|
|
|
| Fed Funds Target |
1.25 to 1.50% |
1.75 to 2.00% |
1.75 to 2.00% |
50 bp |
0 bp |
| 2-Year Treasury Yield |
1.89% |
2.52% |
2.53% |
64 bp |
1 bp |
| 10-Year Treasury Yield |
2.41% |
2.85% |
2.81% |
40 bp |
−4 bp |
| Dollar Index |
92.29 |
94.64 |
94.04 |
1.9% |
-0.6% |
If the summer of 2018 does in fact precede the beginning of an international trade war, we can look back at the economic data at the time: strong GDP, stable inflation, and unusual demand for labor. Are these trends likely to improve in a trade war or will they begin to deteriorate? Another outcome, perhaps a surprising one but still a real possibility, is that, given the enormous size of the U.S. economy, there will hardly be any discernible effects at all.
Inflation is the week's theme led off, not coincidentally, by an employment measure: the JOLTS report where job openings, in an unprecedented sign of labor market tightness, have been exceeding job applicants. Another rise for JOLTS, however flat wage growth may be, could still heat up inflation talk. Two inflation reports that have been showing clear pressure will also be released: producer prices on Wednesday and import & export prices on Friday with both having shown tariff effects. A key report that has not shown much pressure at all, however, will be released Wednesday and that is consumer prices. Another set of modest readings here, which is expected, could hold down rate-hike concerns. Rounding out the week will be consumer sentiment which will offer its own inflation gauge as well the latest on expectations and whether tariff concerns are growing at the consumer level.
Consumer Credit for May
Consensus Forecast: $12.4 billion
Consensus Range: $10.0 to $22.6 billion
A stronger rise is expected for consumer credit in May than in April, at a consensus $12.4 billion vs April's $9.3 billion. Revolving credit has been flat this year though April did see a slight $2.3 billion increase. For nonrevolving credit, strength in vehicle sales during May hints at a larger increase than April's $7.0 billion.
Small Business Optimism Index for June
Consensus Forecast: 106.0
Consensus Range: 105.0 to 107.2
The small business optimism index is expected to ease to in June vs May's 107.8 which was the second highest reading in 45 years of data. Strength in May was centered in sales expectations and the outlook for the economy.
JOLTS: Job Openings for June
Consensus Forecast: 6.700 million
Consensus Range: 6.660 to 6.725 million
Job openings have been providing one of the strongest signals of any indicator on the labor market's strength. Forecasters are calling for a 6.700 million total in June, little changed from May's record 6.698 million. For the first time in 20 years of available data, job openings are exceeding the number of unemployed actively looking for work.
PPI-FD for June
Consensus Forecast, Month-to-Month Change: 0.2%
Consensus Range: 0.1% to 0.3%
PPI-FD Less Food & Energy
Consensus Forecast, Month-to-Month Change: 0.2%
Consensus Range: 0.2% to 0.3%
PPI-FD Less Food, Energy, & Trade Services
Consensus Forecast, Month-to-Month Change: 0.2%
Consensus Range: 0.2% to 0.2%
Cooling to a 0.2 percent monthly increase is expected for the June producer price headline following a 0.5 percent surge in May that was fed by a jump for trade services (wholesalers and retailers) and included hikes for energy as well as steel and aluminum. When excluding food and energy prices are also expected to rise 0.2 percent which again is the consensus when excluding food, energy and trade services.
Wholesale Inventories for May
Consensus Forecast, Month-to-Month Change: 0.5%
Consensus Range: 0.3% to 0.6%
Wholesale inventories are expected to rise 0.5 percent in May in line with the reading in the advance report posted late last month. Inventories have been low relative to sales.
Consumer Price Index for June
Consensus Forecast, Month-to-Month Change: 0.2%
Consensus Range: 0.0% to 0.2%
Consumer Price Index
Consensus Forecast, Year-on-Year Change: 2.9%
Consensus Range: 2.7% to 2.9%
CPI Core, Less Food & Energy
Consensus Forecast, Month-to-Month Change: 0.2%
Consensus Range: 0.2% to 0.3%
CPI Core, Less Food & Energy
Consensus Forecast, Year-on-Year Change: 2.2%
Consensus Range: 2.2% to 2.3%
Inflation may be showing pressure in the producer and import price reports, but pass through to the consumer has been limited. Forecasters are calling for no more than modest pressure in the consumer price report for June, at a headline monthly gain of 0.2 percent and a core rate increase of also 0.2 percent. Little change is expected for year-on-year rates which are expected to increase 1 tenth overall to 2.8 percent and remain unchanged for core at 2.2 percent.
Initial Jobless Claims for July 7 week
Consensus Forecast: 225,000
Consensus Range: 215,000 to 226,000
Initial claims are expected to come in at 225,000 in the July 7 week vs 231,000 in the prior week. All readings in this report are at or near historic lows and consistent with strong demand for labor.
Treasury Budget for June
Consensus Forecast: -$91.0 billion
Consensus Range: -$173.9 billion to -$80.0 billion
After this year's tax, corporate taxes are contributing less to the receipt ledger while individual taxes are contributing more. Excise taxes and customs duties are also on the rise. Still the Treasury's year-to-date deficit in May was running 23 percent deeper than the prior fiscal year as spending on net interest, defense and Social Security continue to rise. For June, forecasters see the monthly Treasury deficit at $91.0 billion.
Import Prices for June
Consensus Forecast, Month-to-Month Change: 0.2%
Consensus Range: -0.2% to 0.4%
Export Prices
Consensus Forecast, Month-to-Month Change: 0.3%
Consensus Range: 0.1% to 0.3%
Cross-border price pressures have been very heated, rising 0.6 percent for both import prices and export prices the past two reports. Oil-related pressures have been apparent in both with import prices also reflecting higher tariffs for steel and aluminum. But the June consensus calls for cooling, at a 0.2 percent gain for import prices and a 0.3 percent gain for export prices.
Consumer Sentiment Index, Preliminary July
Consensus Forecast: 98.2
Consensus Range: 97.0 to 99.0
Easing expectations, perhaps tied to tariff concerns, have been holding back the consumer sentiment index which nevertheless ended June at a solid 98.2 as the assessment of current conditions proved very strong. Forecasters are calling for no change, at 98.2 for the preliminary reading in July.
|
