|
Simply Economics will be taking the next week off. Next publication will be August 17, 2018
The Federal Reserve turned up the rate-hike heat exactly one notch in the week, upgrading both economic activity and household spending from the solid to the strong camp. This sets up another rate hike at the September FOMC and does nothing to cut back their plans for a subsequent hike between then and year end (however unpopular that could prove to be in some quarters). But the Fed's timing will ultimately be decided by incoming data which, in the latest week, were perhaps less in the strong and more in the solid camp.
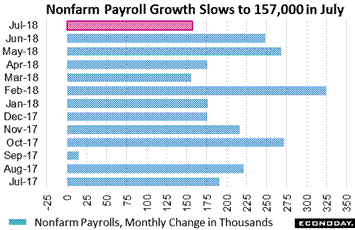 Nonfarm payrolls came in at a very respectable 157,000 in July which was, however, at the low end of Econoday's consensus range and down significantly from upward revised growth of 248,000 and 268,000 in the two prior months. Yet slowing may be a welcome development given the risk that economic activity may be pressing up against capacity limits. July marks the slowest start to a quarter since fourth-quarter 2016 and compares with consistent averages of 230,000, 218,000 and 221,000 in the prior three quarters. Nonfarm payrolls came in at a very respectable 157,000 in July which was, however, at the low end of Econoday's consensus range and down significantly from upward revised growth of 248,000 and 268,000 in the two prior months. Yet slowing may be a welcome development given the risk that economic activity may be pressing up against capacity limits. July marks the slowest start to a quarter since fourth-quarter 2016 and compares with consistent averages of 230,000, 218,000 and 221,000 in the prior three quarters.
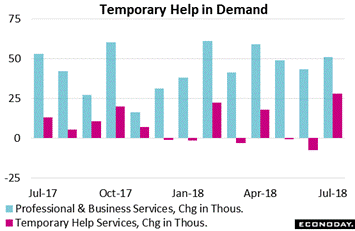 Capacity limits have been strikingly evident in the run of regional and private reports on the economy where backlog accumulation, delivery delays, cost run-ups, and cost pass through to customers have been at record levels this year. Limits are also hinted at in July's payroll breakdown as temporary help services jumped 28,000 as tracked in the red columns of the graph. This is a very strong gain that indicates employers, stacked up with orders and backlogs, are scrambling to meet demand. The increase in temporary help is the largest in more than two years and is among the very highest of the expansion. Temporary help in the Labor Department data is a sub-component of professional & business services which, as tracked in the blue columns, are also up and also hint at lack of available labor, that businesses aren't filling slots and instead are turning to contractors. Capacity limits have been strikingly evident in the run of regional and private reports on the economy where backlog accumulation, delivery delays, cost run-ups, and cost pass through to customers have been at record levels this year. Limits are also hinted at in July's payroll breakdown as temporary help services jumped 28,000 as tracked in the red columns of the graph. This is a very strong gain that indicates employers, stacked up with orders and backlogs, are scrambling to meet demand. The increase in temporary help is the largest in more than two years and is among the very highest of the expansion. Temporary help in the Labor Department data is a sub-component of professional & business services which, as tracked in the blue columns, are also up and also hint at lack of available labor, that businesses aren't filling slots and instead are turning to contractors.
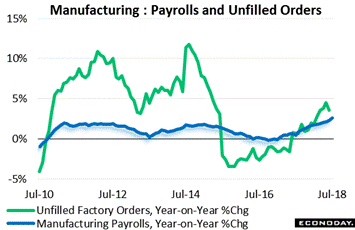 Also clearly in the strong camp are manufacturing payrolls, up 37,000 in July to more than double Econoday's consensus for the best showing of the year. Manufacturing payrolls in fact are showing their greatest strength, in year-on-year terms, since the early 1980s. The blue line of the graph tracks yearly change in manufacturing payrolls and July's 2.6 percent growth, which sounds modest, is actually the best since December 1984. The gain speaks to the benefits of this year's corporate tax cuts and arguably to the Trump administration's thematic focus on domestic manufacturing, where payrolls in the prior decade of offshoring contracted deeply. The green line of the graph tracks the rise underway in unfilled factory orders which, the more they build up, the more they point to the need for future hiring. Unfilled orders have posted five solid monthly gains in a row with this year-on-year rate, at 3.6 percent, just off its best showing in more than three years. Also clearly in the strong camp are manufacturing payrolls, up 37,000 in July to more than double Econoday's consensus for the best showing of the year. Manufacturing payrolls in fact are showing their greatest strength, in year-on-year terms, since the early 1980s. The blue line of the graph tracks yearly change in manufacturing payrolls and July's 2.6 percent growth, which sounds modest, is actually the best since December 1984. The gain speaks to the benefits of this year's corporate tax cuts and arguably to the Trump administration's thematic focus on domestic manufacturing, where payrolls in the prior decade of offshoring contracted deeply. The green line of the graph tracks the rise underway in unfilled factory orders which, the more they build up, the more they point to the need for future hiring. Unfilled orders have posted five solid monthly gains in a row with this year-on-year rate, at 3.6 percent, just off its best showing in more than three years.
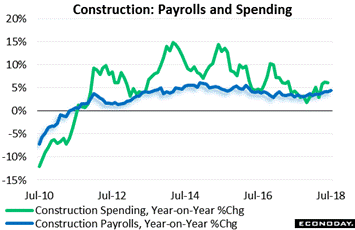 One sector that is solid and may be trying to move to strong is construction. Payrolls rose 19,000 in July which compared to July last year and tracked in the blue line is up 4.4 percent for the best growth since April 2016. The green line is construction spending which, though uneven this year, was up a yearly 6.1 percent in data for June. But judging by anecdotal comments coming out of the sector, future growth in construction payrolls is likely to be limited by what report after report warn is a lack of skilled workers to choose from. High material costs, now made higher by steel and aluminum tariffs, is another limiting factor, perhaps slowing activity and ultimately with it demand for labor. One sector that is solid and may be trying to move to strong is construction. Payrolls rose 19,000 in July which compared to July last year and tracked in the blue line is up 4.4 percent for the best growth since April 2016. The green line is construction spending which, though uneven this year, was up a yearly 6.1 percent in data for June. But judging by anecdotal comments coming out of the sector, future growth in construction payrolls is likely to be limited by what report after report warn is a lack of skilled workers to choose from. High material costs, now made higher by steel and aluminum tariffs, is another limiting factor, perhaps slowing activity and ultimately with it demand for labor.
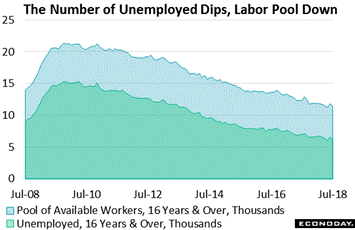 Let's focus back again on limitions in the labor market. The number of unemployed actively looking for a job fell back in July to 6.280 million from June's spurt to 6.564 million. That's 284,000 fewer prospects that employers can choose from. Throwing in the number of unemployed who want to work but aren't looking, the number moves to 11.443 million. This is defined as the pool of available workers and this number in July fell by 379,000. The Federal Reserve needs to see these numbers staying up, otherwise they would face the risk -- and certainly related talk -- of a sudden acceleration in wages. And make no mistake about it, employers are looking for employees like never before. Not only are jobless claims at historic lows but job openings are at historic highs, and at 6.638 million in June and, in a one-of-a-kind mismatch, above the number of people actively looking for work. Job openings are part of the JOLTS report which will be a data highlight of the coming week. Let's focus back again on limitions in the labor market. The number of unemployed actively looking for a job fell back in July to 6.280 million from June's spurt to 6.564 million. That's 284,000 fewer prospects that employers can choose from. Throwing in the number of unemployed who want to work but aren't looking, the number moves to 11.443 million. This is defined as the pool of available workers and this number in July fell by 379,000. The Federal Reserve needs to see these numbers staying up, otherwise they would face the risk -- and certainly related talk -- of a sudden acceleration in wages. And make no mistake about it, employers are looking for employees like never before. Not only are jobless claims at historic lows but job openings are at historic highs, and at 6.638 million in June and, in a one-of-a-kind mismatch, above the number of people actively looking for work. Job openings are part of the JOLTS report which will be a data highlight of the coming week.
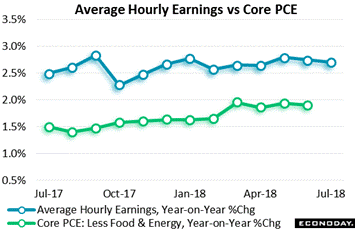 But the Fed isn't up against the inflation wall, at least yet. Wages showed only moderate pressure in July at a 0.3 percent montlhy gain that follows, however, only a 0.1 percent gain in June. The year-on-year rate, as tracked in the blue line of the graph, has been struggling at the 2.7 percent line and is showing no acceleration. This is actually ideal for the Federal Reserve as it works to keep inflation stable at its 2 percent goal. The progress on this goal is best tracked by the core PCE price index which excludes the volatile components of food and energy and, in another of the week's key indicators, is holding just below 2 percent which is really ideal for the Fed. But can these readings hold steady? Testing this stability would be a further upturn for the economy, which don't forget posted a 4.1 percent GDP rate in the second quarter and a 5.1 percent rate when excluding inventories. Note that average hourly earnings are the first inflation indicator for July while the core PCE is the final and definitive inflation indicator for June. But the Fed isn't up against the inflation wall, at least yet. Wages showed only moderate pressure in July at a 0.3 percent montlhy gain that follows, however, only a 0.1 percent gain in June. The year-on-year rate, as tracked in the blue line of the graph, has been struggling at the 2.7 percent line and is showing no acceleration. This is actually ideal for the Federal Reserve as it works to keep inflation stable at its 2 percent goal. The progress on this goal is best tracked by the core PCE price index which excludes the volatile components of food and energy and, in another of the week's key indicators, is holding just below 2 percent which is really ideal for the Fed. But can these readings hold steady? Testing this stability would be a further upturn for the economy, which don't forget posted a 4.1 percent GDP rate in the second quarter and a 5.1 percent rate when excluding inventories. Note that average hourly earnings are the first inflation indicator for July while the core PCE is the final and definitive inflation indicator for June.
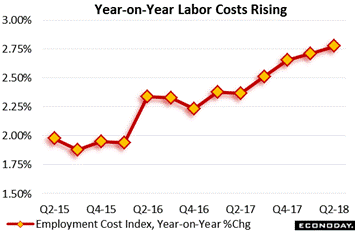 The flat direction of average hourly earnings contrasts with that of employer costs which keep rising, to a 2.8 percent year-on-year rate in the second quarter in what was another important highlight of the week. This is the highest rate since third-quarter 2008 and suggests that businesses are having to absorb higher labor costs. This effort is made easier by this year's corporate tax cut which, in theory, is giving employers more room to increase wages and attract new labor. Having eased back in prior quarters, benefits were once again ahead of wages & salaries when it comes to increasing employer costs. The flat direction of average hourly earnings contrasts with that of employer costs which keep rising, to a 2.8 percent year-on-year rate in the second quarter in what was another important highlight of the week. This is the highest rate since third-quarter 2008 and suggests that businesses are having to absorb higher labor costs. This effort is made easier by this year's corporate tax cut which, in theory, is giving employers more room to increase wages and attract new labor. Having eased back in prior quarters, benefits were once again ahead of wages & salaries when it comes to increasing employer costs.
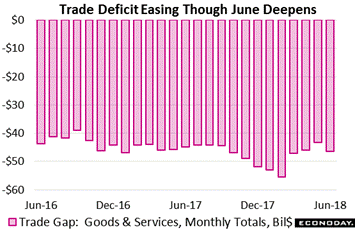 The week's data also include the latest trade figures which are favorable though still mixed. June's deficit came in deeper than expected, at $46.3 billion vs $43.1 billion in May. Exports in June sank 0.7 percent to $213.8 billion with a rise in service exports offset by a drop in goods exports where capital goods, vehicles and especially consumer goods posted declines. Imports, in special focus of course given the tariff situation, rose 0.6 percent to a monthly $260.2 billion with consumer goods, which is the glraring sore spot of the nation's deficit, rising a sharp $2.0 billion to $53.4 billion. Oil imports were also up, rising $1.2 billion to $14.1 billion. For those keeping score, country data show a deepening deficit with China, at $33.5 billion in June with the year-to-deficit 8.6 percent deeper at $185.7 billion. Other year-to-date deficits include an 11.0 percent deepening with Europe at $77.6 billion, a 5.5 percent deepening with Mexico at $38.0 billion, and a 23.4 percent improvement with Canada at $8.1 billion. The week's data also include the latest trade figures which are favorable though still mixed. June's deficit came in deeper than expected, at $46.3 billion vs $43.1 billion in May. Exports in June sank 0.7 percent to $213.8 billion with a rise in service exports offset by a drop in goods exports where capital goods, vehicles and especially consumer goods posted declines. Imports, in special focus of course given the tariff situation, rose 0.6 percent to a monthly $260.2 billion with consumer goods, which is the glraring sore spot of the nation's deficit, rising a sharp $2.0 billion to $53.4 billion. Oil imports were also up, rising $1.2 billion to $14.1 billion. For those keeping score, country data show a deepening deficit with China, at $33.5 billion in June with the year-to-deficit 8.6 percent deeper at $185.7 billion. Other year-to-date deficits include an 11.0 percent deepening with Europe at $77.6 billion, a 5.5 percent deepening with Mexico at $38.0 billion, and a 23.4 percent improvement with Canada at $8.1 billion.
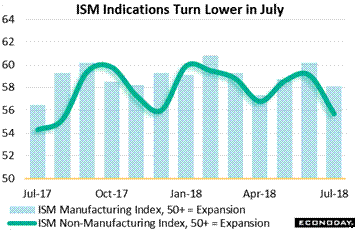 The week's data also include ISM's results for July which are both pointing to slowing. The ISM non-manufacturing index (green line) often beats expectations but not in July as the month's 55.7 score fell 3 points under Econoday's consensus and more than 2 points under the low estimate. Both new orders, down more than 5 points to 57.0, and backlog orders, down 5 points to 51.5, showed softening. The July headline for ISM's manufacturing index (blue columns) tells a similar story, down 2.1 points from June to 58.1 and right at the low end of expectations. New orders, including for exports, slowed as did backlogs at the same time that production eased. Risks of tariffs and high steel costs remain key concerns in both samples. The week's data also include ISM's results for July which are both pointing to slowing. The ISM non-manufacturing index (green line) often beats expectations but not in July as the month's 55.7 score fell 3 points under Econoday's consensus and more than 2 points under the low estimate. Both new orders, down more than 5 points to 57.0, and backlog orders, down 5 points to 51.5, showed softening. The July headline for ISM's manufacturing index (blue columns) tells a similar story, down 2.1 points from June to 58.1 and right at the low end of expectations. New orders, including for exports, slowed as did backlogs at the same time that production eased. Risks of tariffs and high steel costs remain key concerns in both samples.
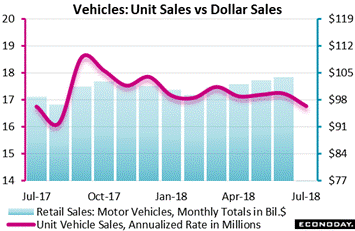 And perhaps the most telling indication of July slowing comes from the month's unit vehicle sales which, as tracked in the red line, slipped to a 16.8 million annualized rate from June's 17.2 million and was also near bottom end expectations. This is the lowest rate since August last year and is not consistent with the FOMC's upgrade to household spending. Dollar sales to consumers, tracked in the blue columns, were a useful contributor to retail sales reports throughout the second quarter but the unit results for July, though clouded by business sales which are excluded in the retail sales report, are nevertheless certain to pull down forecasts for July's retail sales report. Vehicle sales make up about one-fifth of total retail sales. And perhaps the most telling indication of July slowing comes from the month's unit vehicle sales which, as tracked in the red line, slipped to a 16.8 million annualized rate from June's 17.2 million and was also near bottom end expectations. This is the lowest rate since August last year and is not consistent with the FOMC's upgrade to household spending. Dollar sales to consumers, tracked in the blue columns, were a useful contributor to retail sales reports throughout the second quarter but the unit results for July, though clouded by business sales which are excluded in the retail sales report, are nevertheless certain to pull down forecasts for July's retail sales report. Vehicle sales make up about one-fifth of total retail sales.
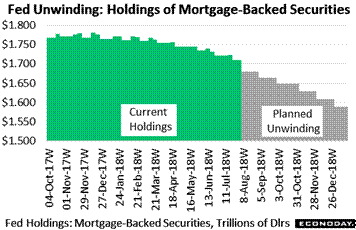 The average rate for fixed 30-year conforming mortgages ($453,100 or less) jumped 7 basis points to 4.84 percent in weekly data released by the Mortgage Bankers Association. This rate tracks the direction of the 10-year Treasury yield though the laws of supply and demand specific to the mortgage market still apply. And pointing to higher rates is what will about to be a giant lack of buying by the Federal Reserve. The Fed, as part of its balance sheet unwinding, has been letting its mortgage-backed holdings steadily decline as securities mature -- but they haven't been letting enough mature. In fact, the Fed is way behind schedule, holding $1.710 trillion as of the August 1 week against their own target of $1.680 trillion. That's $30 billion of buying that's overdue to disappear from the MBS market with another $24 billion to go by the end of August (that is if they can make their schedule). It will be interesting to see if mortgage rates show any effect -- if they do the effect is very likely to be upward which wouldn't be good news for home sales. When the Fed adopted its quantitative easing program to combat the Great Recession, the buying of mortgage-backed securities was controversial in that it supported a specific sector of the economy. As far as the unwinding of Treasuries, the Fed is doing a much better job of keeping pace, holding $2.337 trillion against a July-end target of $2.333 trillion. The average rate for fixed 30-year conforming mortgages ($453,100 or less) jumped 7 basis points to 4.84 percent in weekly data released by the Mortgage Bankers Association. This rate tracks the direction of the 10-year Treasury yield though the laws of supply and demand specific to the mortgage market still apply. And pointing to higher rates is what will about to be a giant lack of buying by the Federal Reserve. The Fed, as part of its balance sheet unwinding, has been letting its mortgage-backed holdings steadily decline as securities mature -- but they haven't been letting enough mature. In fact, the Fed is way behind schedule, holding $1.710 trillion as of the August 1 week against their own target of $1.680 trillion. That's $30 billion of buying that's overdue to disappear from the MBS market with another $24 billion to go by the end of August (that is if they can make their schedule). It will be interesting to see if mortgage rates show any effect -- if they do the effect is very likely to be upward which wouldn't be good news for home sales. When the Fed adopted its quantitative easing program to combat the Great Recession, the buying of mortgage-backed securities was controversial in that it supported a specific sector of the economy. As far as the unwinding of Treasuries, the Fed is doing a much better job of keeping pace, holding $2.337 trillion against a July-end target of $2.333 trillion.
| Markets at a Glance |
Year-End |
Week Ended |
Week Ended |
Year-To-Date |
Weekly |
|
2017 |
27-Jul-18 |
3-Aug-18 |
Change |
Change |
| DJIA |
24,719.22 |
25,451.06 |
25,462.58 |
3.0% |
0.0% |
| S&P 500 |
2,673.61 |
2,818.82 |
2,840.35 |
6.2% |
0.8% |
| Nasdaq Composite |
6,903.39 |
7,737.42 |
7,812.01 |
13.2% |
1.0% |
|
|
|
|
|
|
| Crude Oil, WTI ($/barrel) |
$60.15 |
$68.89 |
$68.82 |
14.4% |
-0.1% |
| Gold (COMEX) ($/ounce) |
$1,305.50 |
$1,232.20 |
$1,223.80 |
-6.3% |
-0.7% |
|
|
|
|
|
|
| Fed Funds Target |
1.25 to 1.50% |
1.75 to 2.00% |
1.75 to 2.00% |
50 bp |
0 bp |
| 2-Year Treasury Yield |
1.89% |
2.66% |
2.66% |
77 bp |
0 bp |
| 10-Year Treasury Yield |
2.41% |
2.96% |
2.96% |
55 bp |
0 bp |
| Dollar Index |
92.29 |
94.66 |
95.11 |
3.1% |
0.5% |
There are plenty of hot spots in the economy but also some soft ones as well, and it looks especially like July may be one of those. The economy may be taking a breather which, given what appear to be approaching limits on capacity, could prove a long-term plus for sustainability. With the Fed now describing the economy as strong, any less heat would at least keep rate-hike expectations from building any further.
Following last week's very heavy run, the coming week's calendar is light. JOLTS takes Tuesday's spotlight updating the number of job openings, which have been exceeding those looking for a job, and also the quits rate and how confident the labor force is to look for higher paying jobs. Inflation data follow on Thursday with producer prices, where pressures on services and metals have been appearing, followed on Friday with consumer prices which have remained remarkably stable. Also on Friday the Treasury's budget statement for July will be released offering the latest on what has been a sharply widening deficit.
JOLTS: Job Openings for June
Consensus Forecast: 6.650 million
Consensus Range: 6.600 to 6.750 million
The number of job openings has moved ahead of the number of unemployed for the first time on record. At a consensus 6.650 million, forecasters see job openings in June edging higher from May's total of 6.638 million. The quits rate of this report has also been moving higher, suggesting that workers are growing more confident and are on the hunt for higher pay.
Consumer Credit for June
Consensus Forecast: $16.0 billion
Consensus Range: $12.5 to $17.0 billion
A smaller increase of $16.0 billion is expected for consumer credit in June, after jumping $24.6 billion in May on a sudden spike in revolving credit. An increase in non-revolving credit, tied in part to auto financing, was also strong.
Initial Jobless Claims for August 4 week
Consensus Forecast: 220,000
Consensus Range: 216,000 to 225,000
Initial jobless claims are expected to come in at 220,000 in the August 11 week vs 218,000 in the prior week. All readings in this report are at or near historic lows and consistent with strong demand for labor.
PPI-FD for July
Consensus Forecast, Month-to-Month Change: 0.3%
Consensus Range: 0.1% to 0.3%
PPI-FD Less Food & Energy
Consensus Forecast, Month-to-Month Change: 0.3%
Consensus Range: 0.2% to 0.3%
PPI-FD Less Food, Energy, & Trade Services
Consensus Forecast, Month-to-Month Change: 0.2%
Consensus Range: 0.2% to 0.3%
Forecasters see steady, moderate pressure for the July producer price report which in June and May showed sharp increases at trade services (wholesalers and retailers) as well as tariff-related hikes for steel and aluminum. A 0.3 percent monthly increase is expected for the July producer price headline which would match June's rise. When excluding food and energy, prices are also expected to rise 0.3 percent while excluding food, energy and trade services, a 0.2 percent gain is expected.
Wholesale Inventories for June
Consensus Forecast, Month-to-Month Change: 0.0%
Consensus Range: 0.0% to 0.0%
Wholesale inventories are expected to come in unchanged in June, in line with the previously posted advance estimate.
Inventory levels have fallen behind demand and need to rise faster.
Consumer Price Index for July
Consensus Forecast, Month-to-Month Change: 0.2%
Consensus Range: 0.1% to 0.2%
Consumer Price Index
Consensus Forecast, Year-on-Year Change: 2.9%
Consensus Range: 2.9% to 3.0%
CPI Core, Less Food & Energy
Consensus Forecast, Month-to-Month Change: 0.2%
Consensus Range: 0.2% to 0.3%
CPI Core, Less Food & Energy
Consensus Forecast, Year-on-Year Change: 2.3%
Consensus Range: 2.2% to 2.5%
Businesses may be increasingly passing rising costs on to their customers, yet consumer prices have so far remained stable. Forecasters see the consumer price index rising a modest 0.2 percent in July following only a 0.1 percent increase in June. The consensus for the core rate (ex-food ex-energy) is also a 0.2 percent gain. Year-on-year rates for July are seen unchanged at 2.9 percent for the overall index and unchanged at 2.3 percent for the core.
Treasury Budget for July
Consensus Forecast: -$73.5 billion
Consensus Range: -$78.0 billion to $31.4 billion
Individual tax receipts are on the rise but so is spending. The last Treasury statement in June showed a $607.1 billion deficit nine months into the government's fiscal year, up significantly from a $523.1 billion a year ago. Econoday's consensus for the July statement is a monthly deficit of $73.5 billion with the high end estimate at a surplus of $31.4 billion.
|
