|
Sudden jumps in average hourly earnings always attract attention, as they did early this year when an initial 2.9 percent result in January raised expectations for Fed rate hikes and was immediately followed by the year's first shake-out in the financial markets. We got another 2.9 percent result for August and though the inflationary movement is limited, the direction is clearly upward. The Federal Reserve right now, facing strong economic growth and unfolding stimulus from tax cuts and increased government spending, wants to keep inflation right where it is. And the best way they know how to do that is to raise rates.
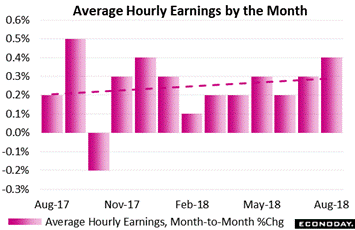 First let's look at the monthly rate for average hourly earnings. It came in at plus 0.4 percent in August which was outside expectations and one of the strongest monthly gains of the ongoing 9-year expansion. August's rate was last matched in December last year and only exceeded once in the last 10 years and that was last September when hurricane effects led to one-time dislocations and temporary labor shortages. August can be a difficult month for seasonal adjustments given timing issues surrounding the start of the school year but otherwise there are no obvious issues to explain away the monthly spike -- other then lack of available job candidates and the need to raise offers. First let's look at the monthly rate for average hourly earnings. It came in at plus 0.4 percent in August which was outside expectations and one of the strongest monthly gains of the ongoing 9-year expansion. August's rate was last matched in December last year and only exceeded once in the last 10 years and that was last September when hurricane effects led to one-time dislocations and temporary labor shortages. August can be a difficult month for seasonal adjustments given timing issues surrounding the start of the school year but otherwise there are no obvious issues to explain away the monthly spike -- other then lack of available job candidates and the need to raise offers.
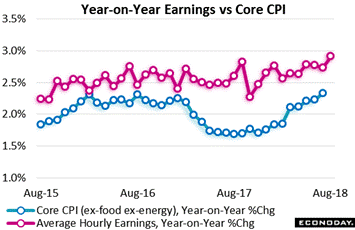 Now let's look at the year-on-year rate. The 2.9 percent showing is actually the strongest of the last nine years as this year's initial 2.9 percent for January has since been revised away. And a downward revision for August is of course always possible but not a downward revision to the whole upward swell of the data. This trend after all is not unfolding against a backdrop of greater abundance of available labor but against one of lesser abundance if not increasing scarcity of labor. Left on its own, the year-on-year trend for the red line of wages points to an increasing climb. This is definitely where the Fed comes in. The blue line of the graph tracks the next big update on inflation and that's the core CPI for August which will be posted on Thursday of the coming week. This slope is no less steep than hourly earnings though Econoday forecasters are not calling for a further gain in August, at a consensus 2.3 percent which would be unchanged from July. Now let's look at the year-on-year rate. The 2.9 percent showing is actually the strongest of the last nine years as this year's initial 2.9 percent for January has since been revised away. And a downward revision for August is of course always possible but not a downward revision to the whole upward swell of the data. This trend after all is not unfolding against a backdrop of greater abundance of available labor but against one of lesser abundance if not increasing scarcity of labor. Left on its own, the year-on-year trend for the red line of wages points to an increasing climb. This is definitely where the Fed comes in. The blue line of the graph tracks the next big update on inflation and that's the core CPI for August which will be posted on Thursday of the coming week. This slope is no less steep than hourly earnings though Econoday forecasters are not calling for a further gain in August, at a consensus 2.3 percent which would be unchanged from July.
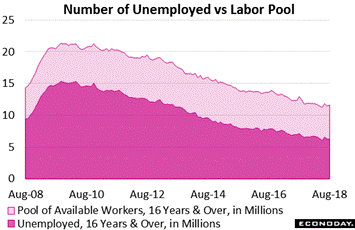 The gradual decline in labor supply is tracked in the accompanying graph: the dark area is those actively looking for work, numbering 6.234 million in August, with the light area adding in those who want a job but aren't looking, numbering 5.389 million and bringing the total, defined as the pool of available workers, to 11.623 million. These numbers have been steady the last few months as new entrants and discouraged workers move into the pool as people find work. But whether the inflow can continue to keep up with the need for hiring is the Federal Reserve's $64,000 question. The gradual decline in labor supply is tracked in the accompanying graph: the dark area is those actively looking for work, numbering 6.234 million in August, with the light area adding in those who want a job but aren't looking, numbering 5.389 million and bringing the total, defined as the pool of available workers, to 11.623 million. These numbers have been steady the last few months as new entrants and discouraged workers move into the pool as people find work. But whether the inflow can continue to keep up with the need for hiring is the Federal Reserve's $64,000 question.
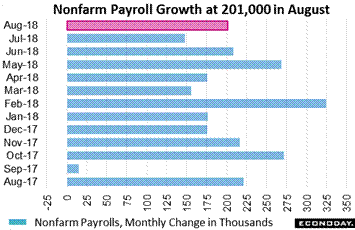 And nonfarm payroll hiring, at 201,000, proved very solid in August. The industry breakdown showed an unexpected 3,000 decline in manufacturing jobs that ends a long and very strong run. But construction payrolls, up 23,000, proved very solid as did mining, a much smaller industry which posted a sizable rise of 6,000. Other positives include a 37,000 rise in trade & transportation where capacity, in reaction to lengthening delivery times, is apparently expanding and a 53,000 rise in professional services that includes a 10,000 gain for temporary help, both evidence that employers are scrambling to get work done. As far as the Fed's work is concerned, their mandate to achieve strong levels of employment is a complete success; their second mandate to maintain price stability is a work in process. And nonfarm payroll hiring, at 201,000, proved very solid in August. The industry breakdown showed an unexpected 3,000 decline in manufacturing jobs that ends a long and very strong run. But construction payrolls, up 23,000, proved very solid as did mining, a much smaller industry which posted a sizable rise of 6,000. Other positives include a 37,000 rise in trade & transportation where capacity, in reaction to lengthening delivery times, is apparently expanding and a 53,000 rise in professional services that includes a 10,000 gain for temporary help, both evidence that employers are scrambling to get work done. As far as the Fed's work is concerned, their mandate to achieve strong levels of employment is a complete success; their second mandate to maintain price stability is a work in process.
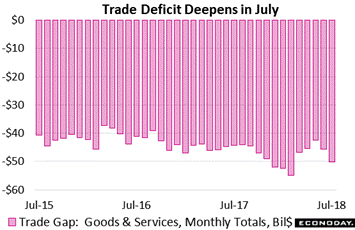 Overshadowing the emerging wage drama is the nation's trade stance as the Trump administration seeks concessions from China and others. The outcome from the early blows of this fight, including steel and aluminum tariffs and counter-tariffs from U.S. trading partners, is hard to discern in the economic data, at least so far. Net exports proved to be a very strong plus for second-quarter GDP but whether that extends to the third quarter is seriously in question. For July, the first month of the third quarter, the nation's trade deficit deepened sharply, to $50.1 billion vs a $44.6 billion monthly average in the second quarter. Net exports are going to be a major uphill battle for third-quarter GDP. Overshadowing the emerging wage drama is the nation's trade stance as the Trump administration seeks concessions from China and others. The outcome from the early blows of this fight, including steel and aluminum tariffs and counter-tariffs from U.S. trading partners, is hard to discern in the economic data, at least so far. Net exports proved to be a very strong plus for second-quarter GDP but whether that extends to the third quarter is seriously in question. For July, the first month of the third quarter, the nation's trade deficit deepened sharply, to $50.1 billion vs a $44.6 billion monthly average in the second quarter. Net exports are going to be a major uphill battle for third-quarter GDP.
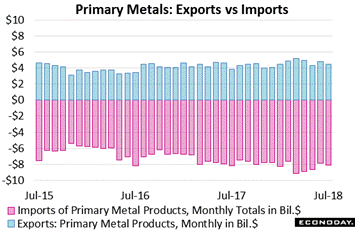 Heavy tariffs on aluminum and especially steel were imposed in March, triggering at first heavy knee-jerk imports of primary metals on scarcity concerns that totaled $9.2 billion in the month (red columns in graph). Import levels were also heavier than normal in April and May but have since fallen back to $8.2 billion in the latest data which are for July. Exports of primary metals have held roughly steady at under $5 billion per month. Other data on primary metals outside of trade are now generally slowing though unfilled orders and inventories continue to rise. Yet in contrast to the grumbling of discontent among the nation's businesses, metal tariffs have yet to produce any dislocations in the economic numbers. Heavy tariffs on aluminum and especially steel were imposed in March, triggering at first heavy knee-jerk imports of primary metals on scarcity concerns that totaled $9.2 billion in the month (red columns in graph). Import levels were also heavier than normal in April and May but have since fallen back to $8.2 billion in the latest data which are for July. Exports of primary metals have held roughly steady at under $5 billion per month. Other data on primary metals outside of trade are now generally slowing though unfilled orders and inventories continue to rise. Yet in contrast to the grumbling of discontent among the nation's businesses, metal tariffs have yet to produce any dislocations in the economic numbers.
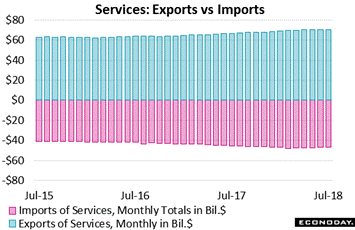 One key trade area for the U.S. that has so far escaped the spotlight is services where large surpluses, at $23.1 billion in July, have been helping to offset the nation's gapping deficit in goods, totaling $73.1 in July. Exports of services came to $70.3 billion in July against only $47.2 billion in service imports. The acceleration for service exports first heated up in the early part of the last expansion, just after 2001. Growth over this time has been centered in insurance services, financial services, telecom & information services, as well intellectual property. Should trade actions heat up even further, don't be surprised if China and others begin targeting U.S. services for retaliation. One key trade area for the U.S. that has so far escaped the spotlight is services where large surpluses, at $23.1 billion in July, have been helping to offset the nation's gapping deficit in goods, totaling $73.1 in July. Exports of services came to $70.3 billion in July against only $47.2 billion in service imports. The acceleration for service exports first heated up in the early part of the last expansion, just after 2001. Growth over this time has been centered in insurance services, financial services, telecom & information services, as well intellectual property. Should trade actions heat up even further, don't be surprised if China and others begin targeting U.S. services for retaliation.
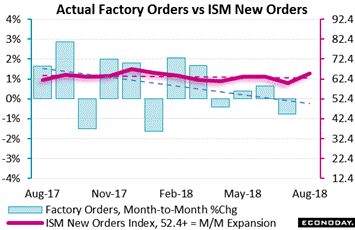 But as long as trade tensions are confined to goods, it will be the nation's manufacturers who will be in the front lines. Aside from brief gyrations in sentiment readings and continued warnings over cost pressures and supply dislocations, news out of manufacturing this year has been very positive. And no more positive than in the ISM report which surged again in August. The new orders index in this report jumped nearly 5 points to 65.1 in a result that points to strong production and employment for ISM's sample in the months to come. But has the ISM sample, numbering several hundred at most, been overstating strength? The graph compares the red line of ISM new orders where readings over 52.4 are consistent with monthly growth against the blue columns of actual factory orders where monthly growth has been uneven. There is a slight mismatch here as the ISM measures volumes and factory orders are in dollars but this aside, the ISM new orders index has been anything but uneven, posting plus 60 readings for the last 16 months in a row. The last time such a string was achieved was in the early 1970s and before that in the mid 1950s. The actual factory sector is very strong but not to this degree. But as long as trade tensions are confined to goods, it will be the nation's manufacturers who will be in the front lines. Aside from brief gyrations in sentiment readings and continued warnings over cost pressures and supply dislocations, news out of manufacturing this year has been very positive. And no more positive than in the ISM report which surged again in August. The new orders index in this report jumped nearly 5 points to 65.1 in a result that points to strong production and employment for ISM's sample in the months to come. But has the ISM sample, numbering several hundred at most, been overstating strength? The graph compares the red line of ISM new orders where readings over 52.4 are consistent with monthly growth against the blue columns of actual factory orders where monthly growth has been uneven. There is a slight mismatch here as the ISM measures volumes and factory orders are in dollars but this aside, the ISM new orders index has been anything but uneven, posting plus 60 readings for the last 16 months in a row. The last time such a string was achieved was in the early 1970s and before that in the mid 1950s. The actual factory sector is very strong but not to this degree.
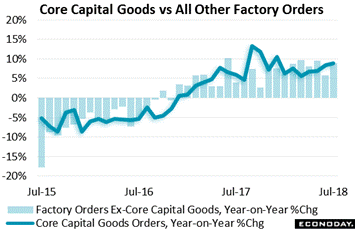 But before we condemn the ISM as nothing more than just another sentiment index, let's look at another of the week's highlights. Data on core capital goods, which exclude defense and aircraft, are showing great life and point to yet another quarter of very strong business investment. Core capital goods (blue line) rose to year-on-year growth of 8.8 percent in July which matches the rate of growth for all other factory orders excluding core capital goods (blue columns). Growth in factory orders can hit peaks in the low to mid double digits which does confirm that the nation's manufacturing sector, though perhaps not at records, is doing very well and could well begin to approach records. But before we condemn the ISM as nothing more than just another sentiment index, let's look at another of the week's highlights. Data on core capital goods, which exclude defense and aircraft, are showing great life and point to yet another quarter of very strong business investment. Core capital goods (blue line) rose to year-on-year growth of 8.8 percent in July which matches the rate of growth for all other factory orders excluding core capital goods (blue columns). Growth in factory orders can hit peaks in the low to mid double digits which does confirm that the nation's manufacturing sector, though perhaps not at records, is doing very well and could well begin to approach records.
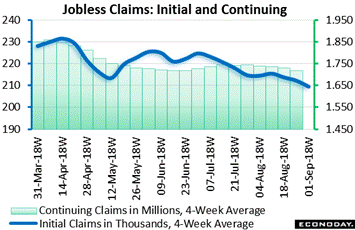 A hint of what to come is another highlight of the week. The sample period for the August employment report was at mid-month and two weeks of subsequent data in the jobless claims report offer early confirmation that nothing has changed, that demand for labor is very strong. Initial claims in the September 1 week fell 10,000 to 203,000 with the 4-week average down 2,750 to 209,500. Both of these results are the lowest since the December 6 week back in 1969. Continuing claims, where data lag by a week, fell 3,000 in the August 25 week to 1.707 million with this 4-week average down 13,000 to 1.719 million and at its lowest level since the December 8 week of 1973. There is, however, risk of revisions to these numbers as California, by far the largest state, had to be estimated as did a number of other states. Still, all signs are pointing to uninterrupted strength for the labor market. A hint of what to come is another highlight of the week. The sample period for the August employment report was at mid-month and two weeks of subsequent data in the jobless claims report offer early confirmation that nothing has changed, that demand for labor is very strong. Initial claims in the September 1 week fell 10,000 to 203,000 with the 4-week average down 2,750 to 209,500. Both of these results are the lowest since the December 6 week back in 1969. Continuing claims, where data lag by a week, fell 3,000 in the August 25 week to 1.707 million with this 4-week average down 13,000 to 1.719 million and at its lowest level since the December 8 week of 1973. There is, however, risk of revisions to these numbers as California, by far the largest state, had to be estimated as did a number of other states. Still, all signs are pointing to uninterrupted strength for the labor market.
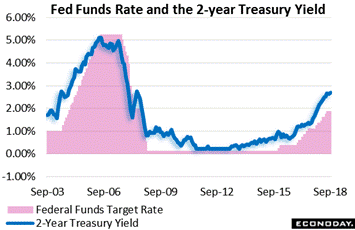 The strength of August employment report all but assures that the Fed will hike its funds rate by 0.25 percent to a target of 2.125 percent. And as can be seen in the graph, where this rate goes, so does the direction of the 2-year Treasury yield. The 2-year ended the week at 2.70 percent, rising 6 basis points in the week and mostly in reaction to the strength of the employment report and especially average hourly earnings. As the Fed lifts rates through the remainder of the year, and a second one is also penciled in for December, focus will shift to FOMC forecasts and the number of rate hikes penciled in for 2019 rate hikes. Right now there are three but if a fourth appears in the forecasts, the next set of which will be out with the month-end FOMC, the cries you here could well becoming from the administration not to mention the stock market. The increase in the 2-year yield is only half of the story, the other half being its relation to the 10-year Treasury yield. The spread between the two has been narrowing but is not guaranteed to collapse altogether, in what would be a flattening of the yield curve and a classic signal, at least for some, of impending recession. The strength of August employment report all but assures that the Fed will hike its funds rate by 0.25 percent to a target of 2.125 percent. And as can be seen in the graph, where this rate goes, so does the direction of the 2-year Treasury yield. The 2-year ended the week at 2.70 percent, rising 6 basis points in the week and mostly in reaction to the strength of the employment report and especially average hourly earnings. As the Fed lifts rates through the remainder of the year, and a second one is also penciled in for December, focus will shift to FOMC forecasts and the number of rate hikes penciled in for 2019 rate hikes. Right now there are three but if a fourth appears in the forecasts, the next set of which will be out with the month-end FOMC, the cries you here could well becoming from the administration not to mention the stock market. The increase in the 2-year yield is only half of the story, the other half being its relation to the 10-year Treasury yield. The spread between the two has been narrowing but is not guaranteed to collapse altogether, in what would be a flattening of the yield curve and a classic signal, at least for some, of impending recession.
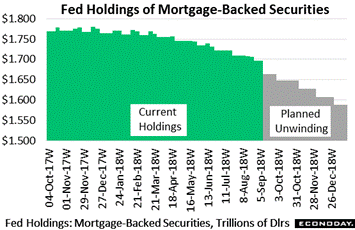 A still unknown variable for the bond market, and also the housing market, is the progress of balance-sheet unwinding. The Fed's assets totaled $4.208 trillion in the September 5 week, down $252 billion from the beginning of unwinding in October 2017. Treasury holdings were $2.313 trillion in the week, down $152 billion since October. But Treasuries have been going on schedule, very unlike the winding down of mortgage-backed securities which has yet to make any scheduled marker. MBS holdings were unchanged in the latest week at $1.697 trillion which is down $71.2 billion since October but $33 billion short of the scheduled decline to $1.664 trillion by the end of August. By the end of this month, they're scheduled to fall another $16 billion to $1.648 trillion. That's a lot less support for a mortgage market where mortgage rates have so far held steady this year. The Fed isn't known for missing its goals so lack of support for mortgage-backed securities, at an accelerating pitch, seems a certain feature of the year-end bond market. By year end, MBS holdings are scheduled to decline to $1.588 trillion. The Fed has yet to announce its plans for further unwinding in 2019. A still unknown variable for the bond market, and also the housing market, is the progress of balance-sheet unwinding. The Fed's assets totaled $4.208 trillion in the September 5 week, down $252 billion from the beginning of unwinding in October 2017. Treasury holdings were $2.313 trillion in the week, down $152 billion since October. But Treasuries have been going on schedule, very unlike the winding down of mortgage-backed securities which has yet to make any scheduled marker. MBS holdings were unchanged in the latest week at $1.697 trillion which is down $71.2 billion since October but $33 billion short of the scheduled decline to $1.664 trillion by the end of August. By the end of this month, they're scheduled to fall another $16 billion to $1.648 trillion. That's a lot less support for a mortgage market where mortgage rates have so far held steady this year. The Fed isn't known for missing its goals so lack of support for mortgage-backed securities, at an accelerating pitch, seems a certain feature of the year-end bond market. By year end, MBS holdings are scheduled to decline to $1.588 trillion. The Fed has yet to announce its plans for further unwinding in 2019.
| Markets at a Glance |
Year-End |
Week Ended |
Week Ended |
Year-To-Date |
Weekly |
|
2017 |
31-Aug-18 |
7-Sep-18 |
Change |
Change |
| DJIA |
24,719.22 |
25,964.82 |
25,916.54 |
4.8% |
-0.2% |
| S&P 500 |
2,673.61 |
2,901.52 |
2,871.68 |
7.4% |
-1.0% |
| Nasdaq Composite |
6,903.39 |
8,109.54 |
7,902.54 |
14.5% |
-2.6% |
|
|
|
|
|
|
| Crude Oil, WTI ($/barrel) |
$60.15 |
$69.93 |
$67.84 |
12.8% |
-3.0% |
| Gold (COMEX) ($/ounce) |
$1,305.50 |
$1,205.10 |
$1,201.90 |
-7.9% |
-0.3% |
|
|
|
|
|
|
| Fed Funds Target |
1.25 to 1.50% |
1.75 to 2.00% |
1.75 to 2.00% |
50 bp |
0 bp |
| 2-Year Treasury Yield |
1.89% |
2.64% |
2.70% |
81 bp |
6 bp |
| 10-Year Treasury Yield |
2.41% |
2.86% |
2.94% |
53 bp |
8 bp |
| Dollar Index |
92.29 |
95.11 |
95.38 |
3.3% |
0.3% |
Don't be surprised if the Fed hits its goals, whether for balance-sheet unwinding or for inflation. And Fed policy makers especially can't risk missing their goals for the latter and allowing early signs of wage pressure to go unnoticed and unchecked. It was just last month at Jackson Hole that Jerome Powell said inflation may have become less responsive to tightness in resource utilization and that there were no clear signs that it was accelerating beyond the Fed's 2 percent target. Powell can still of course stand behind these comments, though after the August employment report they do seem a bit less persuasive.
In follow up to the August acceleration in average hourly earnings, inflation data roll out in force in the coming week. Producer prices will be posted on Wednesday but are not expected to show resumed pressure nor are import & export prices on Friday. Some headline pressure for consumer prices, data out on Thursday, is expected but not for the core. Also released in the week will be September updates on inflation expectations, first on Wednesday with business data from the Atlanta Fed and then Friday with consumer data from the University of Michigan. JOLTS will be Tuesday's highlight and will offer another look at the labor market, here from the perspective of job openings. The Beige Book will be posted on Wednesday ahead of the month-end FOMC and yet another subdued economic assessment from this very subdued report can't be ruled out. Two major reports will end the week on Friday: retail sales where another solid month is the call and industrial production where only limited bounce-back strength is expected. Unless the data prove surprising, it will be a week of moderate-to-solid overall strength with, despite the August jump in hourly earnings, only limited inflationary pressures.
Consumer Credit for July
Consensus Forecast: $14.0 billion
Consensus Range: $12.5 to $15.5 billion
Rising growth of $14.0 billion is expected for consumer credit in July, after posting a moderate increase of $10.2 billion in a June result that showed a slight decrease for revolving credit.
Small Business Optimism Index for August
Consensus Forecast: 108.2
Consensus Range: 103.5 to 108.5
The small business optimism index is expected to firm to 108.2 in August vs July's 107.9 which was the second highest reading in 45 years of data. Strength in July was centered in job openings and the outlook for the economy.
JOLTS: Job Openings for July
Consensus Forecast: 6.665 million
Consensus Range: 6.600 to 6.900 million
Forecasters see job openings in July, at a consensus 6.665 million, holding steady near June's total of 6.662 million. This report has been signaling strong demand for labor.
PPI-FD for August
Consensus Forecast, Month-to-Month Change: 0.2%
Consensus Range: -0.1% to 0.3%
PPI-FD Less Food & Energy
Consensus Forecast, Month-to-Month Change: 0.2%
Consensus Range: 0.2% to 0.3%
PPI-FD Less Food, Energy, & Trade Services
Consensus Forecast, Month-to-Month Change: 0.2%
Consensus Range: 0.2% to 0.3%
An incremental 0.2 percent monthly increase is expected for the August producer price headline following a 0.3 percent increase in July. When excluding food and energy and also when excluding food, energy and trade services, 0.2 percent gains are also expected for both. Despite the low consensus, trade services have been on the rise in this report reflecting price pressures for wholesalers and retailers.
Beige Book
Prepared for the FOMC Meeting on September 25 & 26
The long refrain of "modest-to-moderate" economic growth returned in July's Beige Book which cited wide concerns over cost pressures and supply dislocations tied to tariffs. But this contrasted sharply with the assessment of the FOMC statement that followed two weeks later, which described both economic activity and household spending as strong.
Consumer Price Index for August
Consensus Forecast, Month-to-Month Change: 0.3%
Consensus Range: 0.0% to 0.4%
Consumer Price Index
Consensus Forecast, Year-on-Year Change: 2.8%
Consensus Range: 2.7% to 3.0%
CPI Core, Less Food & Energy
Consensus Forecast, Month-to-Month Change: 0.2%
Consensus Range: 0.2% to 0.3%
CPI Core, Less Food & Energy
Consensus Forecast, Year-on-Year Change: 2.3%
Consensus Range: 2.3% to 2.5%
Businesses may be complaining loudly about high costs but prices at the consumer level have been very stable. Forecasters see the consumer price index rising a moderate 0.3 percent in August following only a 0.1 percent increase in July. The consensus for the ex-food ex-energy core rate is only a 0.2 percent gain. Year-on-year rates for August are seen at 2.8 percent overall, vs 2.9 percent in July, and 2.3 percent for the core which would be unchanged from July.
Initial Jobless Claims for September 8 week
Consensus Forecast: 210,000
Consensus Range: 208,000 to 219,000
Initial claims are expected to come in at 210,000 in the September 8 week vs 203,000 in the prior week which along with the 4-week average at 209,500 hit 50-year lows. State estimates were unusually heavy in the prior week which raise the risk of significant revisions.
Treasury Budget for August
Consensus Forecast: -$166.5 billion
Consensus Range: -$183.0 billion to -$91.8 billion
Individual tax receipts are up, corporate tax receipts are down and spending is on the rise. Nine months into the government's fiscal year, the year-to-date deficit to July was 16 percent deeper than the prior year. Econoday's consensus for the August Treasury statement is a monthly deficit of $166.5 billion.
Retail Sales for August
Consensus Forecast: 0.4%
Consensus Range: 0.2% to 0.6%
Retail Sales Ex-Autos
Consensus Forecast: 0.5%
Consensus Range: 0.3% to 0.7%
Retail Sales Ex-Autos Ex-Gas
Consensus Forecast: 0.4%
Consensus Range: 0.3% to 0.5%
Retail Sales Control Group (Ex-Food Services, Ex-Autos, Ex-Gas, Ex-Building Materials)
Consensus Forecast: 0.4%
Consensus Range: 0.4% to 0.4%
Another solid month for retail sales is the expectation for August where the consensus is calling for a 0.4 percent gain vs 0.5 percent in July. Excluding autos, a gain of 0.5 percent is the call with ex-auto ex-gas at a consensus 0.4 percent and control group sales also at 0.4 percent.
Import Prices for August
Consensus Forecast, Month-to-Month Change: -0.1%
Consensus Range: -0.4% to 0.2%
Export Prices
Consensus Forecast, Month-to-Month Change: 0.2%
Consensus Range: -0.2% to 0.4%
Import price pressures were on a tariff-boosted rise before easing back abruptly in both June and July. And with oil soft, forecasters see August import prices slipping 0.1 percent after no change in July. Export prices for August are seen up 0.2 percent vs July's 0.5 percent decline.
Industrial Production for August
Consensus Forecast, Month-to-Month Change: 0.4%
Consensus Range: 0.1% to 0.6%
Manufacturing Production
Consensus Forecast, Month-to-Month Change: 0.2%
Consensus Range: 0.2% to 0.7%
Capacity Utilization Rate
Consensus Forecast: 78.3%
Consensus Range: 78.0% to 78.5%
A bounce back is expected for industrial production, at a consensus increase of 0.4 percent in August vs July's very soft 0.1 percent gain that reflected a monthly downswing in mining, which has otherwise been very strong, and a third month of weakness for utilities. The manufacturing component is not expected to show much strength, at a consensus 0.2 percent rise vs a 0.3 percent gain in July. Pressures on capacity utilization are expected to tighten 2 tenths to 78.3 percent.
Business Inventories for July
Consensus Forecast, Month-to-Month Change: 0.5%
Consensus Range: 0.2% to 0.6%
A large 0.5 percent rise is the consensus for business inventories in July, a constructive build that would help narrow the gap with underlying sales which have been very strong.
Consumer Sentiment Index, Preliminary September
Consensus Forecast: 97.0
Consensus Range: 95.5 to 99.0
The consumer sentiment index is expected to move higher in the preliminary reading for September, at a consensus 97.0 vs 96.2 in an August report that showed easing strength in the assessment of current conditions. The August report also showed incremental pressures in inflation expectations tied to expectations for robust economic growth.
|
