|
Consumer inflation is moderating but outside of China generally remains high which will tend to push back monetary easing. Global demand is uneven whether measured by international trade or consumer spending though, for the latter, rising strength in the US an important exception. But the US is not an exception when it comes to manufacturing health which is generally weak across major economies. What the Federal Reserve is likely to say at its January 31st announcement will be a focus of next week’s article. A focus for this article will be what the Bank of Canada does at its January 24th announcement on Wednesday.
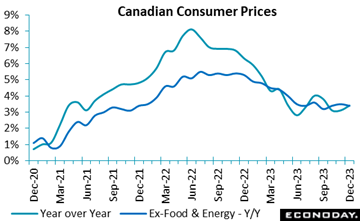 Canadian consumer prices rose to 3.4 percent in December, in line with expectations and up from 3.1 percent in November. Gasoline prices, reflecting year-ago base effects, led the increase. Excluding gasoline, the year-over-year rate edged to 3.5 percent from 3.6 percent. Excluding food and energy, prices also edged lower, to 3.4 percent from 3.5 percent. The Bank of Canada’s own measures of core inflation averaged 3.7 percent in December, unchanged from November. Canadian consumer prices rose to 3.4 percent in December, in line with expectations and up from 3.1 percent in November. Gasoline prices, reflecting year-ago base effects, led the increase. Excluding gasoline, the year-over-year rate edged to 3.5 percent from 3.6 percent. Excluding food and energy, prices also edged lower, to 3.4 percent from 3.5 percent. The Bank of Canada’s own measures of core inflation averaged 3.7 percent in December, unchanged from November.
All eight of the report’s main categories increased on the year. Mortgage interest cost together with rent were the two largest contributors, rising 28.6 percent and 7.7 percent. Services prices increased 4.3 percent while goods prices increased 2.4 percent.
Despite the headline acceleration, the fourth-quarter average eased to 3.2 percent from 3.7 percent the previous quarter, slightly below the 3.3 percent projection by the Bank of Canada. For
2023 as a whole, the consumer price index rose 3.9 percent on an annual average basis, down from a 40-year high of 6.8 percent in 2022.
Though the bias to the December is cooling, levels remain high. This is evident in the separately released BoC survey of consumer expectations where the bank described near-term inflation expectations as “barely” changing. On the supply side, the central bank's business outlook survey points to moderation in labour shortages and an easing in wage growth, albeit "only gradually". Importantly, businesses still expect inflation to remain above the two percent target "for some time".
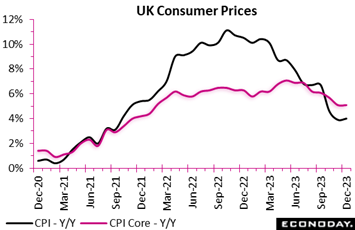 Consumer prices in the UK were a good deal stronger than expected at year-end. A 0.4 percent monthly spurt was double the market consensus and large enough to lift the annual inflation rate from 3.9 percent to 4.0 percent. This was the first increase in the yearly rate since February last year and widens the overshoot versus the medium-term target to 2.0 percentage points. Consumer prices in the UK were a good deal stronger than expected at year-end. A 0.4 percent monthly spurt was double the market consensus and large enough to lift the annual inflation rate from 3.9 percent to 4.0 percent. This was the first increase in the yearly rate since February last year and widens the overshoot versus the medium-term target to 2.0 percentage points.
Core prices were also firm but December is a seasonally strong month and a 0.6 percent monthly increase only left the underlying inflation rate steady at 5.1 percent. Overall goods inflation actually dipped from 2.0 percent to 1.9 percent but the rate in services climbed from 6.3 percent to 6.4 percent.
The main upward contribution to the change in the annual headline rate came from alcohol and tobacco where prices jumped 1.3 percent on the month versus a 1.1 percent rise in the same period in 2022. Recreation and culture (0.2 percent after minus 0.2 percent) and communication (minus 0.6 percent after minus 1.0 percent) also provided a modest boost. On the downside, miscellaneous goods and services fell 0.3 percent after a 0.3 percent gain in December 2022.
Were it not for a steep fall in retail sales that we’ll get to later, December’s over-heated inflation report would all but guarantee that the Bank of England will vote in February to leave Bank Rate at 5.25 percent. That said, December’s report does leave intact a downward trend in core inflation that should still pave the way for a lowering in borrowing costs later in the year.
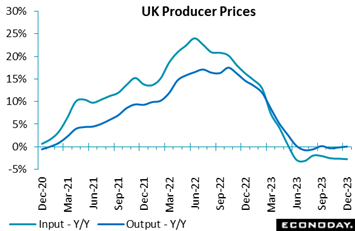 By contrast, producer prices in the UK were again soft and much weaker than expected. Factory gate prices in data for November dropped 0.6 percent on the month, well short of the market consensus and matching their steepest decline since December 2022. Even so, base effects saw annual inflation edge up from minus 0.1 percent to 0.1 percent, a 3-month high. Among components, the sharpest monthly fall was in coke and petroleum products (8.2 percent) ahead of chemicals (0.7 percent). On the upside, the only increase of any real size was in alcohol and tobacco (0.7 percent). Consequently, the core index was again only flat, reducing the annual underlying rate from 0.2 percent to just 0.1 percent. By contrast, producer prices in the UK were again soft and much weaker than expected. Factory gate prices in data for November dropped 0.6 percent on the month, well short of the market consensus and matching their steepest decline since December 2022. Even so, base effects saw annual inflation edge up from minus 0.1 percent to 0.1 percent, a 3-month high. Among components, the sharpest monthly fall was in coke and petroleum products (8.2 percent) ahead of chemicals (0.7 percent). On the upside, the only increase of any real size was in alcohol and tobacco (0.7 percent). Consequently, the core index was again only flat, reducing the annual underlying rate from 0.2 percent to just 0.1 percent.
At the same time, raw material and fuel costs fell a monthly 1.2 percent, double expectations and trimming their yearly rate by a tick to minus 2.8 percent, a 5-month low. Crude petroleum, natural gas and metal ores (minus 12.4 percent) posted the sharpest monthly drop ahead of fuel (2.5 percent). The only increase of note was in imported food (2.7 percent).
The December data are a good deal weaker than expected and underscore the absence of any significant inflation pressures in UK manufacturing.
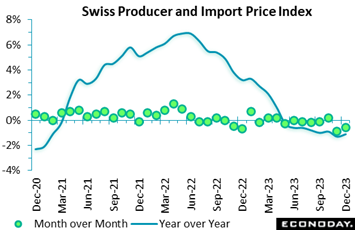 Switzerland’s combined producer and import price index was much weaker than expected in December. A 0.6 percent monthly drop doubled the market consensus but with base effects quite strongly positive, still boosted the annual inflation rate from minus 1.3 percent to minus 1.1 percent. Switzerland’s combined producer and import price index was much weaker than expected in December. A 0.6 percent monthly drop doubled the market consensus but with base effects quite strongly positive, still boosted the annual inflation rate from minus 1.3 percent to minus 1.1 percent.
Domestic producer prices were down 0.2 percent versus November, trimming their 12-month rate from 0.6 percent to 0.5 percent. Import prices declined a steeper 1.4 percent but their annual rate nevertheless rose from minus 4.8 percent to minus 4.4 percent.
Within the PPI, a 12.1 percent slump in petroleum products was easily the steepest drop and alone subtracted nearly 0.2 percentage points off the overall monthly change. Most other changes were only small apart from water supply which rose 1.9 percent. Import prices were similarly depressed by petroleum products (minus 9.1 percent) as well as mining and quarrying products (minus 14.4 percent). Consequently, the underlying composite index decreased a further 0.1 percent on the month to stand 0.4 percent lower on the year, its weakest outturn since March 2021.
In line with the rest of Europe, December’s report shows minimal inflationary pressures in Swiss manufacturing.
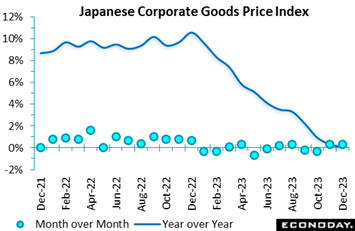 Producer inflation in Japan moderated for the 12th straight month to post zero growth on year in December, a bit above an expected 0.3 percent drop and following 33 months of increase including November’s 0.3 percent gain. Government subsidies continued to suppress utility costs while prices for lumber and steel remained below year-earlier levels amid slower global demand. Producer inflation in Japan moderated for the 12th straight month to post zero growth on year in December, a bit above an expected 0.3 percent drop and following 33 months of increase including November’s 0.3 percent gain. Government subsidies continued to suppress utility costs while prices for lumber and steel remained below year-earlier levels amid slower global demand.
On the month, the corporate goods price index rose 0.3 percent to match November's limited increase. The government scaled back subsidies to refineries, pushing up the prices for gasoline and other fuels. By contrast, the appreciation of the yen on expectations for an end to the Bank of Japan's negative short-term interest rate target helped lower import costs for some materials.
The monthly increase was led by higher costs for refined petroleum products (heavy fuels, gasoline and diesel), electronic parts and devises (connecting components and printed circuit boards) and farm produce (beef, pork and polished rice). Prices for metals, chemicals and non-ferrous metals fell.
As signaled by the prior week’s Tokyo CPI in data for December, Japanese consumer prices also released in the week confirmed incremental cooling, with the headline rate down to 2.6 from 2.8 percent and the ex-fresh food core rate down to 2.3 from 2.5 percent. Econoday’s consensus for the coming week’s Tokyo CPI calls for more tangible slowing in January, to 2.0 percent from 2.4 percent for the headline rate and to 1.9 percent from 2.1 percent ex-fresh food.
The Bank of Japan will also meet in the coming week and is widely expected to retain its guidance that it will "patiently continue with monetary easing" in order to "achieve the price stability target of 2 percent in a sustainable and stable manner, accompanied by wage increases." To this effect, it is likely to keep the targets of minus 0.1 percent for the short-term policy rate and "around zero percent" for the 10-year bond yield for now. Bank officials have said they want to confirm continued wage hikes in fiscal 2024 starting in April and higher services prices that reflect better earnings among smaller firms.
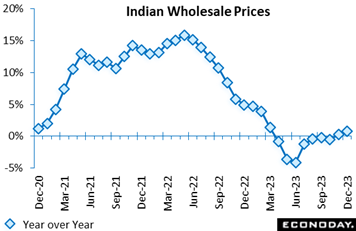 India's wholesale price index rose 0.73 percent on the year in December, roughly as expected after advancing 0.26 percent in November. The year-over-year increases in the index in the last two months follow an extended run of deflation in producer prices. Consumer price data published in the prior week also showed stronger pressures, with headline inflation picking up from 5.55 percent in November to 5.69 percent in December, further above the mid-point of the Reserve Bank of India's target range of two percent to six percent. India's wholesale price index rose 0.73 percent on the year in December, roughly as expected after advancing 0.26 percent in November. The year-over-year increases in the index in the last two months follow an extended run of deflation in producer prices. Consumer price data published in the prior week also showed stronger pressures, with headline inflation picking up from 5.55 percent in November to 5.69 percent in December, further above the mid-point of the Reserve Bank of India's target range of two percent to six percent.
Food and fuel prices drove December’s increase. Food prices, which account for around 15 percent of the index, rose 5.39 percent on the year after increasing 4.69 percent previously, while fuel prices, around 13 percent of the index, fell at a less pronounced pace, down 2.41 percent after dropping 4.61 percent previously. Manufacturing prices, around 64 percent of the index, fell 0.71 percent on the year after a previous decline of 0.64 percent.
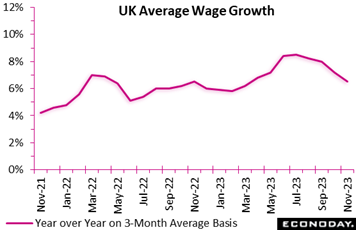 Wages in the UK were again easily on the soft side of Econoday’s consensus. At an annual 6.5 percent rate, headline growth in the three months to November was down sharply from 7.2 percent in the period to October, reflecting a drop in the single month rate from 6.0 percent to 5.0 percent. The headline print was the least overheated since the first quarter of 2023. Excluding bonuses, the picture was much the same with the headline rate dropping from 7.2 percent to 6.6 percent and the single month rate from 6.1 percent to 5.9 percent. Wages in the UK were again easily on the soft side of Econoday’s consensus. At an annual 6.5 percent rate, headline growth in the three months to November was down sharply from 7.2 percent in the period to October, reflecting a drop in the single month rate from 6.0 percent to 5.0 percent. The headline print was the least overheated since the first quarter of 2023. Excluding bonuses, the picture was much the same with the headline rate dropping from 7.2 percent to 6.6 percent and the single month rate from 6.1 percent to 5.9 percent.
The November/December Labour Market report in general indicated gradual loosening in a still tight labour market. ILO data, which are experimental, put the unemployment rate over the three months to November at 4.2 percent, a tick better than expectations and historically very low. Moreover, calculated on the same basis, employment was up a further 73,000, nudging the rate 0.1 percentage point higher to 75.8 percent and suggesting that demand for labour remains quite solid. That said, vacancies continued to fall, down 49,000 or 5.0 percent to 934,000 in the fourth quarter. Job offers have been on an unbroken downtrend since May-July 2022. In addition, the provisional payroll estimate for December showed a 24,000 drop versus November, its first fall since last August.
December’s update provides something for the doves and hawks alike. Overall labour market conditions show little slack but that has not stopped a surprisingly rapid cooling in wage growth. Even so, wages are still climbing at a pace that must leave a serious question mark hanging over the chances of sustainably attaining the BoE’s two percent inflation target. Again, it would seem unlikely that Bank Rate will be cut next month.
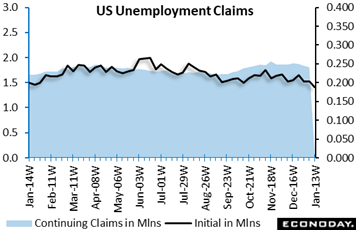 The labor market in the US remains very strong. Initial jobless claims fell 16,000 to 187,000 in the January 13 week from 203,000 in the prior week. The January 13 reading is the lowest since 182,000 in the September 24, 2022 week. It was also well below the consensus of 209,000 in Econoday’s survey of forecasters. The four-week moving average fell 4,750 to 203,250 in the January 13 week for its lowest reading since February last year. The labor market in the US remains very strong. Initial jobless claims fell 16,000 to 187,000 in the January 13 week from 203,000 in the prior week. The January 13 reading is the lowest since 182,000 in the September 24, 2022 week. It was also well below the consensus of 209,000 in Econoday’s survey of forecasters. The four-week moving average fell 4,750 to 203,250 in the January 13 week for its lowest reading since February last year.
Early January can be difficult to seasonally adjust, a period when businesses lay off their seasonal workers from the winter holiday shopping period. Typically, layoffs hit a peak in the first days of January. However, holiday hiring was more modest in 2023 and businesses may be keeping on some temporary employees to fill permanent positions. In the January 13 week, unadjusted claims were under what adjustment factors anticipated. The unadjusted total fell 29,543 to 289,228, or 9.3 percent lower while the seasonal factors looked for a decrease of 1.8 percent.
Continuing claims in lagging data for the January 6 week fell 26,000 to 1.806 million, while unadjusted claims rose 18,454 to 2.122 million. In either case, the movement is consistent with normal week-to-week changes. This adjusted four-week average fell 13,750 to 1.848 million and has been declining steadily, if modestly for the past two weeks. The insured rate of unemployment – for workers eligible for unemployment benefits – remained at 1.2 percent for the third week in a row.
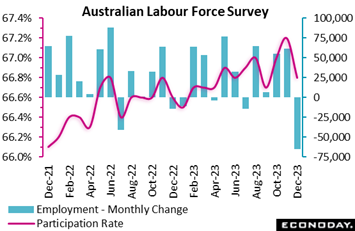 Australia’s labour force survey showed an unexpected decline in employment, a steady rate of unemployment, and a fall in participation. December’s 65,100 fall in employment was steep but followed unusually strong increases in the two prior months; in reaction officials noted that employment still increased over the last three months of the year but in a seasonal pattern that differed from previous years. This suggests that underlying labour market conditions remain solid and that the focus at the Reserve Bank of Australia will remain on upside risks to the inflation outlook. Australia’s labour force survey showed an unexpected decline in employment, a steady rate of unemployment, and a fall in participation. December’s 65,100 fall in employment was steep but followed unusually strong increases in the two prior months; in reaction officials noted that employment still increased over the last three months of the year but in a seasonal pattern that differed from previous years. This suggests that underlying labour market conditions remain solid and that the focus at the Reserve Bank of Australia will remain on upside risks to the inflation outlook.
Full-time employment fell by 106,600 persons in December after a previous increase of 57,000, while part-time employment rose by 41,400 after increasing by 4,500 previously. Hours worked fell 0.2 percent on the month after dropping 0.1 percent previously.
December’s unemployment rate was unchanged at 3.7 percent in December. The participation rate fell from a record high of 67.2 percent in November to 66.8 percent in December.
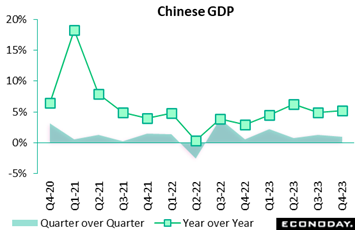 Chinese fourth-quarter GDP rose 1.0 percent on the quarter, moderating from sequential growth of 1.3 percent in the third quarter. Yet year-over-year growth picked up from 4.9 percent to 5.2 percent. In the accompanying statement, officials characterized the annual rate as evidence of steady improvement in the economy's "momentum of recovery". Ahead of the report Premier Li noted that the growth recorded in 2023 was not driven by "massive stimulus" and that officials "did not seek short-term growth while accumulating long-term risks". These comments suggest officials remain comfortable with current policy settings for now, despite ongoing weakness in the property market underscored by separate data on house prices which fell 0.4 percent on the year in December to extend a run of contraction going back to May 2022. Officials will announce growth and inflation forecasts for 2024 at the annual meeting of the National People's Congress in March. Chinese fourth-quarter GDP rose 1.0 percent on the quarter, moderating from sequential growth of 1.3 percent in the third quarter. Yet year-over-year growth picked up from 4.9 percent to 5.2 percent. In the accompanying statement, officials characterized the annual rate as evidence of steady improvement in the economy's "momentum of recovery". Ahead of the report Premier Li noted that the growth recorded in 2023 was not driven by "massive stimulus" and that officials "did not seek short-term growth while accumulating long-term risks". These comments suggest officials remain comfortable with current policy settings for now, despite ongoing weakness in the property market underscored by separate data on house prices which fell 0.4 percent on the year in December to extend a run of contraction going back to May 2022. Officials will announce growth and inflation forecasts for 2024 at the annual meeting of the National People's Congress in March.
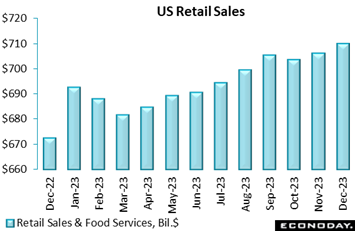 For the sixth straight month, US retail sales exceeded Econoday’s consensus, rising 0.6 percent in the key month of December to a seasonally adjusted $709.9 billion following a 0.3 percent rise in November. Excluding vehicles, sales rose 0.4 percent and rose 0.6 percent when excluding both vehicles and gasoline stations. Both of these also beat the consensus. The results end the fourth quarter on a strong note that will likely translate into solid gains for personal consumption expenditures in the fourth quarter GDP report on Thursday, January 25. For the sixth straight month, US retail sales exceeded Econoday’s consensus, rising 0.6 percent in the key month of December to a seasonally adjusted $709.9 billion following a 0.3 percent rise in November. Excluding vehicles, sales rose 0.4 percent and rose 0.6 percent when excluding both vehicles and gasoline stations. Both of these also beat the consensus. The results end the fourth quarter on a strong note that will likely translate into solid gains for personal consumption expenditures in the fourth quarter GDP report on Thursday, January 25.
December sales of motor vehicles and parts jumped 1.1 percent after rising 0.8 percent in November, suggesting that high financing costs are being offset by dealers incentives. Gas sales fell 1.3 percent after falling 3.4 percent in November, mainly due to declines in gas prices rather than declines in volume. Excluding gas, retail sales jumped 0.7 percent in both December and November, indicating consumers are spending on goods and services.
Online shopping appears to have had a good holiday season. Sales at nonstore retailers – a category dominated by e-commerce where details will be broken out in subsequent reports – rose 1.5 percent after an increase of 1.2 percent in November. Nonstore retailers accounted for 17.0 percent of all retail sales in December, up from 16.8 in November.
Sales at clothing stores rose 1.5 percent and general merchandise stores gained 1.3 percent. Department store sales – a subset of general merchandise – rose 3.0 percent for a suffering category that needed a good month. Sales fell 1.0 percent for furniture and home furnishings and fell 1.3 percent for health and personal care.
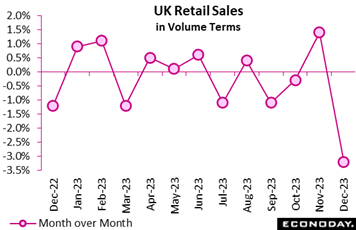 UK retailers had a miserable end to 2023. Volume sales slumped fully 3.2 percent on the month, much steeper than the consensus and the worst performance since the Covid lockdown in January 2021. The decline easily more than reversed November's 1.4 percent gain and left purchases at their weakest level since May 2020. Sales moved into annual contraction of 2.4 percent, down from 0.2 percent growth in November. UK retailers had a miserable end to 2023. Volume sales slumped fully 3.2 percent on the month, much steeper than the consensus and the worst performance since the Covid lockdown in January 2021. The decline easily more than reversed November's 1.4 percent gain and left purchases at their weakest level since May 2020. Sales moved into annual contraction of 2.4 percent, down from 0.2 percent growth in November.
Excluding auto fuel, the picture was much the same with sales down 3.3 percent versus the previous month and 2.1 percent lower on the year.
December's monthly nosedive reflected a 3.1 percent fall in sales of food and a 3.9 percent drop in non-food (ex-auto fuel) demand. Within the latter, losses were broad-based including a 7.1 percent collapse in non-specialised stores and a 4.5 percent decrease in the other stores category. Bad weather may have had an impact but elsewhere, non-store retailing was also down 2.1 percent. Auto fuel declined 1.9 percent.
December’s update leaves overall volumes falling a quarterly 0.9 percent after a 1.0 percent slide in the previous period and will strengthen arguments among the BoE doves to cut Bank Rate sooner rather than later.
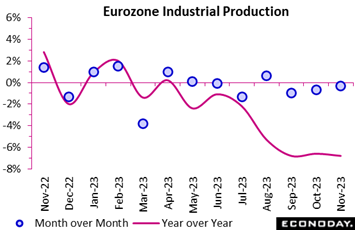 Industrial production in the Eurozone lost further ground in November A 0.3 percent monthly fall was in line with the consensus but, following an unrevised 0.7 percent drop in October, means that output has declined in five of the last six months. Annual contraction was minus 6.8 percent, down from minus 6.6 percent and production now stands at its lowest level since October 2020. Industrial production in the Eurozone lost further ground in November A 0.3 percent monthly fall was in line with the consensus but, following an unrevised 0.7 percent drop in October, means that output has declined in five of the last six months. Annual contraction was minus 6.8 percent, down from minus 6.6 percent and production now stands at its lowest level since October 2020.
The latest setback was led by durable consumer goods which fell a monthly 2.0 percent. Capital goods decreased 0.8 percent and intermediates 0.6 percent. Only partial offsets were provided by consumer non-durables (1.2 percent) and energy (0.9 percent).
Regionally, France (0.5) and Spain (1.1 percent) both saw their first increases in four months but there were fresh loses in Germany (0.3 percent) and Italy (1.5 percent). Elsewhere, the majority of member states also posted declines.
The latest data put average Eurozone industrial production in October/November 1.2 percent below its mean level in the third quarter and so suggests that the sector will again weigh on economic growth in the current period. Absent any revisions, December will need an improbably steep 3.8 percent monthly spurt just to keep the quarter flat. Accordingly, all the signs are that goods production ended 2023 on a particularly weak note.
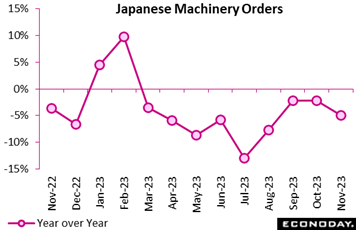 Core machinery orders in Japan came in much weaker than expected in November, down 4.9 percent on the month for the first drop in three months after a surprise 0.7 percent rise in October, amid uncertainty over global growth and a pullback in computer demand after recent gains. November’s seasonally adjusted value fell to ¥816.7 billion, hitting the lowest amount since ¥804.3 billion in April 2021. Core machinery orders in Japan came in much weaker than expected in November, down 4.9 percent on the month for the first drop in three months after a surprise 0.7 percent rise in October, amid uncertainty over global growth and a pullback in computer demand after recent gains. November’s seasonally adjusted value fell to ¥816.7 billion, hitting the lowest amount since ¥804.3 billion in April 2021.
Year-over-year, orders fell by a larger-than-expected 5.0 percent following a 2.2 percent fall in the prior month. This is the ninth straight month of annual contraction. Core orders exclude electric utilities and ships and are considered a leading indicator of business investment.
The Cabinet Office maintained its assessment in the November report that "Machinery orders are pausing."
Companies are generally cautious about implementing their otherwise solid capital investment plans for fiscal 2023 ending next March, as seen in the second straight quarterly decline in capex in the July-September GDP data. There is strong demand for automation amid labor shortages as well as government-led digitization and emission control.
Orders from manufacturers plunged 7.8 percent on the month in November after rising 0.2 percent in October while those from non-manufacturers in the core measure edged down 0.4 percent after rising 1.2 percent the previous month.
November orders were led lower by demand for boilers and turbines from "other manufacturers" in payback for an increase in the prior month as well as for cranes and conveyors from general and production machine makes. Orders for computers from telecommunications firms rose while those from financial firms and information service providers fell.
Machinery orders in the fourth quarter are unlikely to hit the official projection. Last month, the Cabinet Office forecast that core orders would edge up 0.5 percent in the October-December quarter, led by a sharp rebound in orders from the non-manufacturing sector, which was expected to offset a second straight quarterly drop in those from the manufacturing sector. In order to meet this forecast, core orders would have to rebound by 7.2 percent in December.
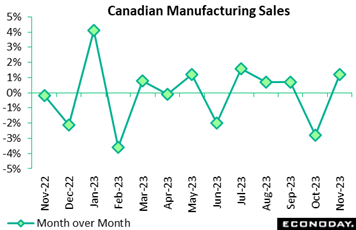 Driven by higher volumes, Canadian manufacturing sales rebounded 1.2 percent in November after contracting 2.9 percent in October. On a year-over-year basis, sales were down 0.8 percent after declining 1.4 percent the previous month. Real sales increased 1.6 percent in November, a month when producer prices fell 0.4 percent. Driven by higher volumes, Canadian manufacturing sales rebounded 1.2 percent in November after contracting 2.9 percent in October. On a year-over-year basis, sales were down 0.8 percent after declining 1.4 percent the previous month. Real sales increased 1.6 percent in November, a month when producer prices fell 0.4 percent.
Sales increased in 13 of 21 sectors, with durable goods up 1.9 percent and non-durables up 0.5 percent. The monthly expansion was led by gains of 6.6 percent in chemicals, 4.0 percent in primary metals and 4.3 percent in machinery. Motor vehicle sales dropped 4.0 percent, the largest decline of the eight sectors recording lower monthly sales. Statistics Canada cited a shutdown at a major auto assembly plant in Ontario as the main reason behind lower auto sales. Excluding motor vehicles, parts and accessories, manufacturing sales were up 1.5 percent from October. That said, motor vehicle sales increased 26.8 percent from a year earlier. Petroleum and coal decreased 2.2 percent month-to-month.
Forward-looking indicators are not encouraging, with new orders down 0.3 percent and unfilled orders down 0.8 percent. Inventories increased 0.5 percent on the month to their highest level on record.
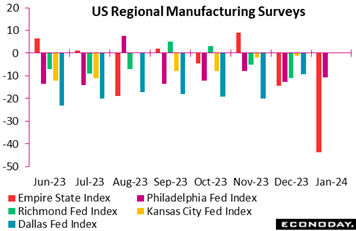 One of the week’s big jolts on the US calendar was a vast plunge in the Empire State manufacturing index, falling out of the blue to minus 43.7 which was nearly 30 points below December and nearly 40 points below Econoday’s consensus. The last time this index was this low was in May 2020 during the Covid shutdown. Yet this collapse was not confirmed by the subsequent Philadelphia Fed manufacturing index which actually improved slightly to minus 10.6. How should we reconcile the divergence? Comparing both Empire State and Philly Fed on an ISM-equivalent basis (50-point breakeven using ISM component weightings) shows less separation with the former equal to 39.7 and the latter at 43.2, both of which would be extremely weak and similarly weak. One of the week’s big jolts on the US calendar was a vast plunge in the Empire State manufacturing index, falling out of the blue to minus 43.7 which was nearly 30 points below December and nearly 40 points below Econoday’s consensus. The last time this index was this low was in May 2020 during the Covid shutdown. Yet this collapse was not confirmed by the subsequent Philadelphia Fed manufacturing index which actually improved slightly to minus 10.6. How should we reconcile the divergence? Comparing both Empire State and Philly Fed on an ISM-equivalent basis (50-point breakeven using ISM component weightings) shows less separation with the former equal to 39.7 and the latter at 43.2, both of which would be extremely weak and similarly weak.
Yet the various diffusion surveys like the regional Fed surveys and the closely watched ISM manufacturing index (all of which measure changes in volumes) have for the past year been signaling inflation-adjusted contraction for the US manufacturing sector. And contraction in volume terms is exactly what happened in 2024 though only marginally at minus 0.8 percent for manufacturing output in December’s industrial production report. If diffusion reports are best used as directional signals for definitive data (as opposed to signals for magnitude of change), then maybe they’re doing their job after all. Note that GDP data are also volume-based (inflation adjusted) suggesting that the manufacturing sector doesn’t look to be, to say the least, a driving force for fourth-quarter GDP or, based on the January results from Empire State and Philly Fed, first-quarter GDP either. The next manufacturing update will be on Tuesday of the coming week with the Richmond Fed index.
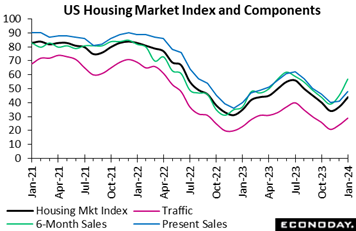 The US housing sector, in contrast to tis manufacturing sector, is going into 2024 on the rebound. Housing starts did fall back in December to a 1.45 million annual pace but year-over-year growth of 7.6 percent was the strongest since the spring of 2022. Likewise for permits which rose in December for yearly growth of 6.1 percent. And easily exceeding the consensus was the housing market index from the nation’s home builders, which rebounded sharply to 44 in January after 37 in December. Mortgage rates are currently averaging 6.75 percent based on the latest 30-year Mortgage Banker data, which is down more than 100 basis points from October last year. The US housing sector, in contrast to tis manufacturing sector, is going into 2024 on the rebound. Housing starts did fall back in December to a 1.45 million annual pace but year-over-year growth of 7.6 percent was the strongest since the spring of 2022. Likewise for permits which rose in December for yearly growth of 6.1 percent. And easily exceeding the consensus was the housing market index from the nation’s home builders, which rebounded sharply to 44 in January after 37 in December. Mortgage rates are currently averaging 6.75 percent based on the latest 30-year Mortgage Banker data, which is down more than 100 basis points from October last year.
January’s present sales index rose 7 points to 48 for the best reading since September 2023 when mortgage rates began to top the 7 percent mark. January’s expected sales index jumped 12 points to 57 in December for its highest level since July 2023, while the index for buyer traffic rose 5 points to 29. Among builders, 62 percent are offering some type of purchase incentive, up from 60 percent in December and 57 percent in January last year.
The biggest concern for home builders may no longer be demand but supply. The report is warning of pending price jumps and supply shortages for lumber, lots and labor.
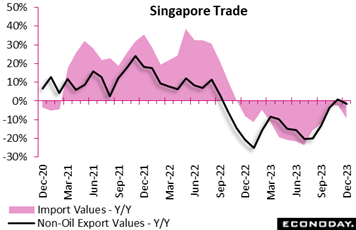 Singapore's non-oil domestic exports fell 1.5 percent on the year in December after advancing 1.0 percent in November; on the month exports declined 2.8 percent after a previous increase of 0.3 percent. Imports fell 9.3 percent on the year in December after falling 2.5 percent in November and fell 6.9 percent on the month after dropping 3.9 percent previously. Singapore's non-oil domestic exports fell 1.5 percent on the year in December after advancing 1.0 percent in November; on the month exports declined 2.8 percent after a previous increase of 0.3 percent. Imports fell 9.3 percent on the year in December after falling 2.5 percent in November and fell 6.9 percent on the month after dropping 3.9 percent previously.
Exports of electronics products fell 11.7 percent on the year after dropping 12.8 percent previously, while exports of non-electronic products rose 1.4 percent after a previous increase of 5.2 percent. Exports to China and Hong Kong recorded stronger year-over-year growth and exports to the European Union rose after a previous decline, but exports to Japan and South Korea fell at a more pronounced rate.
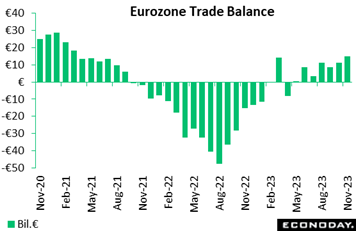 The Eurozone’s merchandise trade balance improved from an upwardly revised €11.1 billion in October to €14.8 billion in November, easily its strongest print so far in 2023. The improvement reflected a combination of stronger exports, which rose 1.0 percent on the month to their highest level since May, and weaker imports, which declined 0.6 percent and have not risen since July. Unadjusted, the balance was in a €20.3 billion surplus versus a €13.8 billion deficit a year ago. The Eurozone’s merchandise trade balance improved from an upwardly revised €11.1 billion in October to €14.8 billion in November, easily its strongest print so far in 2023. The improvement reflected a combination of stronger exports, which rose 1.0 percent on the month to their highest level since May, and weaker imports, which declined 0.6 percent and have not risen since July. Unadjusted, the balance was in a €20.3 billion surplus versus a €13.8 billion deficit a year ago.
The November data leave a broadly flat trend for exports and a declining path for imports. However, both exports and imports remain below their respective levels in November 2022. Hence unadjusted annual growth of exports now stands at minus 4.7 percent and of imports, at minus 16.7 percent. Both sides of the balance sheet continue to be negatively impacted by trade with Russia. Over the first 11 months of the year exports to Russia were down 30.3 percent and imports fully 75.6 percent.
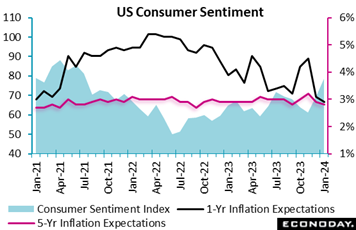 We end the week’s data run with Friday’s big surprise. US consumer sentiment is surging this month, up 9.1 points to 78.8 which far exceeds Econoday’s consensus range where the top estimate was 72.5. This is an unusually large gain and follows December’s 8.4-point jump in what was another unusual gain. January and December combined represent a 29 percent surge for the largest two-month increase since the end of the 1991 recession. We end the week’s data run with Friday’s big surprise. US consumer sentiment is surging this month, up 9.1 points to 78.8 which far exceeds Econoday’s consensus range where the top estimate was 72.5. This is an unusually large gain and follows December’s 8.4-point jump in what was another unusual gain. January and December combined represent a 29 percent surge for the largest two-month increase since the end of the 1991 recession.
December’s gain is evenly split between both current conditions, up 10 points to 83.3, and expected conditions, up 9.5 points to 75.9. Gains are also evenly split across demographics and also between Democrats and Republicans.
Cooling inflation expectations help explain the ongoing strength. Year-ahead expectations are down 2 tenths so far this month to 2.9 percent which is the lowest rate in more than 3 years, since December 2020. Five-year expectations, which have been stable throughout the inflation scare, are down 1 tenth to a 2.8 percent rate that was last posted in September last year.
Underpinned by the US, global economic data are coming in slightly ahead of expectations, at 11 for the Relative Performance Index. When excluding prices (RPI-P), the index eases slightly to 5 and very near the breakeven zero line.
The US is far outperforming other economies relative to expectations, at scores of 42 both including and excluding inflation. With inflation in the US still above target and given improving consumer spirits and solid consumer spending (not to mention the strong labor market), the Federal Reserve may see little reason to cut interest rates anytime soon.
With the RPI at minus 4 and the RPI-P at 2, recent Eurozone economic data have largely matched market expectations. Ahead of the first ECB meeting of the year, this further boosts the likelihood of no change in policy on Thursday. Nonetheless, the big picture remains one of sluggish growth and a surprisingly rapid deceleration in inflation. As such, speculation about a cut in key interest rates over the next few months remains solid.
In the UK, an upside surprise in December inflation further reduces the chances of an early cut in Bank Rate. However, an equally unexpected steep fall in retail sales reduced the RPI to 1 and the RPI-P to minus 9, increasing the likelihood of another split MPC vote and underlining the policy dilemma facing the BoE.
In Switzerland, signs of unexpectedly strong deflationary pressure in the manufacturing sector was largely responsible for trimming the RPI to 3 and the RPI-P to 6. Even so, economic activity is largely living up to market forecasts.
Japanese inflation news was in line with forecasts and put the RPI at 4 and the RPI-P at minus 6. This leaves financial markets still pondering when the Bank of Japan is most likely to tighten though a move as early as this week is unlikely.
In China, a raft of economic data was close enough to predictions to leave the RPI at exactly zero and the RPI-P at 10. The latest data may ease some pressure on the authorities for additional stimulus but with deflation still a major issue, the immediate policy bias remains on the downside.
In Canada, the outperformance that marked much of 2023 has recently given way to signs of unexpected weakness. However, most of last week’s data were a little firmer than anticipated and lifted the RPI from the prior week’s minus 19 to minus 5 and the RPI-P from minus 39 to minus 6. That said, with core inflation still falling and overall economic activity subdued, the Bank of Canada is seen easing policy at least once by June.
**Contributing to this article were Jeremy Hawkins, Brian Jackson, Mace News, Max Sato, and Theresa Sheehan
People’s Bank of China is expected to kick the week off on Monday with a rate cut, lowering both its 1-year and 5-year loan prime rates by 10 basis points each in a renewed effort to stimulate the economy. Bank of Japan on Tuesday is not expected to adjust policy further given the immediate impact of the January’s earthquake in Ishikawa Prefecture.
For the Bank of Canada, stalling improvement for inflation is expected to keep the bank on the sidelines on Wednesday. The European Central Bank on Thursday is likewise expected to hold policy steady, this despite visible improvement in inflation and visible weakness in economic activity. Focus on both the BoC and ECB meetings will be signals on future rate cuts.
US data will be headlined by the first estimate of fourth-quarter GDP where a modest 2.0 percent growth rate is Econoday’s consensus; personal consumption expenditures are seen at a 2.5 percent rate. Personal income and outlays on Friday are expected to show moderate rates of growth for both income and spending in the month of December and limited moderation for the PCE price indexes.
Among other highlights, the European Commission’s consumer confidence flash on Tuesday is expected to improve while New Zealand’s fourth-quarter CPI on Wednesday is expected to moderate. January’s PMI flashes on Wednesday are generally expected to show modest improvement: deep but easing contraction for manufacturing and very little contraction for services.
China Loan Prime Rates (Mon 0915 CST; Mon 0115 GMT; Sun 2015 EST)
Consensus Change: 1-Year Rate: 10 basis points
Consensus Level: 3.35%
Consensus Change: 5-Year Rate: 10 basis points
Consensus Level: 4.10%
After holding steady in December, the People's Bank of China is expected to cut both its 1-year and 5-year loan prime rates by 10 basis points each, to 3.35 percent and 4.10 percent, respectively.
Bank of Japan Announcement (Expected sometime between 11:30 and 12:00 JST on Tuesday, January 23)
Consensus Forecast, Change: 0 basis points
Consensus Forecast, Level: -0.10%
After tightening policy by loosening the upper limit of the 10-year yield at its October meeting and holding steady in December, the Bank of Japan is once again expected to hold steady at its January meeting. This month’s earthquake in Ishikawa Prefecture, which killed more than 230 people and has left over 15,000 still in evacuation, is seen as a factor. No change is expected for the minus 0.1 percent overnight rate.
Singapore CPI for December (Tue 1300 SGT; Tue 0500 GMT; Tue 0000 EST)
Consensus Forecast, Year over Year: 3.5%
Consumer prices in December, which in November eased broadly and sharply to 3.6 percent from 4.7 percent, are expected to edge further lower to 3.5 percent.
Eurozone: EC Consumer Confidence Flash for January (Tue 1700 CET; Tue 1500 GMT; Tue 1000 EST)
Consensus Forecast: -14.5
Consumer confidence in January is expected to improve to minus 14.5 versus December’s minus 15.1 which was more than a point better than expectations but still well short of the minus 11.3 long-run average.
New Zealand Fourth-Quarter CPI (Wed 1045 NZDT; Tue 2145 GMT; Tue 1645 EST)
Consensus Forecast, Quarter over Quarter: 0.5%
Consensus Forecast, Year over Year: 4.7%
Consumer prices are expected to rise a quarterly 0.5 percent in the fourth quarter for year-over-year growth of 4.7 percent. These would compare with respective third-quarter rates of 1.8 and 5.6 percent, the latter down from 6.0 percent in the second quarter.
Japanese Merchandise Trade for December (Wed 0850 JST; Tue 2350 GMT; Tue 1850 EST)
Consensus Forecast: -¥98.9 billion
Consensus Forecast, Imports Y/Y: -5.2%
Consensus Forecast, Exports Y/Y: 9.0%
A deficit of ¥98.9 billion is the consensus for December’s trade balance versus a deficit of ¥780.4 billion in November that reflected softer exports for iron and steel as well as chip-making equipment. Exports in December are forecast to rebound 9.0 percent year-over-year led by automobiles.
French PMI Flashes for January (Wed 0915 CET; Wed 0815 GMT; Wed 0315 EST)
Consensus Forecast, Manufacturing: 42.5
Consensus Forecast, Services: 46.0
Substantial contraction is expected for January’s manufacturing PMI, at a consensus 42.5 versus 42.1. Services are seen 46.0 at versus 45.7.
German PMI Flashes for January (Wed 0930 CET; Wed 0830 GMT; Wed 0330 EST)
Consensus Forecast, Composite: 47.8
Consensus Forecast, Manufacturing: 43.7
Consensus Forecast, Services: 49.5
Manufacturing, at 43.3 in December, has been in long and deep contraction. No significant improvement is expected for January where the consensus is 43.7. Services, at 49.3 in December, are seen at 49.5. Consensus for January’s composite is 47.8 following December’s 47.4.
Eurozone PMI Flashes for January (Wed 1000 CET; Wed 0900 GMT; Wed 0400 EST)
Consensus Forecast, Composite: 48.0
Consensus Forecast, Manufacturing: 44.8
Consensus Forecast, Services: 49.0
The composite is expected to modestly improve in January to 48.0 versus 47.6 in December. Manufacturing is likewise expected to improve to 44.8 versus December’s 44.4 with January services expected at 49.0 from 48.8.
UK PMI Flashes for January (Wed 0930 GMT; Wed 0430 EST)
Consensus Forecast, Composite: 52.4
Consensus Forecast, Manufacturing: 46.8
Consensus Forecast, Services: 53.4
Services in December increased a solid 2.5 points to 53.4 with January expected to hold steady. Manufacturing is seen rising to 46.8 versus December’s 46.2 which was weaker than expected and down a full point from November. The composite is expected to rise to 52.4 from 52.1 in December.
Bank of Canada Announcement (Wed 1445 GMT; Wed 0945 EST)
Consensus Forecast, Change: 0 basis points
Consensus Forecast, Level: 5.00%
Weakness may be appearing in economic activity but moderation in inflation has slowed. The Bank of Canada is expected to hold its policy rate steady at 5.0 percent.
Korean Fourth-Quarter GDP, First Estimate (Thu 0800 KST; Thu 0000 GMT; Wed 1800 EST)
Consensus Forecast, Quarter over Quarter: 0.5%
Consensus Forecast, Year over Year: 2.1%
Fourth-quarter GDP is expected to rise a quarterly 0.5 percent and rise 2.1 percent on the year. These would compare respectively with growth of 0.6 and 1.4 percent in the third quarter and 0.6 and 0.9 percent in the second quarter.
French Business Climate Indicator for December (Thu 0845 CET; Thu 0745 GMT; Thu 0245 EST)
Consensus Forecast: 98
Forecasters see the business climate indicator holding steady at 98 after November’s 1-point increase.
German Ifo for January (Thu 10:00 CET; Thu 0900 GMT; Thu 0400 EST)
Consensus Forecast, Business Climate: 86.8
Consensus Forecast, Current Conditions: 88.6
Consensus Forecast, Business Expectations: 85.0
The business climate index, which at 86.4 in December was noticeably below the consensus for 87.8, is expected to rise modestly to 86.8 in January.
European Central Bank Announcement (Thu 1315 GMT; Thu 1415 CET; Thu 0815 EST)
Consensus Forecast, Change: 0 basis points
Consensus Forecast, Refi Rate: 4.50%
The European Central Bank is expected to hold rates steady despite improvement in inflation and weakness in economic activity. The question for policy watchers is when the bank expects to bring down rates.
US Fourth-Quarter GDP, First Estimate (Thu 0830 EST, Thu 1330 GMT)
Consensus Forecast, Annualized Rate: 2.0%
US Real Personal Consumption Expenditures
Consensus Forecast: 2.5%
Fourth-quarter GDP is expected to slow to 2.0 percent annualized growth versus third-quarter growth of 4.9 percent. Personal consumption expenditures, after the third quarter's 3.1 percent rate, are expected to rise 2.5 percent.
Tokyo Consumer Price Index for January (Fri 0830 JST; Thu 2330 GMT; Thu 1830 EST)
Consensus Forecast, Year over Year: 2.0%
Ex-Fresh Food, Consensus Forecast: 1.9%
Ex-Fresh Food & Energy, Consensus Forecast: 3.4%
Expected to extend a slowing trend, consumer inflation in Tokyo is forecast to come in at a year-over-year 2.0 percent in January versus 2.4 percent in December that was down from 2.7 percent in November. The ex-fresh food reading is seen at 1.9 percent versus December’s 2.1 percent which was down from 2.3 percent while ex-fresh food & energy, expected at 3.4 percent, slowed to 3.5 in December from 3.6 percent.
Singapore Industrial Production for December (Fri 1300 SGT; Fri 0500 GMT; Fri 0000 EST)
Consensus Forecast, Year over Year: 0.9%
Industrial production in December, which in November rose 1.0 percent on the year, is expected to hold steady at 0.9 percent.
Germany: GfK Consumer Climate for February (Fri 0800 CET; Fri 0700 GMT; Fri 0200 EST)
Consensus Forecast: -24.5
Consumer climate is expected to rise to minus 24.5 in February’s report after a 2.5 point rise to minus 25.1 in January that marked a second month of improvement.
Eurozone M3 Money Supply for December (Fri 1000 CET; Fri 0900 GMT; Fri 0400 EST)
Consensus Forecast, Year-over-Year: -0.7%
Broad money growth (on a 3-month basis) is expected to remain in contraction, at minus 0.7 percent year-over-year versus 1.0 percent contraction in November.
US Personal Income for December (Fri 0830 EST; Fri 1330 GMT)
Consensus Forecast, Month over Month: 0.3%
US Consumption Expenditures
Consensus Forecast, Month over Month: 0.4%
US PCE Price Index
Consensus Forecast, Month over Month: 0.2%
Consensus Forecast, Year over Year: 2.7%
US Core PCE Price Index
Consensus Forecast, Month over Month: 0.2%
Consensus Forecast, Year over Year: 3.0%
Personal income is expected to rise 0.3 percent in December with consumption expenditures expected to increase 0.4 percent. These would compare with November’s increases of 0.4 and 0.2 percent. Inflation readings for December are expected at monthly increases of 0.2 percent both overall and for the core (versus 0.1 percent contraction overall in November and a 0.1 percent gain for the core). Annual rates are expected at 2.7 percent overall and 3.0 percent for the core (versus November’s 2.6 and 3.2 percent).
|
