|
Both the Federal Reserve and Bank of England meet in the coming week and -- against a backdrop of cooling and less elevated price pressures combined, however, with no signs of recession -- are expected to hold policy steady as have the host of global central banks in recent months. Policy decisions in the latest week didn’t surprise anybody as we shall see, unlike some of the economic reports like Tokyo consumer prices which fell sharply and reawakened Japan’s struggle with deflation. A similar surprise in the US was the PCE price indexes which are suddenly under 3 percent and unexpectedly raising the theoretical question of disinflation. US GDP was a major surprise on the upside, perhaps hinting at similar results for European GDP reports in the coming week as tracked in this article’s Looking Ahead section.
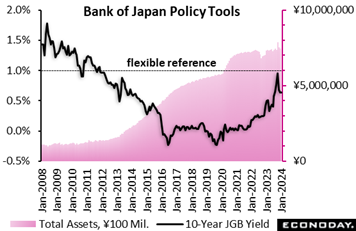 The Bank of Japan voted unanimously, as expected, to maintain its seven-year-old yield curve control framework and retain its guidance that it will "patiently continue with monetary easing" in order to "achieve the price stability target of 2 percent in a sustainable and stable manner, accompanied by wage increases." The Bank of Japan voted unanimously, as expected, to maintain its seven-year-old yield curve control framework and retain its guidance that it will "patiently continue with monetary easing" in order to "achieve the price stability target of 2 percent in a sustainable and stable manner, accompanied by wage increases."
In a decade-long pursuit of stable 2 percent inflation, the board decided to keep the targets of minus 0.1 percent for the short-term policy rate and "around zero percent" for the 10-year bond yield, the latter of which has a flexible 1 percent upper limit after having been adjusted twice last year in the face of ripple effects from higher US bond yields.
Market focus remains on when the central bank will end its negative interest rate policy introduced in January 2016. The BoJ charges 0.1 percent interest on a part of cash reserves parked at the bank by financial institutions, which is designed to encourage banks to lend more, but it is unpopular among lenders as it squeezes their profit margins.
BoJ policymakers are expected to maintain their easing stance at least until April, when they hope to see a clearer sign that wages will continue rising substantially. The results of annual wage negotiations between major firms and their trade unions won't be available until mid-March and indications of how that will influence smaller firms, which employ about 70 percent of the workforce, are likely to emerge after the April 1 start of fiscal 2024.
In its updated quarterly outlook, the BoJ board maintained its forecast for inflation in the current fiscal year but lowered its projection for fiscal 2024 in light of easing energy prices. It still sees inflation just below its 2 percent target in fiscal 2025.
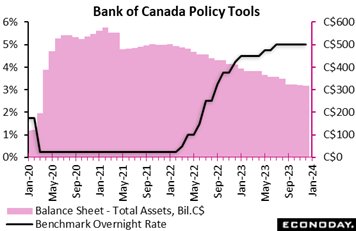 The Bank of Canada maintained its policy interest rate at 5.0 percent for the fourth straight meeting, as expected, but softened its hawkish tone amid sluggish economic growth though it continued to warn that underlying inflation is persistent and wage growth is high. The Bank of Canada maintained its policy interest rate at 5.0 percent for the fourth straight meeting, as expected, but softened its hawkish tone amid sluggish economic growth though it continued to warn that underlying inflation is persistent and wage growth is high.
The bank said it is also continuing its policy of quantitative tightening to trim the bank's balance sheet to a normal level.
The central bank is "still concerned" that inflation may stay above its two percent inflation target but it dropped its long-held line that it "remains prepared" to hike rates if needed, which had been repeated in recent rate announcements to cool off expectations of an early rate cut and speculative investment in the housing and other markets.
Economists expect the bank will wait until mid-2024 to consider lowering interest rates, with the earliest forecast for April when the bank will provide its medium-term economic forecasts and risk analysis in the next quarterly report.
In January’s quarterly report, economic growth is expected to strengthen gradually around the middle of 2024. In the second half of 2024, household spending will likely pick up and exports and business investment should get a boost from recovering foreign demand. Spending by governments contributes materially to growth through the year. Overall, the bank forecasts GDP growth of 0.8 percent in 2024 and 2.4 percent in 2025, roughly unchanged from its October projection.
CPI inflation ended the year at 3.4 percent. Shelter costs remain the biggest contributor to above-target inflation. The bank expects inflation to remain close to 3 percent during the first half of this year before gradually easing, returning to the 2 percent target in 2025. While the slowdown in demand is reducing price pressures in a broader number of CPI components and corporate pricing behaviour continues to normalize, core measures of inflation are not showing sustained declines.
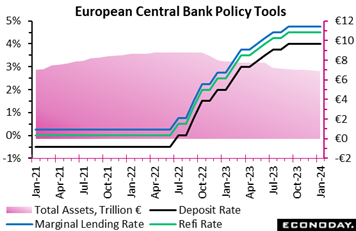 As widely anticipated, the ECB made no policy changes at its first meeting of 2024. Accordingly, the key deposit rate remains at a record 4.0 percent, below both the refi rate (4.50 percent) and the rate on the marginal lending facility (4.75 percent). As widely anticipated, the ECB made no policy changes at its first meeting of 2024. Accordingly, the key deposit rate remains at a record 4.0 percent, below both the refi rate (4.50 percent) and the rate on the marginal lending facility (4.75 percent).
Forward guidance similarly matched the December statement whereby "…the Governing Council considers that the key ECB interest rates are at levels that, maintained for a sufficiently long duration, will make a substantial contribution…" to achieving the 2 percent medium-term inflation target. Policy stays data-dependent.
There is nothing new here and the same applies to the QT programme. As indicated at the end of last year, the asset purchase programme (APP) continues to shrink as the Eurosystem no longer reinvests the principal payments from its maturing securities. For now, inflows from maturing securities acquired under the pandemic emergency purchase programme (PEPP) will continue to be fully reinvested, but a switch to partial reinvestment will aim to reduce the portfolio by an average €7.5 billion a month over the second half of the year.
ECB President Lagarde's press conference also offered little in the way of fresh insight. By and large, recent economic data seem to have contained few surprises and perceived risks to the real economy remain on the downside. For inflation, domestic price pressures were seen as high, but moderating, while military action in the Middle East was an upside external threat. Lagarde pointed out that the consensus at the Governing Council table thought it premature to talk about rate cuts.
Nonetheless, Thursday's policy statement and press conference should leave investors still expecting the first cut in ECB interest rates next quarter. Timing-wise, the Governing Council will want to have at least some idea of how the 2024 wage negotiations are going as well as further evidence of declining underlying inflation. This suggests that the next couple of meetings in March and April would be too soon to cut, although the release of updated economic forecasts at the former could well have an important impact on market expectations.
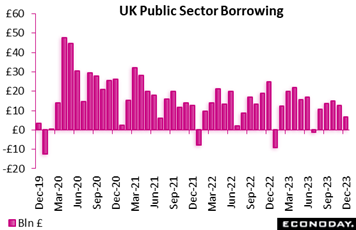 Public sector finances in the UK were in a much better state than expected in December. Overall public sector net borrowing (PSNB) weighed in at just £6.85 billion, some £5.65 billion less than the market consensus and that following a downwardly revised £13.71 billion in November. Compared with a year ago, the deficit fell nearly £8.3 billion. Excluding public sector banks (PSNB-X), the shortfall stood at £7.77 billion after £13.71 billion in the previous month and £16.17 billion at the end of 2022. These are the lowest December borrowing figures since 2019 and £14.0 billion less than forecast by the independent Office for Budgetary Responsibility. Public sector finances in the UK were in a much better state than expected in December. Overall public sector net borrowing (PSNB) weighed in at just £6.85 billion, some £5.65 billion less than the market consensus and that following a downwardly revised £13.71 billion in November. Compared with a year ago, the deficit fell nearly £8.3 billion. Excluding public sector banks (PSNB-X), the shortfall stood at £7.77 billion after £13.71 billion in the previous month and £16.17 billion at the end of 2022. These are the lowest December borrowing figures since 2019 and £14.0 billion less than forecast by the independent Office for Budgetary Responsibility.
Much of the improvement was due to lower borrowing costs as debt interest payable dropped by fully £14.1 billion from a year ago to £4.0 billion. However, much of the fall here was offset by a sharp jump in investment as the December 2022 data were impacted by a significant student loans update. Still, receipts were up £5.0 billion, mainly on the back of higher VAT inflows. Public sector net debt (PSND-X) was £2.686 trillion or around 97.7 percent of GDP. This was 1.9 percentage points higher than in the previous December and sustains levels last seen in the early 1960s.
At £119.1 billion, the PSNB-X over the financial year to date was £11.1 billion larger than over the same period in FY2022/23 and the fourth highest ever. However, the surprisingly low December results will boost expectations for a pre-election giveaway budget in March, a point that will not be wasted on the BoE.
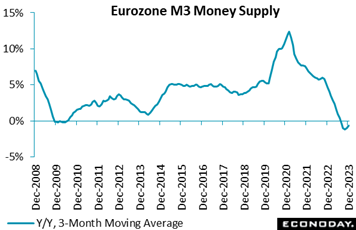 Annual broad money growth in the Eurozone moved back above zero in December for the first time since last June. At 0.1 percent, the year-end rate was up from November's unrevised minus 0.9 percent and strong enough to boost the headline 3-month moving average rate from minus 1.0 percent to minus 0.6 percent. This was 0.3 percentage points above the market consensus. On the month, M3 expanded 0.7 percent following a 0.2 percent gain previously. Annual broad money growth in the Eurozone moved back above zero in December for the first time since last June. At 0.1 percent, the year-end rate was up from November's unrevised minus 0.9 percent and strong enough to boost the headline 3-month moving average rate from minus 1.0 percent to minus 0.6 percent. This was 0.3 percentage points above the market consensus. On the month, M3 expanded 0.7 percent following a 0.2 percent gain previously.
The rebound in the annual rate was largely attributable to narrow money M1 which saw an 8.5 percent drop following a 9.5 percent slide in mid-quarter. Among the M3 counterparts, private sector loans rose 0.3 percent on the year, up from 0.1 percent. After adjustment for loan sales and securitisation as well for positions due to notable cash pooling services, the rate was a tick firmer at 0.5 percent. Within this, adjusted loans to households (0.3 percent after 0.5 percent) slowed further but borrowing by non-financial corporations (0.4 percent after 0.0 percent) accelerated for the first time since September 2022.
The December data mean that M3 has expanded in three of the last four months. The trend remains modest and households are still tightening their belts but the signs are that monetary conditions are stabilising and lower bond yields are helping to underpin loan demand.
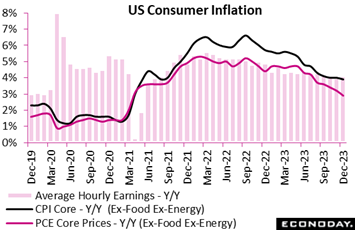 December consumer prices are old news, but not when it comes to the PCE price indexes which are the central inflation gauges for the US Fed. The annual rates of 2.6 percent overall and 2.9 percent for the ex-food ex-energy core were both lower expected and are now both below the 3 percent line and continuing their apparent march, and for the PCE core an accelerated march, toward the magical two percent line. With both employment and GDP holding strong, the Fed will feel little urgency to begin cutting rates though, against the historical background of persistent disinflation seen over the prior decade, there is the risk that policy in the end could return to fighting the lower bound, that is keeping rates near zero in a stopgap attempt to stimulate inflation. December consumer prices are old news, but not when it comes to the PCE price indexes which are the central inflation gauges for the US Fed. The annual rates of 2.6 percent overall and 2.9 percent for the ex-food ex-energy core were both lower expected and are now both below the 3 percent line and continuing their apparent march, and for the PCE core an accelerated march, toward the magical two percent line. With both employment and GDP holding strong, the Fed will feel little urgency to begin cutting rates though, against the historical background of persistent disinflation seen over the prior decade, there is the risk that policy in the end could return to fighting the lower bound, that is keeping rates near zero in a stopgap attempt to stimulate inflation.
Hawks, however, can switch their focus from the PCEs to the CPIs which are running substantially hotter, a full percentage point higher for the core at 3.9 percent. Gauging policy by the CPI would, of course, push back the need to cut rates and would better match the public’s understanding of inflation which remains a central, it not top, concern going into the election. Though the CPI is used by government and many businesses for annual pay adjustments, its methodology is less robust than the PCE which tracks a more complete basket of consumer prices and where adjustments to component weightings are more frequent. For the doves, the PCE in theory could be hinting that disinflation may be just over the horizon.
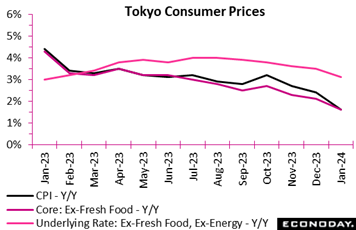 Consumer inflation in Tokyo, the leading indicator of the national average, eased at a much faster pace than expected in January in all three key measures as food price markups lost more steam, utility subsides continued to trim energy bills and hotel charges slowed sharply. Consumer inflation in Tokyo, the leading indicator of the national average, eased at a much faster pace than expected in January in all three key measures as food price markups lost more steam, utility subsides continued to trim energy bills and hotel charges slowed sharply.
The core CPI (excluding fresh food), the key measure for the Bank of Japan’s policy decisions, posted a 22-month low at 1.6 percent on year, slowing further from 2.1 percent in December. The total CPI also dipped a 22-month low of 1.6 percent from 2.4 percent, while the core-core CPI (excluding fresh food and energy) moderated to an 11-month low of 3.1 percent from 3.5 percent. Service prices had risen twice as fast as goods prices but they both slowed from December.
Service prices rose twice as fast as goods prices but they both slowed from December. If firms can pass through higher labor costs to sales prices, it could lead to more sustained wage hikes, which in turn would convince Bank of Japan policymakers to unwind monetary policy stimulus later this year.
The government said in its monthly economic report in the week that Japan still needs monetary and fiscal stimulus and growth strategies to keep itself from falling back into deflation, repeating its request first made in May 2022 that the BoJ should "achieve the price stability target of 2 percent in a sustainable and stable manner, accompanied by wage increases."
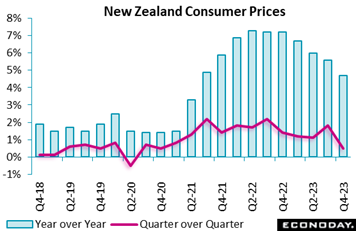 New Zealand consumer prices rose 4.7 percent on the year in the fourth quarter, down from 5.6 percent in the third quarter and matching Econoday’s consensus. Headline inflation has now been above the Reserve Bank of New Zealand's target range of one percent to three percent for eleven consecutive quarters but is at its lowest level since late 2021. The index advanced 0.5 percent on the quarter after increasing 1.8 previously, also matching the consensus. New Zealand consumer prices rose 4.7 percent on the year in the fourth quarter, down from 5.6 percent in the third quarter and matching Econoday’s consensus. Headline inflation has now been above the Reserve Bank of New Zealand's target range of one percent to three percent for eleven consecutive quarters but is at its lowest level since late 2021. The index advanced 0.5 percent on the quarter after increasing 1.8 previously, also matching the consensus.
Cooling was largely centered in transport costs, which fell 0.3 percent on the year after a previous increase of 7.1 percent, and food prices, down 1.2 percent on the year after a previous increase of 0.9 percent. Housing costs also grew at a slower pace, offset by stronger increases in communication, health costs and clothing prices.
At the RBNZ's last policy meeting, held late November, officials left policy rates on hold at 5.50 percent, extending the pause in the tightening that has been in place since mid-2023. Officials still expected inflation would decline back to the target range in the second half of 2024 but underscored the risk that price pressures would not slow as much as expected.
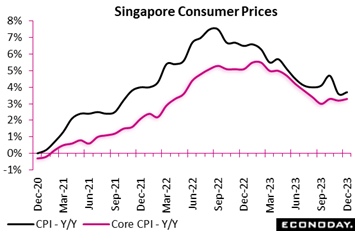 Singapore's headline consumer price index rose 3.7 percent on the year in December, up slightly from 3.6 percent in November, which had been the lowest inflation rate since October 2021. The Monetary Authority of Singapore's preferred measure of core inflation, which excludes the cost of accommodation and private road transport, also picked up slightly from 3.2 percent in November to 3.3 percent in December. Singapore's headline consumer price index rose 3.7 percent on the year in December, up slightly from 3.6 percent in November, which had been the lowest inflation rate since October 2021. The Monetary Authority of Singapore's preferred measure of core inflation, which excludes the cost of accommodation and private road transport, also picked up slightly from 3.2 percent in November to 3.3 percent in December.
Steady core inflation in December reflected offsetting moves across major categories. Electricity and gas prices rose 1.3 percent on the year after a previous increase of 1.5 percent, while the year-over-year increase in retail and other goods prices picked up from 1.0 percent to 1.1 percent. Private transport costs rose 5.0 percent on the year after increasing 4.2 percent previously, while food price inflation moderated from 4.0 percent to 3.7 percent.
At their semi-annual policy review in October, MAS officials left policy settings unchanged by continuing to target the prevailing rate of appreciation in the exchange rate. Assessing December’s results, officials again highlighted both upside and downside risks to the outlook for core inflation and noted that it will be impacted by an impending increase in the goods and services tax rate. Nevertheless, they again expressed confidence that underlying price pressures will "resume a broadly moderating trend" after the impact of the tax increase.
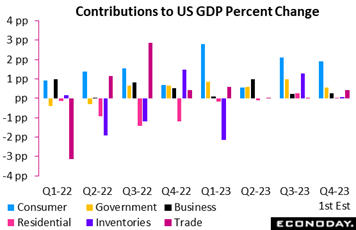 The advance estimate of fourth quarter GDP rose at an annualized 3.3 percent pace, slowing from 4.9 percent in the third quarter but well above the consensus forecast of 2.0 percent growth in the Econoday survey. The main GDP components made positive contributions across the board and ended 2023 on an up note with strong consumer and government spending, and less impact from higher interest rates than might be expected. The advance estimate of fourth quarter GDP rose at an annualized 3.3 percent pace, slowing from 4.9 percent in the third quarter but well above the consensus forecast of 2.0 percent growth in the Econoday survey. The main GDP components made positive contributions across the board and ended 2023 on an up note with strong consumer and government spending, and less impact from higher interest rates than might be expected.
The largest contribution to GDP was from personal consumption expenditures (1.91 percentage points) which rose at a 2.8 percent pace in the fourth quarter, just below 3.1 percent in the third quarter. Fourth-quarter spending on durable goods rose 4.6 percent compared to 6.7 percent growth in the third quarter, nondurables rose 3.4 percent compared to 3.9 percent, and services gained 2.4 percent compared to 2.2 percent. Spending on durables and nondurables eased from the prior quarter, but not services. Bringing down the cost of services has been the Fed's main challenge in addressing inflation through restrictive monetary policy. It isn't clear whether consumers were more active in purchasing services in the fourth quarter, or if the services they were buying were more expensive, or some of both.
Government consumption expenditures rose 3.3 percent in the fourth quarter after gaining 5.8 percent in the third quarter and made the second largest contribution to growth (0.56) among the main categories.
Despite higher rates for financing purchases, gross investment rose 2.1 percent after rising 10.0 percent in the third quarter and made a solid positive contribution to the quarter's growth (0.38). It seems there was a rush to lock in lower rates for borrowing for investment in infrastructure earlier in 2023, but that did not stop some activity in the fourth quarter. However, it is notable that residential fixed investment tapered off sharply to up 1.1 percent in the fourth quarter after a 6.7 percent jump in the third quarter. Homebuyers in the fourth quarter had to contend with mortgage rates at over 20-year highs and prices that remained elevated.
Net exports added to growth while private inventories were nearly unchanged, making only a marginal contribution.
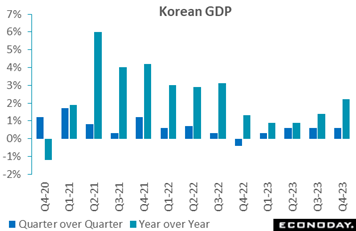 Advance estimates for South Korean GDP show the economy expanded at a steady pace in the fourth quarter. GDP rose 0.6 percent on the quarter, as it did in the fourth quarter, with year-over-year growth picking up from 1.4 percent to 2.2 percent. Steady fourth-quarter growth reflected offsetting moves in major components. Private consumption rose 0.2 percent on the quarter, moderating from growth of 0.3 percent previously, investment fell 1.4 percent after advancing 0.5 percent previously, and government consumption rose 0.4 percent after a previous increase of 0.2 percent. Exports and imports both grew at a slower pace. Advance estimates for South Korean GDP show the economy expanded at a steady pace in the fourth quarter. GDP rose 0.6 percent on the quarter, as it did in the fourth quarter, with year-over-year growth picking up from 1.4 percent to 2.2 percent. Steady fourth-quarter growth reflected offsetting moves in major components. Private consumption rose 0.2 percent on the quarter, moderating from growth of 0.3 percent previously, investment fell 1.4 percent after advancing 0.5 percent previously, and government consumption rose 0.4 percent after a previous increase of 0.2 percent. Exports and imports both grew at a slower pace.
At their most recent policy meeting earlier this month, officials at the Bank of Korea left policy rates on hold at 3.50 percent, as they have since the start of 2023. This decision reflected officials' assessment that "inflation is projected to maintain its slowing trend". Officials also expressed confidence about the outlook for growth in 2024.
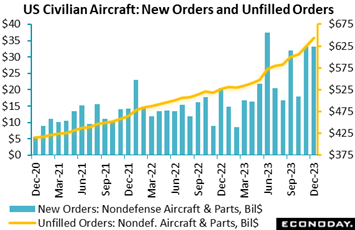 Boeing’s door-plug plunge earlier in the month has snowballed into a fiasco leading to production delays and a pile-up in backlogs. Unfilled orders for commercial aircraft (nondefense aircraft & parts) rose 3.2 percent in December to match similar gains in recent month; year-over-year, unfilled orders for this category were up 22.2 percent at $644.7 billion. This would be a positive for the aerospace sector were it not for the threat of cancellations. Boeing’s door-plug plunge earlier in the month has snowballed into a fiasco leading to production delays and a pile-up in backlogs. Unfilled orders for commercial aircraft (nondefense aircraft & parts) rose 3.2 percent in December to match similar gains in recent month; year-over-year, unfilled orders for this category were up 22.2 percent at $644.7 billion. This would be a positive for the aerospace sector were it not for the threat of cancellations.
New orders for total durable goods orders were flat in December though when excluding transportation equipment, which includes aircraft, orders rose 0.6 percent, twice as much as the highest forecast. Core capital goods orders (nondefense ex-aircraft) were also stronger than expected, as they increased 0.3 percent against a consensus for a 0.2 percent decline.
Transportation equipment fell 0.9 percent in December following a 15.3 percent rebound in November that offset October's 13.4 percent plunge. While defense aircraft and parts decreased 2.9 percent, commercial aircraft and parts increased 0.4 percent, as did new orders of motor vehicles and parts.
Also supporting core new orders were a 1.8 percent increase in electrical equipment, a 0.4 percent advance in computers and electronics, as well as gains of 0.2 percent in machinery, 0.9 percent in fabricated metal products, and 1.4 percent in primary metals.
Unfilled orders were up another 1.3 percent in December, but just 0.2 percent excluding transportation. Inventories rose 0.4 percent while shipments were down 0.3 percent after rising 1.0 percent the previous month.
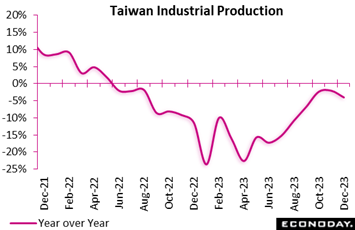 Taiwan's industrial production index fell 3.99 percent on the year in December, weakening further from the decline of 2.05 percent in November and extending the contraction in output seen since mid-2022. Output in the manufacturing sector fell 4.19 percent on the year in December after a decline of 2.18 percent in November, in line with the ongoing weakness in the sector shown in previously published PMI survey data. December's data also show year-over-year declines in the utilities and mining sectors. Taiwan's industrial production index fell 3.99 percent on the year in December, weakening further from the decline of 2.05 percent in November and extending the contraction in output seen since mid-2022. Output in the manufacturing sector fell 4.19 percent on the year in December after a decline of 2.18 percent in November, in line with the ongoing weakness in the sector shown in previously published PMI survey data. December's data also show year-over-year declines in the utilities and mining sectors.
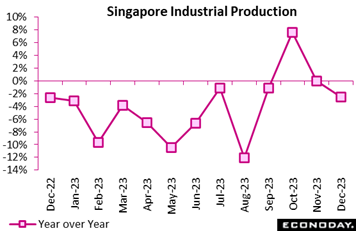 Singapore industrial production fell at a less pronounced pace in December, with output down 1.7 percent on the month after falling 8.0 percent in November. Previously published trade data showed weaker growth in exports in December, whereas PMI survey data showed ongoing strength in the aggregate economy. In year-over-year terms, industrial production fell 2.5 percent on the year in December after no change in November. Singapore industrial production fell at a less pronounced pace in December, with output down 1.7 percent on the month after falling 8.0 percent in November. Previously published trade data showed weaker growth in exports in December, whereas PMI survey data showed ongoing strength in the aggregate economy. In year-over-year terms, industrial production fell 2.5 percent on the year in December after no change in November.
Excluding the biomedical industry, where output is often volatile, year-over-year growth slowed from an increase of 1.1 percent in November to an increase of 0.5 percent in December. Output in the electronics industry rose 6.3 percent on the year after advancing 5.1 percent previously, with output also growing at a stronger pace in the chemicals industry, falling at a less pronounced pace in the precision engineering industry, and weakening in the transport engineering and general manufacturing industries.
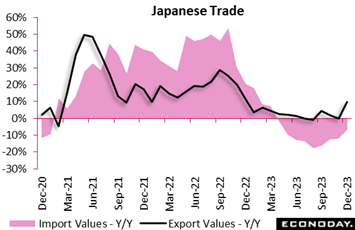 Japanese export values rebounded 9.8 percent on year to a record high in December, beating the 9.0 percent consensus and led by automobiles as largely expected. Import values fell for the ninth straight month as energy prices remained below year-earlier levels and demand for Covid drugs has waned, but the pace of decrease decelerated to 6.8 percent from 11.9 percent. Japanese export values rebounded 9.8 percent on year to a record high in December, beating the 9.0 percent consensus and led by automobiles as largely expected. Import values fell for the ninth straight month as energy prices remained below year-earlier levels and demand for Covid drugs has waned, but the pace of decrease decelerated to 6.8 percent from 11.9 percent.
The trade balance recorded a surplus of ¥62.1 billion for the first positive figure in three months. This compares with a ¥780.35 billion deficit in November and a ¥1.50 billion shortfall a year earlier.
Shipments to China, one of the key export markets for Japanese goods, posted their first year-over-year increase in 13 months in December and reached the second highest on record. Japanese exports to the European Union rebounded after showing their first year-over-year drop in 33 months in November while exports to the US remained strong, rising to a record high.
For the whole of 2023, Japanese exports posted the third straight annual increase, up 2.8 percent to a record high, following an 18.2 percent rise in 2022. By contrast, imports marked the first drop in three years, down 7.0 percent after surging 39.6 percent in the previously year. The annual trade balance recorded a deficit of ¥9.29 trillion for the third consecutive shortfall, but it narrowed to less than half of the ¥20.3 trillion deficit in 2022.
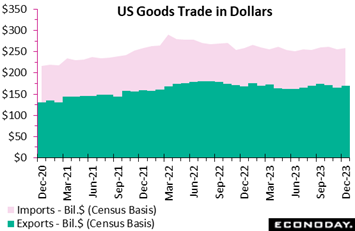 After two months of declines, exports of US goods rose $4.1 billion or 2.5 percent to $169.8 billion in December to help narrow the US goods deficit by $0.8 billion to $88.5 billion. Imports worked against the balance, rising $3.2 billion or 1.3 percent to $258.3 billion. After two months of declines, exports of US goods rose $4.1 billion or 2.5 percent to $169.8 billion in December to help narrow the US goods deficit by $0.8 billion to $88.5 billion. Imports worked against the balance, rising $3.2 billion or 1.3 percent to $258.3 billion.
Export details were led by sharp rebounds for both industrial supplies, up 4.9 percent, and foods, feeds & beverages which rose 4.8 percent. Consumer goods also gained as did "other goods" but unwanted declines were posted for both autos, down 3.3 percent which is a weak export category for the US, and also capital goods which is a strong category that fell 0.5 percent after rising only 0.1 percent in November.
Imports of capital goods also fell, down 0.8 percent in what is not a positive indication for domestic business investment. This follows November's even sharper 1.0 percent decline. Imports of industrial supplies rose 1.8 while imports of consumer goods rebounded 5.4 percent following, however, the prior month's 6.4 percent decline. Imports of vehicles, which had been very strong through mid-year, fell 1.1 percent after falling 0.5 percent in November.
December's data were folded into the first estimate for first-quarter GDP where net exports made a substantially positive 0.43 percentage point contribution to the quarter's 3.3 percent annualized growth.
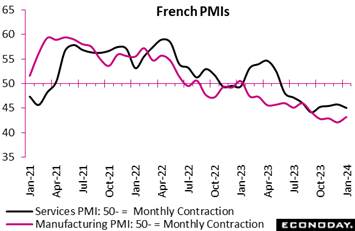 French business activity contracted further at the start of the year and by more than expected. At just 44.2, the flash composite output index was a full point short of the market consensus, 0.6 points shy of its final December print and nearly 6 points below the 50-expansion threshold. This was also its worst reading in four months. French business activity contracted further at the start of the year and by more than expected. At just 44.2, the flash composite output index was a full point short of the market consensus, 0.6 points shy of its final December print and nearly 6 points below the 50-expansion threshold. This was also its worst reading in four months.
The headline drop mainly reflected additional weakness in services where the flash sector PMI dropped from a final 45.7 at year-end to 45.0, also a 4-month trough. Its manufacturing counterpart actually edged up from 42.1 to 43.2 but, within this, output (40.5 after 40.7) declined at its steepest rate in three-and-a-half years.
Aggregate new orders decreased for a ninth straight month and backlogs were down for a sixth. Employment was similarly trimmed for a third month in a row, although the fall here was only marginal. Business expectations about the coming year deteriorated and so remained well below their historic norm.
Even so, inflationary pressures were a little firmer. Input costs rose at a sharper pace, in part due to higher wages, but the inflation rate was still quite modest. Output prices similarly accelerated, climbing by the most in the last seven months.
In sum, the January update paints a miserable picture of the French economy and points to a weak first quarter for GDP.
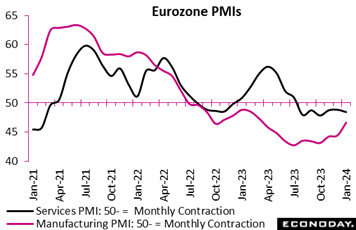 Business activity for the Eurozone as a whole performed much as expected at the start of the year. At 47.9, the flash composite output index was just 0.1 point short of the market consensus and 0.3 points above its final reading in December. Although still well shy of the 50-expansion threshold, the latest print was the highest in six months. Business activity for the Eurozone as a whole performed much as expected at the start of the year. At 47.9, the flash composite output index was just 0.1 point short of the market consensus and 0.3 points above its final reading in December. Although still well shy of the 50-expansion threshold, the latest print was the highest in six months.
The headline improvement was wholly attributable to manufacturing where the flash sector PMI climbed from a lowly final 44.4 at year-end to 46.6, well above expectations and a 10-month peak. By contrast, its services counterpart fell from 48.8 to 48.4, a 3-month trough.
Aggregate new orders decreased again and, ominously, continued to do so at a faster pace than output. Consequently, production levels would have been weaker but for backlogs which were trimmed for an 18th time in the last 19 months. Purchasing activity also declined further but employment saw a small rise and business expectations about the coming year were the most optimistic since last May. That said, the latest level was still below its pre-pandemic mark.
Supplier delivery times lengthened for the first time in a year, in large part due to the disruptions to shipping traffic caused by military developments in the Red Sea. This contributed to the highest rate of input cost inflation since last May. The output price rate followed suit having touched a 32-month low last October.
In sum, the January update points to no improvement in overall Eurozone economic conditions and warn of another poor quarter for both output and demand.
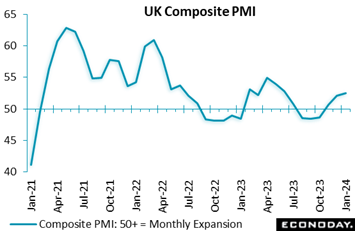 The UK economy is showing surprising strength at the start of 2024. The flash composite output index climbed from December’s final at 52.1 to a preliminary January reading of 52.5, just above Econoday’s consensus, its third straight reading above the 50-expansion threshold and its best print since last June. The UK economy is showing surprising strength at the start of 2024. The flash composite output index climbed from December’s final at 52.1 to a preliminary January reading of 52.5, just above Econoday’s consensus, its third straight reading above the 50-expansion threshold and its best print since last June.
However, while conditions in manufacturing were not as weak as in the previous month, growth for the composite was again wholly attributable to services. Here the flash weighed in at 53.8, up from December's final 53.4 and an 8-month high. In manufacturing, the PMI rose from 46.2 to 47.3, a 9-month peak but still short of the 50 mark.
Aggregate new orders increased moderately despite continued soft overseas demand and this helped employment to post its first gain in five months. Output remains supported by falling backlogs but business expectations for the year ahead improved to their best level since May 2023 - and that despite lengthening vendor delivery times (longest since September 2022) caused by disruptions to traffic in the Red Sea.
To this end, input costs posted their steepest rise since last August. However, output charges remained relatively subdued and charge inflation was the lowest since last October.
January's update suggests pressure on the BoE to cut interest rates may not be quite as strong as originally thought. Manufacturing remains in the doldrums but the rate of decline seems to be easing and services are holding up well. Moreover, pipeline inflation signals are looking rather more ominous. A reduction in Bank Rate this quarter would now appear all the less likely.
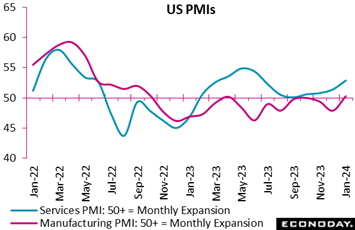 In contrast to the notable weakness reported by US regional surveys so far this month, January's manufacturing PMI actually rose sharply, up 2.4 points to a 50.3 level that exceeded Econoday's consensus by 2.6 points. This is the best reading since October 2022. In contrast to the notable weakness reported by US regional surveys so far this month, January's manufacturing PMI actually rose sharply, up 2.4 points to a 50.3 level that exceeded Econoday's consensus by 2.6 points. This is the best reading since October 2022.
The services PMI likewise outperformed, rising 1.6 points to a 52.9 for its best reading since June last year. This was 1.9 points better than Econoday's consensus.
The manufacturing sample reported a broad-based gain in new orders at the fastest rate since May 2022. Output was likewise solid, rising at the best pace since June 2023. In an interesting note, the sample cited the risk of shortages tied to "challenging trucking conditions" according to the report as well as other undefined "transportation delays" that could be referring to troubles in the Red Sea.
How the manufacturing results will affect forecasts for the ISM report will be interesting to watch. This report would point to a gain from the ISM's 47.4 December score, in line perhaps with the Philadelphia Fed (slightly less contraction) but not the Richmond Fed (slightly more contraction) and especially the Empire State report (much deeper contraction). For services, where the PMI sample reported the best order rate in seven months, January's data clearly signals acceleration for the ISM's index which sat at 50.6 in December.
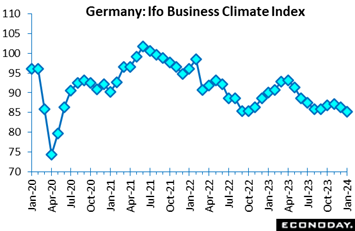 Ifo's January survey was softer than expected. At 85.2 the overall climate indicator was 1.6 points short of the market consensus and more than a full point below December's downwardly revised 86.3. The latest reading was the worst since May 2020 and historically very weak. Ifo's January survey was softer than expected. At 85.2 the overall climate indicator was 1.6 points short of the market consensus and more than a full point below December's downwardly revised 86.3. The latest reading was the worst since May 2020 and historically very weak.
Current conditions shed 1.5 points to 87.0, a second successive drop and their lowest mark since July 2020. Expectations compounded December's 0.9 point fall with a 0.7 point decline to 83.5. However, while also well below their long-run average, this was only a 2-month trough following modest gains in September-through November last year.
Outside of manufacturing (minus 16.0 after minus 17.4), at a sector level sentiment deteriorated across the board. Hence, there were losses in services (minus 4.9 after minus 1.7), trade (minus 29.7 after minus 26.7) and construction (minus 35.9 after minus 33.5).
The January results are disappointingly soft but consistent with the sluggish picture of the German economy. On the consumer side, Germany’s consumer climate index echoed Ifo’s results, falling to an unexpected low of minus 29.7 in a forward indication for the month of February. There are now more reasons for expecting a contraction in first quarter GDP. Watch for the first estimate of fourth-quarter GDP on Wednesday of the coming week where Econoday’s consensus is 0.3 percent contraction on the quarter and 0.2 percent contraction on the year.
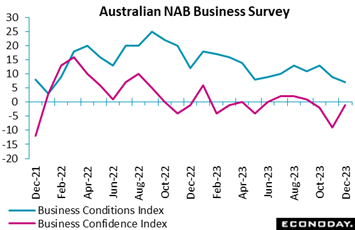 The NAB business survey for Australia showed weaker business conditions but less pronounced weakness in business confidence in December after officials at the Reserve Bank of Australia left policy rates on hold early that month. A separate survey providing more up-to-date consumer confidence data showed consumer sentiment weakened at the start of January. The NAB business survey for Australia showed weaker business conditions but less pronounced weakness in business confidence in December after officials at the Reserve Bank of Australia left policy rates on hold early that month. A separate survey providing more up-to-date consumer confidence data showed consumer sentiment weakened at the start of January.
The NAB survey's business conditions index fell from 9 in November to 7 in December, its lowest level since early 2022. Respondents reported weaker trading conditions and employment, less pronounced weakness in forward orders, and steady profitability. The survey also showed more subdued price pressures, with its measure of quarterly change in labour costs, purchase costs, and retail prices all increasing at a slower pace
The survey's business confidence index rose from minus 8 in November, its lowest level since late 2021, to minus 1 in December. This improvement was broad-based across sectors but the index remains well below its long-term average.
Global economic data are trending at the top end of the consensus ranges reflected in the Relative Performance Index (RPI) at 8 and the index less prices (RPI-P) at 10, both a bit above the zero line representing as-expected performance.
The US at 22 on the RPI and 24 for the RPI-P continue to lead other economies, benefiting in the latest week from the fourth quarter’s surprisingly strong 3.3 percent GDP growth. With the jobs market healthy and consumer spending strong, the Federal Reserve may see little reason to cut interest rates anytime soon.
Last week’s decision by the European Central Bank to leave policy on hold was widely anticipated and a reflection of recent data largely living up to expectations. Since the central bank’s prior meeting in December, the region’s RPI has averaged just 2 and the RPI-P 9, both values close enough to zero to indicate overall economic activity moving essentially in line with forecasts. The first cut in key interest rates remains crucially dependent on upcoming inflation news (flash January report due Thursday) and wage developments.
In the UK, early warnings signs of a surprisingly weak economy in January ensured that both the RPI (minus 7) and, more clearly, the RPI-P (minus 20) ended the week below zero. Still, since the Bank of England’s December meeting upside and downside shocks have broadly cancelled each other, supporting a strong market conviction that Bank Rate will not be cut on Thursday.
In Japan, the BoJ’s decision to leave policy on hold last week came as no surprise to anyone. Moreover, with the economy and, crucially, inflation falling short of expectations, the decision is justified by the latest data. At minus 14 and minus 17 respectively, both the Japanese RPI and RPI-P point to a modest degree of overall underperformance.
There were no significant economic data out of China last week but the unusual pre-announcement of a cut in banks’ reserve ratios next month underscored policymakers’ concerns about the health of the local economy. At currently zero and 10 respectively, the Chinese RPI and RPI-P show activity in general largely meeting forecasts but those projections were already weak.
There were also no significant data out of Canada whose central bank kept policy steady in the week but softened its hawkish tone amid sluggish economic growth; both the RPI and RPI-P are holding in the negative single digits.
**Contributing to this article were Jeremy Hawkins, Brian Jackson, Mace News, Max Sato, and Theresa Sheehan
Neither the Federal Reserve on Wednesday nor the Bank of England on Thursday are expected to cut rates though hints on the timing of future cuts could be signaled. First estimates of fourth quarter GDP will unroll in Europe, first France and Italy then followed by the Eurozone, all on Tuesday and all expected to be flat at the very best.
And first estimates of January inflation will unroll on Wednesday beginning with Germany, which is seen slowing to 3.3 from 3.7 percent, and followed by the Eurozone where only marginal improvement is expected, from 2.9 to 2.8 overall and from 3.4 to 3.3 percent for the core. The employment cost index from the US, a key measure of wage inflation, will be posted the morning of the Fed’s announcement and is expected to cool slightly.
China’s official CFLP PMIs for the month of January will be posted on Wednesday amid expectations for little to no improvement. Not lost in the shuffle will be the US employment report, starting on Wednesday with ADP’s estimate followed on Friday by the report itself where a moderate but solid 150,000 rise in nonfarm payrolls is Econoday’s consensus.
Australia will post December consumer prices on Wednesday; Japan will post industrial production and retail sales for the month of December also on Wednesday.
Japanese Unemployment Rate for December (Tue 0830 JST; Mon 2330 GMT; Mon 1830 EST)
Consensus Forecast, Unemployment Rate: 2.5%
Japan's unemployment rate in December is expected to hold steady at 2.5 percent.
Australian Retail Sales for December (Tue 0030 GMT; Tue 1130 AEDT; Mon 1930 EST)
Consensus Forecast, Month over Month: -0.6%
Retail sales in December are expected to decrease 0.6 percent on the month after November’s stronger-than-expected 2.0 percent jump that benefited from strong Black Friday sales.
French Fourth-Quarter GDP, First Estimate (Tue 0630 GMT; Tue 0730 CET; Tue 0130 EST)
Consensus Forecast, Quarter over Quarter: -0.1%
Fourth-quarter GDP in France is expected to decrease a quarterly 0.1 percent for another quarter of flat results.
Italian Fourth-Quarter GDP, First Estimate (Tue 1000 CET; Tue 0900 GMT; Tue 0400 EST)
Consensus Forecast, Quarter over Quarter: 0.1%
Consensus Forecast, Year over Year: 0.3%
Fourth-quarter GDP is expected to contract 0.1 percent on the quarter but rise 0.3 percent on the year. GDP in the third quarter edged 0.1 percent higher both on the quarter and on the year.
Eurozone: EC Economic Sentiment for January (Tue 1100 CET; Tue 1000 GMT; Tue 0500 EST)
Consensus Forecast: 96.3
Consensus Forecast, Industry Sentiment: -9.0
Consensus Forecast, Consumer Sentiment: -16.1
Economic sentiment in January is expected to hold steady at 96.3 after December’s surprisingly strong 2.4-point jump to 96.4 which, in a report showing broad gains, was the strongest showing since April last year.
Eurozone Fourth-Quarter GDP, First Estimate (Tue 1000 GMT; Tue 1100 CET; Tue 0500 EST)
Consensus Forecast: Quarter over Quarter: -0.1%
Consensus Forecast, Year over Year: 0.1%
Fourth-quarter Eurozone GDP is expected to contract a quarterly 0.1 percent for year-over-year expansion of 0.1 percent. These would compare with the third quarter’s 0.7 percent quarterly decline and no change on the year.
US Consumer Confidence Index for January (Tue 1000 EST; Tue 1500 GMT)
Consensus Forecast: 112.5
The consumer confidence index is expected to rise further in January, to a consensus 112.5 versus 110.7 in December which was much higher than expected and up nearly 11 points from November.
Japanese Industrial Production for December (Wed 0850 JST; Tue 2350 GMT; Tue 1850 EST)
Consensus Forecast, Month over Month: 2.5%
Consensus Forecast, Year over Year: 0.1%
At a consensus gain of 2.5 percent on the month, industrial production in December is expected to get a lift from chip-making equipment and more than reverse November’s 0.9 percent decline that reflected declines for autos and general machinery. The government maintained its assessment in the November report that industrial output is “taking one step forward and one step back”.
Japanese Retail Sales for December (Wed 0850 JST; Tue 2350 GMT; Tue 1850 EST)
Consensus Forecast, Month over Month: -0.5%
Consensus Forecast, Year over Year: 5.3%
December sales growth is expected to hold steady at 5.3 percent on the year versus November’s 5.4 percent. The government maintained its assessment in December that retail sales are “on an uptrend”.
Australian December and Quarterly CPI (Wed 1130 AEDT; Wed 0030 GMT; Tue 1930 EST)
Consensus Forecast Monthly, Year over Year: 3.6%
Consensus Forecast Quarterly, Quarter over Quarter: 0.8%
Consensus Forecast Quarterly, Year over Year: 5.4%
Consumer prices in December are expected to slow to 3.6 percent year-over-year versus a lower-than-expected 4.3 percent in November and against 4.9 percent in October. Fourth-quarter consumer prices are expected to rise 0.8 percent on the quarter and 4.3 percent on the year. These would mark slowing from third-quarter rates of 1.2 and 5.4 percent.
China: CFLP PMIs for January (Wed 0930 CST; Wed 0130 GMT; Tue 2030 EST)
Manufacturing PMI, Consensus Forecast: 49.3
Non-manufacturing PMI, Consensus Forecast: 50.5
The CFLP manufacturing PMI is expected to increase slightly to 49.3 in January from December’s 49.0 which was lower than expected and down from November’s 49.4. The non-manufacturing PMI, which in December was flat at an as-expected 50.4, is expected to hold little changed at 50.5.
German Retail Sales for December (Wed 0800 CET; Wed 0700 GMT; Wed 0200 EST)
Consensus Forecast, Month over Month: 1.0%
Retail sales volumes are expected to rise 1.0 percent on the month in December versus November’s dismal and far lower-than-expected 2.5 percent fall.
German Unemployment Rate for January (Wed 0955 CET; Wed 0855 GMT; Wed 0355 EST)
Consensus Forecast: 5.9%
January’s unemployment rate is expected to hold steady at December’s as-expected 5.9 percent rate.
German Fourth-Quarter GDP, First Estimate (Wed 0900 GMT; Wed 1000 CET; Wed 0400 EST)
Consensus Forecast, Quarter over Quarter: -0.3%
Consensus Forecast, Year over Year: -0.2%
The flash estimate for fourth-quarter GDP is quarter-over-quarter contraction of 0.3 percent and year-over-year contraction of 0.2 percent. This would compare with respective third-quarter contraction of 0.1 and 0.4 percent. German GDP has been essentially flat since fourth-quarter 2022.
German CPI, Preliminary January (Wed 1400 CET; Wed 1300 GMT; Wed 0800 EST)
Consensus Forecast, Month over Month: 0.5%
Consensus Forecast, Year over Year: 3.3%
January’s consensus is cooling to 3.3 percent versus 3.7 percent in December which, for the first time since June, was up from the prior month’s 3.2 percent.
US ADP Private Payrolls for January (Thu 0815 EST; Thu 1315 GMT)
Consensus Forecast: 130,000
Forecasters see ADP's January employment number at 130,000. This would compare with December growth in private payrolls reported by the Bureau of Labor Statistics of 164,000. ADP’s number for December was 164,000.
Canadian Monthly GDP for November (Wed 0830 EST; Wed 1330 GMT)
Consensus Forecast, Month over Month: 0.1%
After no change in both October and September, GDP in November is expected to rise 0.1 percent.
US Fourth-Quarter Employment Cost Index (Wed 1330 GMT; Fri 0830 EST)
Consensus Forecast, Quarter over Quarter: 1.0%
After the third quarter's 1.1 percent increase, forecasters see employment costs edging lower to 1.0 percent in the fourth quarter.
US Federal Reserve Announcement (Wed 1900 GMT; Wed 1400 EST)
Consensus Forecast, Policy Rate Change: 0 basis points
Consensus Forecast, Target Range: 5.25% to 5.50%
After raising the possible number of future rate cuts but keeping rates unchanged in December, the Fed against the backdrop of strong employment and solid growth is expected to once again keep rates unchanged at the January meeting.
China: S&P Manufacturing PMI for January (Thu 0945 CST; Thu 0145 GMT; Wed 2045 EST)
Consensus Forecast: 50.9
After a steady and marginally positive 50.8 in December, which nevertheless was a half point better than expected, S&P's manufacturing PMI is expected to hold little changed in January at 50.9.
Eurozone HICP Flash for January (Thu 1000 GMT; Thu 1100 CET; Thu 0500 EST)
Consensus Forecast, Year over Year: 2.8%
Narrow Core
Consensus Forecast, Year over Year: 3.3%
Consensus for January’s HICP flash is 2.8 percent and 3.3 percent for the narrow core. These would compare respectively with December’s 2.9 and 3.4 percent, the former up from November’s 2.4 percent but the latter down from 3.6 percent.
Eurozone Unemployment Rate for December (Thu 1100 CET; Thu 1000 GMT; Thu 0500 EST)
Consensus Forecast: 6.5%
Consensus for December's unemployment rate is a 1 tenth rise to 6.5 percent. Unemployment in the Eurozone has been running at record lows.
Bank of England Announcement (Thu 1300 GMT; Thu 0700 EST)
Consensus Forecast, Change: 0 basis points
Consensus Forecast, Level: 5.25%
Having paused for three straight meetings, the Bank of England is expected to hold policy steady for a fourth straight month.
US: ISM Manufacturing Index for January (Thu 1000 EST; Thu 1500 GMT)
Consensus Forecast: 47.4
The ISM manufacturing index has been in contraction the last 14 months and is expected to remain so in January, at a consensus 47.4 which would be unchanged from December.
Korean CPI for January (Fri 0800 KST; Thu 2300 GMT; Thu 1800 EST)
Consensus Forecast, Year over Year: 3.1%
Consumer prices in January, which in December eased slightly to 3.2 percent from November’s 3.3 percent, are expected to edge further lower to 3.1 percent.
French Industrial Production for December (Fri 0745 GMT; Fri 0845 CET; Fri 0245 EST)
Consensus Forecast, Month over Month: 0.2%
December production is expected to rise 0.2 percent on the month after rising 0.5 in November which was the first monthly increase since July.
US Employment Situation for January (Fri 0830 EST; Fri 1330 GMT)
Consensus Forecast: Change in Nonfarm Payrolls: 170,000
Consensus Forecast: Unemployment Rate: 3.8%
Consensus Forecast: Average Hourly Earnings M/M: 0.3%
Consensus Forecast: Average Hourly Earnings Y/Y: 4.1%
A 170,000 rise is the call for nonfarm payroll growth in January versus 216,000 in December which was above expectations. Average hourly earnings in January are expected to rise 0.3 percent on the month for a year-over-year rate of 4.1 percent; these would compare with December’s rates of 0.4 and 4.1 percent which were both higher than expected. January’s unemployment rate is expected to rise to 3.8 percent from December’s 3.7 percent which was lower than expected.
|
