|
Markets have appeared unfazed by a continuing round of cautious comments from central bankers who, particularly in the US, are saying they are in no rush to cut interest rates and want more evidence that inflation has cooled. Nevertheless, investors appear confident the pivot to lower rates is coming, if later than expected. The week’s run of global news included steady policy decisions, mostly moderating rates of inflation, solid employment results, not-so-solid consumer spending results, and a mixed bag of production reports.
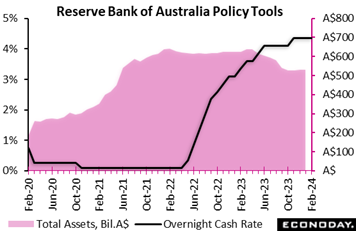 The Reserve Bank of Australia left its main policy rate, the cash rate, unchanged at 4.35 percent on Tuesday, in line with the consensus forecast. Officials increased this rate by 25 basis points in November but have otherwise left it unchanged since mid-2023, reflecting an assessment that aggressive policy tightening over the previous twelve months will have the effect of returning inflation to within their target range of two percent to three percent. The Reserve Bank of Australia left its main policy rate, the cash rate, unchanged at 4.35 percent on Tuesday, in line with the consensus forecast. Officials increased this rate by 25 basis points in November but have otherwise left it unchanged since mid-2023, reflecting an assessment that aggressive policy tightening over the previous twelve months will have the effect of returning inflation to within their target range of two percent to three percent.
In their statement, officials noted that "inflation continues to moderate but remains high". The most recent monthly CPI data showed a fall in headline inflation from 4.3 percent in November to 3.4 percent in December, with quarterly measures also showing a fall in headline and underlying rates. Officials still expect this downward trend to continue and inflation to return it their target range in 2025 but they highlighted uncertainties impacting the inflation outlook. Officials also noted that conditions in the labour market remain tight and that the outlook for household consumption remains uncertain.
Officials even cautioned that "a further increase in interest rates cannot be ruled out" and reiterated that returning inflation to target remains their highest priority. The RBA's next meeting is scheduled for mid-March.
Speaking at the post-meeting media conference, Governor Michele Bullock expressed caution about the inflation outlook and was non-committal about the likely next move in policy rates, noting that "we're not ruling in or out anything". She stressed, however, that rate cuts would only be considered if officials are confident that inflation is set to return to their target range and remain there.
In their quarterly outlook, officials revised their near-term inflation forecasts lower. Headline inflation is now forecast to be 3.2 percent at the end of this year compared with the previous forecast of 3.5 percent. Further ahead, headline inflation is forecast to fall to 3.1 percent by mid-2025 and 2.8 percent at the end of 2025, down slightly from the previous forecasts of 3.3 percent and 2.9 percent respectively. The forecast for the trimmed mean measure of inflation for 2025 was revised down from 2.9 to 2.8 percent.
Officials, however, are now less optimistic about growth prospects, largely reflecting concerns over household consumption. Australia's economy is now forecast to expand by a year-over-year 1.8 percent in the three months to December 2024, down from 2.0 percent previously. The forecast for 2025’s fourth quarter was unchanged at 2.3 percent. These forecasts are based on the assumption that the bank’s policy rate, in line with market expectations, has peaked at its current level (4.35 percent) and will fall to around 3.9 percent at the end of this year and further to around 3.4 percent by the end of next year. This indicates that officials now believe that the rate trajectory priced in by markets will be enough to return inflation back to their target range over the next two years.
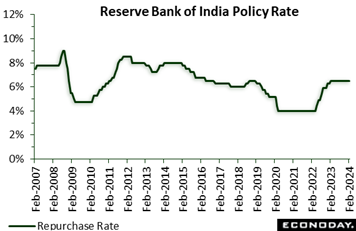 The Reserve Bank of India's left its benchmark repurchase rate unchanged at 6.50 percent at its policy review, in line with the consensus forecast. This rate has now been on hold since February 2023 after it was earlier increased by a cumulative 250 basis points beginning in May 2022. The Reserve Bank of India's left its benchmark repurchase rate unchanged at 6.50 percent at its policy review, in line with the consensus forecast. This rate has now been on hold since February 2023 after it was earlier increased by a cumulative 250 basis points beginning in May 2022.
In their statement., RBI officials said they expect the outlook for headline inflation will remain heavily dependent on food prices but expressed confidence that previous policy tightening will keep core inflation "muted". Officials also expect growth to remain supported by investment demand and strong business and consumer sentiment.
Data released since the RBI's previous meeting in December have shown headline consumer inflation increasing from 4.87 percent in October to 5.55 percent in November and 5.69 percent in December. Rising price pressures largely reflected bigger increases in food prices and lifted the CPI close to the top of the RBI's target range of two percent to six percent. Core inflation, however, fell to a four-year low of 3.8 percent in December. Recent activity data, meanwhile, have generally shown ongoing strength in economic conditions.
The RBI’s decision to leave rates on hold again indicates that officials remain confident that previous policy tightening will return headline inflation to its target range in due course. They stressed, however, that "monetary policy must continue to be actively disinflationary", suggesting that upside risks to the inflation outlook will likely remain their primary focus in upcoming meetings. India’s January CPI will be posted on Monday of the coming week with Econoday’s consensus at 5.1 percent.
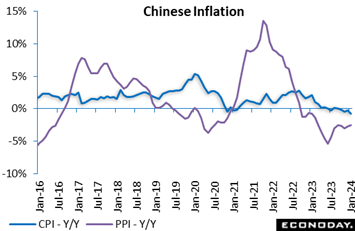 China's headline consumer price index fell 0.8 percent on the year in January after dropping 0.3 percent on the year in December. Headline inflation has now been close to zero or in negative territory for ten consecutive months and the year-over-year decline in January was the biggest of this period. China's headline consumer price index fell 0.8 percent on the year in January after dropping 0.3 percent on the year in December. Headline inflation has now been close to zero or in negative territory for ten consecutive months and the year-over-year decline in January was the biggest of this period.
China's producer price data were also released, falling 2.5 percent on the year in January after a decline of 2.7 percent in December. Headline PPI inflation has now been in negative territory for more than a year.
January’s inflation data suggest that China's economy, despite recent measures aimed at improving liquidity conditions, remains weighed down by weakness in the property market. This may strengthen the case for further policy adjustments at the upcoming annual meeting of the National People's Congress.
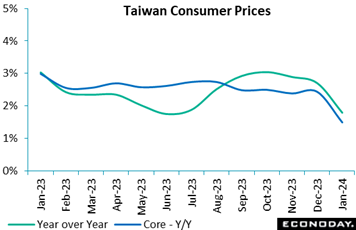 Taiwan's headline consumer price index moderated further to a year-over-year increase of 1.79 percent in January from 2.71 percent in December. The decline partly reflected the timing of lunar new year holidays, which occurred in January last year but occurs in February this year. This means that the price index was somewhat higher in January 2023 than it otherwise would have been, so that the year-over-year increase in the index in January 2024 is somewhat lower. Taiwan's headline consumer price index moderated further to a year-over-year increase of 1.79 percent in January from 2.71 percent in December. The decline partly reflected the timing of lunar new year holidays, which occurred in January last year but occurs in February this year. This means that the price index was somewhat higher in January 2023 than it otherwise would have been, so that the year-over-year increase in the index in January 2024 is somewhat lower.
Fruit prices increased in January but vegetable prices fell as supply recovered from adverse weather conditions. Core CPI, which excludes fruits, vegetables, and energy prices, slowed from 2.38 percent to 1.49 percent.
Taiwan's central bank, the Central Bank of China, left its benchmark discount rate unchanged at 1.875 percent at its quarterly meeting in December. Officials see headline inflation at 1.89 percent in 2024 and core inflation at 1.83 percent.
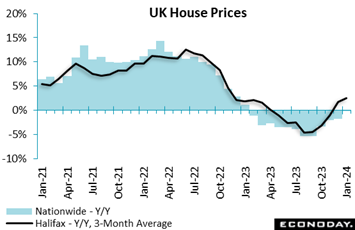 Based on the Halifax, UK house prices rose further at the start of the year. A 1.3 percent monthly increase again easily beat the consensus and, following a 1.1 percent advance in December, means that prices have now increased for four straight months. Annual inflation, as tracked in the black line of the accompanying graph, climbed from 1.8 percent to 2.5 percent, its highest mark since January 2023. Based on the Halifax, UK house prices rose further at the start of the year. A 1.3 percent monthly increase again easily beat the consensus and, following a 1.1 percent advance in December, means that prices have now increased for four straight months. Annual inflation, as tracked in the black line of the accompanying graph, climbed from 1.8 percent to 2.5 percent, its highest mark since January 2023.
The Halifax attributed the relative buoyancy to falling mortgage rates and what is still a tight labour market. However, it also pointed out that borrowing costs remain high compared to the historic lows of recent years and, for now, prices continue to be supported by limited supply. As a result, the lender still expects to see some modest falls during the remainder of the year.
Even so, the data mirror last week’s report from Nationwide in describing a surprisingly robust housing market and this could be a key factor helping to underpin consumer spending over coming months.
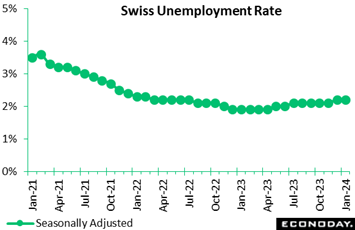 The Swiss labour market weakened further at the start of 2024. Seasonally adjusted joblessness was up 1,686 or 1.7 percent on the month at 101,754. However, the increase was not steep enough to boost the unemployment rate which held steady at 2.2 percent, in line with the consensus and so still matching its highest post since April 2022. Unadjusted, the number of people out of work increased 6,316 or 5.9 percent to 113,175, lifting this rate from 2.3 percent to 2.5 percent, now 0.3 percentage points above its level a year ago versus a 0.2 percentage point gap in December. The Swiss labour market weakened further at the start of 2024. Seasonally adjusted joblessness was up 1,686 or 1.7 percent on the month at 101,754. However, the increase was not steep enough to boost the unemployment rate which held steady at 2.2 percent, in line with the consensus and so still matching its highest post since April 2022. Unadjusted, the number of people out of work increased 6,316 or 5.9 percent to 113,175, lifting this rate from 2.3 percent to 2.5 percent, now 0.3 percentage points above its level a year ago versus a 0.2 percentage point gap in December.
By contrast, vacancies continued to gain some ground, advancing 255 or 0.6 percent to 45,287. This reduced the yearly decline from 27.0 percent to 18.7 percent.
Overall, January's update remains consistent with a loosening trend in the labour market, a development that will not unsettle the Swiss National Bank which remains to be convinced that inflation is fully under control.
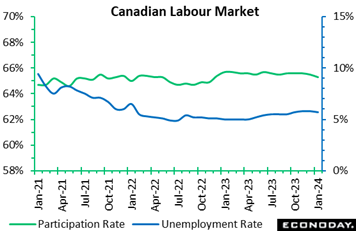 Jobs creations in Canada beat expectations in January, when the economy added 37,300 positions, topping the highest forecast of 20,000 in Econoday’s survey. The unemployment rate unexpectedly came down to 5.7 percent from 5.8 percent, below the 5.9 percent consensus, marking the first decline since December 2022. The participation rate edged down to 65.3 percent from 65.5 percent, the lowest level since September 2022. The number of hours worked increased 1.1 percent year-over-year and 0.6 percent on the month. Jobs creations in Canada beat expectations in January, when the economy added 37,300 positions, topping the highest forecast of 20,000 in Econoday’s survey. The unemployment rate unexpectedly came down to 5.7 percent from 5.8 percent, below the 5.9 percent consensus, marking the first decline since December 2022. The participation rate edged down to 65.3 percent from 65.5 percent, the lowest level since September 2022. The number of hours worked increased 1.1 percent year-over-year and 0.6 percent on the month.
While average hourly wage growth slowed to 5.3 percent year-over-year from 5.4 percent in December, it continues to put upward pressure on underlying inflation. In its January monetary policy statement, the Bank of Canada stressed that wages were still overheated, rising around 4 to 5 percent.
Still, there were some signs of labour-market cooling. Employment gains, for one, were once again concentrated in part-time jobs, up 48,900, while full-time employment contracted 11,600. The public sector accounted for most of the gains as the number of employees increased 47,600, while it was up just 7,400 in the private sector. Self-employment fell 17,700.
The sector breakdown was a tale of two stories, with goods-producing industries shedding 23,000 positions across the board, including declines of 6,200 in manufacturing and 6,600 in construction. By contrast, services added 60,400 jobs, led by a 31,300 gain in wholesale and retail trade and a 27,700 increase in educational services.
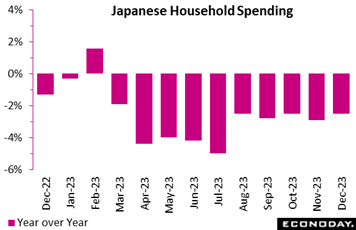 Japan's real household spending posted a 10th straight drop in December, falling a deeper-than-expected 2.5 percent on the year following a 2.9 percent drop in November. Consumers continued to be selective in purchases amid high costs for daily necessities and after a cold snap triggered rush purchases of winter clothing and heaters in the previous month. The consensus call was a 2.1 percent drop. On the month, expenditures fell a worse-than-expected 0.9 percent for the third drop in a row after slumping by 1.0 percent in November, which was also weaker than forecast. Japan's real household spending posted a 10th straight drop in December, falling a deeper-than-expected 2.5 percent on the year following a 2.9 percent drop in November. Consumers continued to be selective in purchases amid high costs for daily necessities and after a cold snap triggered rush purchases of winter clothing and heaters in the previous month. The consensus call was a 2.1 percent drop. On the month, expenditures fell a worse-than-expected 0.9 percent for the third drop in a row after slumping by 1.0 percent in November, which was also weaker than forecast.
Japanese continued to eat out and spend on vehicles but these factors were not strong enough to offset the impact of discount phone plans and the pandemic-era necessity to simplify weddings and funerals. The decrease was also due to lower spending on postage for New Year's cards in a growing shift toward sending seasonal greetings by social media.
The core measure of real average household spending (excluding housing, motor vehicles and remittance), a key indicator used in GDP calculation, rebounded a modest 0.6 percent in the fourth quarter after a decrease of 0.8 percent in the third quarter, indicating that private consumption is likely to provide only a limited positive contribution to the first estimate of fourth-quarter GDP due on Thursday, February 15 of the coming week. Econoday’s forecast for is 0.4 percent quarterly growth at an annualized rate of 1.6 percent which would compare with respective third-quarter contraction of 0.7 and 2.9 percent.
The average real income of households with salaried workers posted the 15th straight year-over-year drop in December, down 7.2 percent (down 4.4 in nominal terms) after falling 4.7 percent in November (down a nominal 1.6 percent). The main bread-earner's real income in the average household marked the 12th straight year-over-year drop while the average spouse real income posted an eighth straight drop.
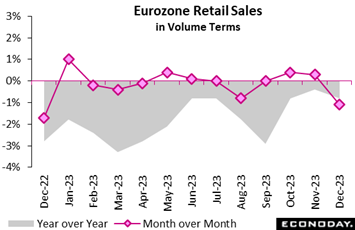 Retail sales volumes in the Eurozone were weak at the end of 2023, dropping a sizable 1.1 percent on the month, just marginally more than the market consensus and after a 0.3 percent gain in November. The decline put annual growth at minus 0.8 percent, down from minus 0.4 percent, and left purchases at their lowest level since April 2021. Retail sales volumes in the Eurozone were weak at the end of 2023, dropping a sizable 1.1 percent on the month, just marginally more than the market consensus and after a 0.3 percent gain in November. The decline put annual growth at minus 0.8 percent, down from minus 0.4 percent, and left purchases at their lowest level since April 2021.
December's monthly fall was broad-based, reflecting weakness in food, drink and tobacco where sales were down 1.6 percent with non-food ex-auto fuel at minus 1.0 percent and auto fuel minus 0.5 percent.
Regionally, the headline slide was again dominated by Germany where sales contracted a further 1.6 percent after a 0.8 percent decrease in November. However, both France (minus 1.0 percent) and Spain (minus 1.4 percent) also recorded fresh losses as did most other member states.
December's update means that fourth-quarter Eurozone volume sales were 0.1 percent below their level in the third quarter. This implies only a minor hit on GDP growth but the trend remains down and, ominously, consumer confidence deteriorated in January. Retailers are likely to struggle this quarter too.
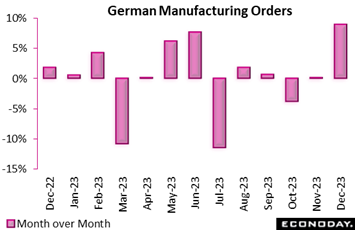 German manufacturing orders took off in December. An 8.9 percent monthly spurt was much stronger than the market consensus and the largest increase since June 2020. The year-end leap was large enough to ease annual contraction from 4.6 percent to 2.1 percent. Orders now stand at their highest level since last June. However, December’s spike was driven by major orders, in particular for transport machinery which were up 110.9 percent versus the previous month. Excluding this category orders fell 2.2 percent. German manufacturing orders took off in December. An 8.9 percent monthly spurt was much stronger than the market consensus and the largest increase since June 2020. The year-end leap was large enough to ease annual contraction from 4.6 percent to 2.1 percent. Orders now stand at their highest level since last June. However, December’s spike was driven by major orders, in particular for transport machinery which were up 110.9 percent versus the previous month. Excluding this category orders fell 2.2 percent.
Both the domestic and overseas markets posted rapid monthly rates of expansion. The former grew fully 9.4 percent, its fastest pace since December 2021, while the latter increased 8.5 percent (Eurozone 34.5 percent), a 6-month high. Total new orders for capital goods climbed 10.9 percent and intermediates were up 8.3 percent but consumer goods dropped 1.3 percent.
Orders data are notoriously volatile and December's hefty advance should be treated with caution. Indeed, even after the year-end report, quarterly growth in the fourth quarter was only 0.1 percent. It may be that manufacturing conditions are beginning to turn for the better but at least a partial reversal in January would not come as a surprise.
In fact by most other measures, the sector has been in the doldrums as seen in December’s industrial production report in which manufacturing output fell 1.5 percent on the month. Industrial production on the whole again fell well short of expectations, down a very steep 1.6 percent from November for the sixth decline in the last seven months. Annual contraction was 3.1 percent with output at its lowest level since May 2020, in the midst of Covid. The results left fourth-quarter industrial production down 1.8 percent versus the previous period which means that the sector once again subtracted from GDP growth.
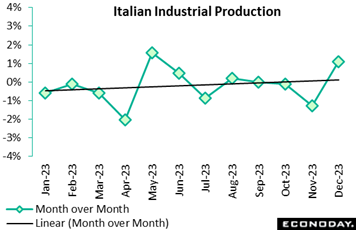 Industrial production in Italy rose more sharply than expected in December. A 1.1 percent monthly increase beat the market consensus by 0.4 percentage points and was the best performance since May last year. It was also the first gain since August. Following a 1.3 percent drop in November, the year-end bounce lifted annual workday adjusted growth from minus 2.9 percent to minus 2.1 percent. Industrial production in Italy rose more sharply than expected in December. A 1.1 percent monthly increase beat the market consensus by 0.4 percentage points and was the best performance since May last year. It was also the first gain since August. Following a 1.3 percent drop in November, the year-end bounce lifted annual workday adjusted growth from minus 2.9 percent to minus 2.1 percent.
December's monthly rise was broad-based with only energy (minus 2.0 percent) recording a decline. Consumer goods (3.0 percent) were especially robust, but there were solid increases too in both capital goods (1.6 percent) and intermediates (0.8 percent).
Even so, overall production last quarter was still down 0.5 percent versus the previous period, its fifth decrease in the last six quarters. Indeed, output at year-end matched its second lowest level since December 2020. Moreover, with the sector PMI still sub-50 in January at 48..5, the chances are that the current quarter will not see much, if any improvement. Italy’s Relative Performance Index (RPI) now stands at minus 14 but when excluding prices (RPI-P) at exactly zero to indicate that only inflation has been undershooting expectations (see Bottom Line for RPI details).
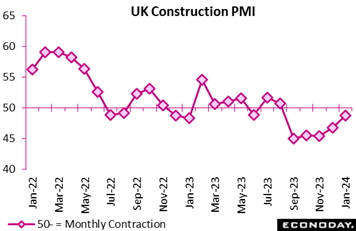 Construction activity in the UK continued to contract at the start of the year but by less than in December and (again) more slowly than expected. At 48.8, the sector PMI was a full 2 points above its December print and 1.5 points stronger than the consensus. It was also the highest outturn since last August. Construction activity in the UK continued to contract at the start of the year but by less than in December and (again) more slowly than expected. At 48.8, the sector PMI was a full 2 points above its December print and 1.5 points stronger than the consensus. It was also the highest outturn since last August.
In line with recent months, all three subsectors posted fresh losses but only housing (44.2) was truly weak. Both civil engineering (49.8) and commercial building (49.1) essentially stagnated.
Aggregate new orders declined for a sixth straight month but the fall was only marginal and the smallest over the sequence. Headcount was similarly trimmed just fractionally while suppliers' lead times shortened further. However, input costs across the sector increased sharply and by the most since last May, in part reflecting higher shipping costs due to disruptions in the Red Sea. Even so, business confidence for the coming 12 months still improved to a 2-year high.
Overall, the January data hint at better times ahead for UK construction. Nonetheless, with demand still falling and input costs on the rise again, little can be taken for granted and the first quarter is likely to be challenging.
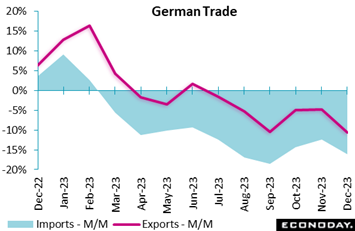 Germany’s seasonally adjusted merchandise trade balance recorded a €22.2 billion surplus in December, up from November's €20.8 billion. Yet improvement was only attributable to imports falling more sharply than exports, the former dropping 6.7 percent on the month, the sixth decrease since last May and the steepest since December 2022. Exports declined 4.6 percent, their third loss in the last four months. Unadjusted annual export growth now stands at minus 10.7 percent while imports are down some 16.2 percent on the year. Germany’s seasonally adjusted merchandise trade balance recorded a €22.2 billion surplus in December, up from November's €20.8 billion. Yet improvement was only attributable to imports falling more sharply than exports, the former dropping 6.7 percent on the month, the sixth decrease since last May and the steepest since December 2022. Exports declined 4.6 percent, their third loss in the last four months. Unadjusted annual export growth now stands at minus 10.7 percent while imports are down some 16.2 percent on the year.
December's increase in the black ink leaves a rising trend in the surplus but with exports clearly struggling, foreign demand is providing little help to German economic growth.
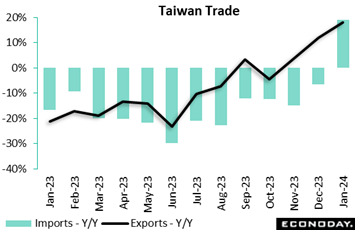 Taiwan’s exports jumped 18.1 percent on the year in January yet imports also jumped, rising 19.0 percent and pulling down the country’s surplus from December’s US$11.1 billion to US$2.49 billion. Exports of information, communication and audio-video products again increased very strongly in January, up 100.6 percent on the year after increasing 94.7 percent in December. Exports of electronic components rose 7.5 percent on the year in January, rebounding from December's 1.2 percent decline. Taiwan’s exports jumped 18.1 percent on the year in January yet imports also jumped, rising 19.0 percent and pulling down the country’s surplus from December’s US$11.1 billion to US$2.49 billion. Exports of information, communication and audio-video products again increased very strongly in January, up 100.6 percent on the year after increasing 94.7 percent in December. Exports of electronic components rose 7.5 percent on the year in January, rebounding from December's 1.2 percent decline.
Exports to mainland China and Hong Kong also rebounded, up 17.2 percent on the year after a previous fall of 6.4 percent, while year-over-year growth in exports to the US accelerated further from 49.7 percent to 56.6 percent. Petroleum imports rose on the year after two months of declines while imports from mainland China and Hong Kong recorded sharp growth.
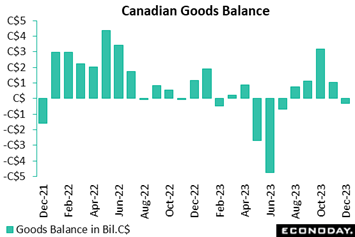 Amid weak trade activity and appreciation in the Canadian dollar weighing on trade values, Canada's goods balance unexpectedly went to a deficit of C$312 million in December from a surplus of C$1.1 billion in November. The consensus had centered on a surplus of C$1.2 billion, with the lowest forecast at C$1.1 billion. Amid weak trade activity and appreciation in the Canadian dollar weighing on trade values, Canada's goods balance unexpectedly went to a deficit of C$312 million in December from a surplus of C$1.1 billion in November. The consensus had centered on a surplus of C$1.2 billion, with the lowest forecast at C$1.1 billion.
For 2023 as a whole, the merchandise trade balance fell to a deficit of C$1.4 billion from a surplus of C$19.7 billion in 2022 as imports increased 1.4 percent while exports decreased 1.4 percent.
In December, exports fell 1.9 percent from the previous month, while imports edged up 0.2 percent, leading to the first trade deficit since July 2023. In volumes, exports contracted 0.4 percent while imports rose 1.3 percent.
Over the month, the loonie appreciated on average by 1.5 US cents, the largest monthly gain since May 2021. When expressed in US dollars, exports edged up 0.1 percent from November while imports rose 2.3 percent.
The value of exports was down across 7 of 11 categories, led by an 8.2 percent decrease in motor vehicles and parts as exports of passenger cars and light trucks dropped 11.6 percent due to the partial shutdown of models that will cease to be produced in Canada or will be produced at other Canadian plants. Energy exports were another drag, as they fell 3.1 percent on the month, led by a 4.9 percent drop in crude oil owing to lower prices amid excess supply combined with concerns over demand.
Despite the overall monthly increase, imports were down across 8 of 11 categories. If not for a record 9.4 percent monthly gain in consumer goods, imports would have fallen 2.0 percent in December. Metal and non-metallic mineral products, up 5.8 percent, also contributed to the monthly advance.
Regionally, the trade surplus with the US narrowed to C$9.2 billion from C$11.2 billion as exports fell 3.4 percent and imports rose 0.7 percent. Canada's trade deficit with countries other than the US narrowed to C$9.5 billion from C$10.1 billion.
In services, exports rose 1.3 percent on the month and imports 0.3 percent. The combined trade and services balance with the world went to a C$1.0 billion deficit in December from a C$0.2 billion surplus in November.
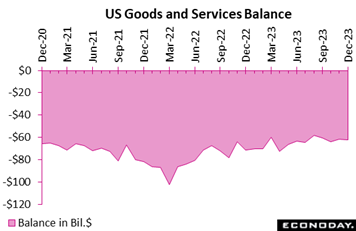 The US trade deficit in December deepened by $0.3 billion to $62.2 billion, right in line with recent trend and hitting Econoday's consensus. The goods deficit (balance of payments basis) did what limited new damage there was to the deficit, deepening by $0.7 billion in December to $89.1 billion and offset only in part by a $0.4 billion rise in the services surplus to $26.9 billion. The US trade deficit in December deepened by $0.3 billion to $62.2 billion, right in line with recent trend and hitting Econoday's consensus. The goods deficit (balance of payments basis) did what limited new damage there was to the deficit, deepening by $0.7 billion in December to $89.1 billion and offset only in part by a $0.4 billion rise in the services surplus to $26.9 billion.
After exports and imports both contracted on the month in November, cross-border activity picked up in December with exports up $3.9 billion and imports up $4.2 billion. Exports of industrial supplies rose $3.3 billion that included a $0.6 billion increase in crude exports; exports of consumer goods rose $0.7 billion while exports of foods, feeds, and beverages also increased $0.7 billion; exports of services rose $0.8 billion led by travel.
Imports saw a $1.5 billion rise in pharmaceutical and a $1.0 billion rise for cell phones and other household goods. Imports of industrial materials rose $1.2 billion that included $0.4 billion increases for both nuclear fuels and crude oil. In a negative for domestic business investment, imports of capital goods fell $0.4 billion while in a negative for car sales, imports of vehicles also fell $0.4 billion.
December's update confirms what was, on a comparative basis with the third quarter, a positive contribution for net exports in the fourth quarter which added 0.43 percentage points to the quarter's first-estimate growth rate of 3.3 percent.
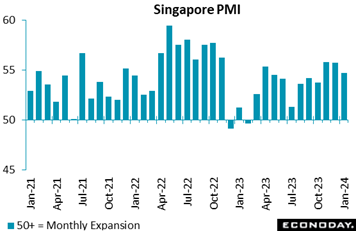 Singapore’s PMI indicates that growth in the aggregate economy cooled a bit in January, to 54.7 from 55.7 in December. Respondents reported solid domestic demand, stronger price pressures, and improved sentiment about the outlook. The survey showed slower but still solid growth in both output and new orders but a smaller decline in new export orders, with respondents citing the impact of a stronger currency. Respondents also reported another month of strong growth in payrolls, while the survey's measure of business confidence continued to indicate that firms expect solid growth in output over the next twelve months. Respondents also reported faster growth in input costs and a bigger increase in selling prices. Singapore’s PMI indicates that growth in the aggregate economy cooled a bit in January, to 54.7 from 55.7 in December. Respondents reported solid domestic demand, stronger price pressures, and improved sentiment about the outlook. The survey showed slower but still solid growth in both output and new orders but a smaller decline in new export orders, with respondents citing the impact of a stronger currency. Respondents also reported another month of strong growth in payrolls, while the survey's measure of business confidence continued to indicate that firms expect solid growth in output over the next twelve months. Respondents also reported faster growth in input costs and a bigger increase in selling prices.
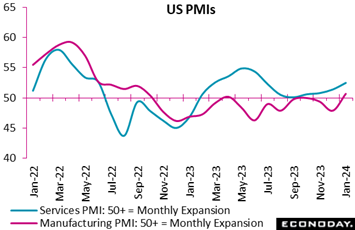 Business activity in the US services sector stayed in positive territory for the 13th straight month with the Institute for Supply Management’s index rebounding more than expected, up 2.9 points to 53.4. New orders rebounded 2.2 points to 55.0, employment surged 6.7 points to 50.5 recovering nearly all of the sharp drop in the prior month, and supply deliveries slowed for the first time in fourth months. ISM noted that shipping delays caused by water shortages at the Panama Canal are more serious than the impact of attacks on vessels in the Red Sea. Prices paid jumped 7.3 points to 64.0 in January indicating higher cost pressures. Business activity in the US services sector stayed in positive territory for the 13th straight month with the Institute for Supply Management’s index rebounding more than expected, up 2.9 points to 53.4. New orders rebounded 2.2 points to 55.0, employment surged 6.7 points to 50.5 recovering nearly all of the sharp drop in the prior month, and supply deliveries slowed for the first time in fourth months. ISM noted that shipping delays caused by water shortages at the Panama Canal are more serious than the impact of attacks on vessels in the Red Sea. Prices paid jumped 7.3 points to 64.0 in January indicating higher cost pressures.
The rival PMI services index ended January at 52.5, below the mid-month flash estimate of 52.9 but still the best showing since June last year. New orders for the PMI sample picked up in January and included gains from both domestic and foreign customers. Backlogs rose for the fist time in seven months. The sample increased employment and, like the ISM report, expressed increased optimism for the year-ahead outlook.
Global economic data on net are coming in within consensus forecasts and near the breakeven line for the Relative Performance Index (RPI), at minus 9 overall and minus 10 when excluding prices (RPI-P) to indicate only a marginal bias of underperformance.
In the Eurozone, steeper-than-expected falls in December retail sales and producer prices reduced the RPI to minus 13 and the RPI-P to minus 8. Overall activity is not lagging forecasts by much but the economy is still struggling to find any real momentum.
In the UK, resilience in the housing sector helped lift the RPI (4) back above zero, albeit only just. Even so, with the RPI-P at minus 15, it is only the inflation data that have recently beaten expectations ─ although that in itself should help keep the Bank of England on hold again next month. The real economy is lagging modestly. New CPI and jobless data in the coming week will be watched closely.
In Switzerland, there were again no major surprises in the prior week’s data, reflected in readings of 3 and minus 5 on the RPI and RPI-P respectively. A cut in the Swiss National Bank’s policy rate in March rate remains a real possibility.
In Japan, further evidence of unexpectedly weak consumer spending left the RPI at minus 21 and the RPI-P at minus 10. Speculation abounds over Bank of Japan tightening but recent data have reduced pressure for an early hike in key interest rates and may also trim the level at which the target rate is seen peaking.
In China, surprisingly weak consumer prices ensured that the RPI (minus 21) and RPI-P (minus 30) remained sub-zero. An underperforming real economy and mounting deflation worries may yet force another cut in loan prime rates.
Better-than-expected jobs data give a slight lift to Canada’s RPI, which overall and also when excluding inflation moved from the negative mid-single-digits to the positive mid-single-digits to indicate that recent data on net are coming in within consensus ranges. This suggests that economic data, after a run of disappointingly soft readings in January, are now meeting the Bank of Canada’s forecasts to further suggest that a rate cut is probably not very far away.
US data continue to come in on the high end of Econoday’s consensus ranges, reflected in both the RPI and RPI-P which ended the week in the positive high single digits. In this case, readings within consensus forecasts imply no near-term change for Federal Reserve policy.
**Contributing to this article were Jeremy Hawkins, Brian Jackson, Mace News, Max Sato, and Theresa Sheehan
US consumer prices on Tuesday lead the week’s calendar, expected to remain steady on the month for the core but to slow on the year both overall and for the core. India’s CPI on Monday is expected to cool.
Tuesday will open with UK average hourly earnings (part of the labour market report) where noticeable cooling is expected. UK’s CPI will follow on Wednesday where the headline annual rate is expected to climb 2 tenths to 4.2 percent.
The first estimate for UK fourth-quarter GDP will be a Thursday highlight and is expected to come in unchanged on the quarter but rise 0.4 percent on the year. UK retail sales for the month of January will be posted on Friday and are expected to rebound from a weak November. Sizable contraction is expected for Eurozone industrial production on Wednesday.
US retail sales and industrial production are both on Thursday and both are expected to be flat (all data for January). On Friday, US consumer sentiment for February is expected to edge further higher after surging in January.
Indian CPI for January (Mon 1730 IST; Mon 1200 GMT; Mon 0700 EST)
Consensus Forecast, Year over Year: 5.1%
Consumer prices are expected to ease back to 5.1 percent on the year in January versus December’s 5.69 percent and following November’s 5.55 percent.
Indian Industrial Production for December (Mon 1730 IST; Mon 1200 GMT; Mon 0700 EST)
Consensus Forecast, Year over Year: 2.6%
Year-over-year industrial production growth is expected to rise to 2.6 percent in December versus 2.4 percent growth in October that slowed sharply from September’s 11.7 percent.
UK Labour Market Report (Tue 0700 GMT; Tue 0200 EST)
Consensus Forecast, ILO Unemployment Rate for three months to January: 4.0%
Consensus Forecast, Average Earnings for three months to January: 5.8%
The ILO unemployment rate for the three months to January is expected to fall 2 tenths to 4.0 percent. Average earnings growth for the three months to January is seen easing to 5.8 percent from 6.5 percent.
Germany: ZEW Survey for February (Tue 1100 CET; Tue 1000 GMT; Tue 0500 EST)
Consensus Forecast, Current Conditions: -79.0
Consensus Forecast, Economic Sentiment: 18.0
Current conditions are expected to fall in February to minus 79.0 versus January’s minus 77.3 which, for a third month in a row, was lower than expected. Expectations (economic sentiment) are expected at 18.0 versus January’s 15.2 which, for the sixth month in a row, was higher than expected.
US CPI for January (Tue 0830 EST; Tue 1330 GMT)
Consensus Forecast, Month over Month: 0.2%
Consensus Forecast, Year over Year: 3.0%
US CPI Core, Less Food & Energy
Consensus Forecast, Month over Month: 0.3%
Consensus Forecast, Year over Year: 3.7%
Core prices in January are expected to hold steady for a third month in a row at a monthly increase of 0.3 percent. Overall prices are expected to rise 0.2 percent after increasing 0.3 percent in December which, like the month’s core result, was also higher than expected. Annual rates, which in December were 3.4 percent overall and 3.9 percent for the core, are expected to slow to 3.0 and 3.7 percent respectively.
Indian Wholesale Price Index for January (Wed 0630 GMT; Wed 1200 IST; Wed 0130 EST)
Consensus Forecast, Year over Year: 0.5%
Following an extended run of contraction, annual wholesale prices edged above the zero line in November and December. The consensus for January is plus 0.5 percent versus 0.73 percent in December.
UK CPI for January (Wed 0700 GMT; Wed 0200 EST)
Consensus Forecast, Month over Month: -0.3%
Consensus Forecast, Year over Year: 4.2%
At 4.0 percent versus expectations for 3.8 percent, consumer prices in December were a good deal stronger than expected. January’s expectations are a 2 tenths rise to 4.2 percent. The monthly rate, however, is seen falling 0.3 percent after rising 0.4 percent in December.
Eurozone Industrial Production for December (Wed 1000 GMT; Wed 1100 CET; Wed 0500 EST)
Consensus Forecast, Month over Month: -0.4%
Consensus Forecast, Year over Year: -4.3%
Production in December is expected to fall a monthly 0.4 percent after contracting an as-expected 0.3 percent in November. Absent revisions, December will need an improbably steep 3.8 percent monthly spurt just to keep the quarter flat. Consensus for December’s year-over-year rate is contraction of 4.3 percent versus November contraction of 6.8 percent.
Japanese Fourth-Quarter GDP, First Estimate (Thu 0850 JST; Wed 2350 GMT; Wed 1850 EST)
Consensus Forecast, Quarter over Quarter: 0.4%
Consensus Forecast, Annualized Rate: 1.6%
GDP for the fourth quarter is expected to rise a quarterly 0.4 percent and rise 1.6 percent on an annualized basis. These would compare with 0.7 percent contraction in the third quarter and annualized contraction of 2.9 percent.
Australian Labour Force Survey for January (Thu 0030 GMT; Thu 1130 AEDT; Wed 1930 EST)
Consensus Forecast, Employment: 30,000
Consensus Forecast, Unemployment Rate: 4.0
At a consensus rise of 30,000, employment in January is expected to rebound from December’s unexpected 65,100 fall. Unemployment is expected to rise a tenth to 4.0 percent.
UK GDP for December (Thu 0700 GMT; Thu 0200 EST)
Consensus Forecast, Month over Month: -0.1%
GDP in the month of December is expected to fall 0.1 percent versus 0.3 percent expansion in November.
UK Fourth-Quarter GDP, First Estimate (Thu 0700 GMT; Thu 0200 EST)
Consensus Forecast, Quarter over Quarter: 0.0%
Consensus Forecast, Year over Year: 0.4%
Total quarter-over-quarter output is seen unchanged in the fourth quarter versus 0.1 percent contraction in the third quarter. Annual expansion is seen at 0.4 percent versus third-quarter expansion of 0.3 percent.
UK Industrial Production for December (Thu 0700 GMT; Thu 0200 EST)
Consensus Forecast, Month over Month: -0.1%
Manufacturing Output
Consensus Forecast, Month over Month: 0.0%
Industrial production is expected to fall 0.1 percent in December following November’s 0.3 percent rise. Manufacturing output, which rose 0.4 percent in November, is expected to come in unchanged.
Canadian Housing Starts for January (Thu 0815 EST; Thu 1315 GMT)
Consensus Forecast, Annual Rate: 235,000
Housing starts are expected to slow to 235,000 in January versus December’s higher-than-expected 249,255.
Canadian Manufacturing Sales for December (Thu 08:30 EST; Thu 1330 GMT)
Consensus Forecast, Month over Month: -0.6%
After rising 1.2 percent in November and falling 2.8 percent in October, manufacturing sales in December are expected to fall back 0.6 percent.
US Retail Sales for January (Thu 0830 EST; Thu 1330 GMT)
Consensus Forecast, Month over Month: -0.1%
Consensus Forecast, Ex-Vehicles - M/M: 0.2%
Consensus Forecast, Ex-Vehicles, Ex-Gas - M/M: 0.3%
January sales are expected to fall 0.1 percent versus December’s slightly better-than-expected 0.6 percent gain. Retail sales have beaten Econoday’s consensus the last six reports. December’s ex-auto gain was 0.4 percent with January expected to rise 0.2 percent; January ex-auto ex-gas are expected to rise 0.3 percent.
US Industrial Production for January (Thu 1415 GMT; Thu 0915 EST)
Consensus Forecast, Month over Month: 0.2%
Consensus Forecast, Manufacturing Output - M/M: -0.1%
Consensus Forecast, Capacity Utilization Rate: 78.8%
After a 0.1 percent rise in December, industrial production is expected to rise 0.2 percent in January. Manufacturing output is expected to fall 0.1 percent after, like the overall headline, edging 0.1 percent higher. Capacity utilization is expected to rise to 78.8 percent following 78.6 percent in December.
UK Retail Sales for January (Fri 0700 GMT; Fri 0200 EST)
Consensus Forecast, Month over Month: 1.5%
Consensus Forecast, Year over Year: -0.9%
Retailers had a miserable December, suffering a deep 3.2 percent slump in volume sales. January’s rebound is seen at 1.5 percent.
US Consumer Sentiment Index, Preliminary February (Fri 1000 EST; Fri 1500 GMT)
Consensus Forecast: 80.0
Consumer sentiment in the first indication for February is expected to rise 1 point to 80.0. Sentiment in the months of January and December rose 9.3 and 8.4 points for the greatest 2-month surge since the end of the 1991 recession.
|
