|
News of recessions in Japan and the UK headlined a busy week, though dips for these two economies were only marginal. Global economic data as measured by the Relative Performance Index continues, as detailed in this report’s Bottom Line, to come in as expected, that is global inflation is mostly moderating, at least slightly, as is global economic activity. Given the steady and predicated pace of overall cooling, global monetary policy seems to be working as advertised and its success is giving space for policymakers to hold off on rate cuts.
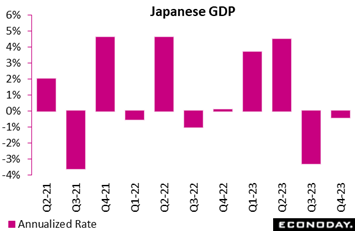 Fourth-quarter GDP contracted slightly by 0.1 percent on the quarter, or at an annualized 0.4 percent rate, much weaker than the consensus call for a 0.4 percent rebound (annualized 1.6 percent). This follows downwardly revised third-quarter contraction of 0.8 percent on the quarter and 3.3 percent annualized and pushes Japan’s economy into technical recession. Fourth-quarter GDP contracted slightly by 0.1 percent on the quarter, or at an annualized 0.4 percent rate, much weaker than the consensus call for a 0.4 percent rebound (annualized 1.6 percent). This follows downwardly revised third-quarter contraction of 0.8 percent on the quarter and 3.3 percent annualized and pushes Japan’s economy into technical recession.
The latest decline included a third straight drop in private consumption at 0.2 percent, 0.1 percent contraction for business investment, and 0.7 percent contraction for public investment. Net exports, contributing 0.2 percentage points to GDP, rebounded less than expected. Contraction in the third quarter reflected a substantial draw in private inventories, a slip in net exports, as well as slowing in public-works spending.
The year-over-year comparison, however, was more favorable, up 1.0 percent in the December quarter for the 11th consecutive rise following a 1.7 percent rise in the September quarter.
Looking ahead the March quarter is expected to grow moderately, though uncertainty remains over both domestic and external demand. The Cabinet Office estimates that in order for real GDP to hit the official forecast of 1.6 percent growth for fiscal 2023 (ending March), the economy will have to grow 1.23 percent on quarter, or at an annualized pace of 5.0 percent.
Government policymakers believe the economy still needs monetary and fiscal policy support for achieving sustained wage growth; in some contrast, the Bank of Japan has been debating for the need to unwind large-scale stimulus.
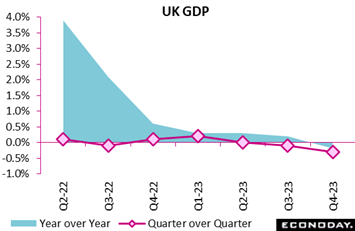 The fourth-quarter economy in the UK was weaker than expected as GDP shrank 0.3 percent versus the previous period versus Econoday’s consensus for only 0.1 percent contraction. Following a 0.1 percent dip in the third quarter, the latest decrease means the UK, like Japan, ended 2023 in technical recession. The fourth-quarter economy in the UK was weaker than expected as GDP shrank 0.3 percent versus the previous period versus Econoday’s consensus for only 0.1 percent contraction. Following a 0.1 percent dip in the third quarter, the latest decrease means the UK, like Japan, ended 2023 in technical recession.
The quarterly decline was in part due to the household sector where spending dipped 0.1 percent after a 0.9 percent drop in the third quarter. This was compounded by a 0.3 percent fall in government consumption. However, more optimistically, gross fixed capital formation rose 1.4 percent, reversing its third-quarter decline and within which business investment expanded 1.5 percent.
The quarter would have posted growth but for renewed deterioration in the foreign trade balance. Here a 2.9 percent drop in exports easily outpaced a 0.8 percent slide in imports which, combined, subtracted 0.6 percentage points from headline GDP.
The onset of recession will not come as much of a surprise to the Bank of England or financial markets. Yet ahead of a probable general election later in the year, confirmation of the downturn will add additional pressure on the bank to deliver a near-term cut in interest rates. That said, with inflation persistence still an important issue for many BoE members, the March meeting still looks too early for a cut.
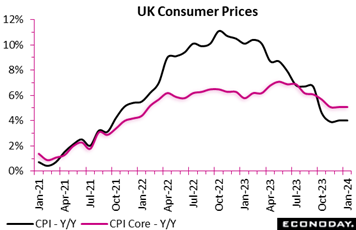 Prices are seasonally soft in January which means that even a surprisingly steep 0.6 percent monthly fall left the annual inflation rate in the UK steady at 4.0 percent, matching its December print. Accordingly, inflation remains 2.0 percentage points above the BoE’s medium-term target. Prices are seasonally soft in January which means that even a surprisingly steep 0.6 percent monthly fall left the annual inflation rate in the UK steady at 4.0 percent, matching its December print. Accordingly, inflation remains 2.0 percentage points above the BoE’s medium-term target.
Core prices declined a sharper 0.9 percent on the month but this too was only enough to hold the underlying yearly inflation rate at 5.1 percent. Overall goods inflation actually edged lower from 1.9 percent to 1.8 percent but, more significantly, the rate in services once again edged higher, from 6.4 percent to 6.5 percent and a 3-month high.
The main upward contribution to the change in the annual headline rate came from housing and household services where prices rose a monthly 1.8 percent after a 0.5 percent increase in January 2023. Transport and miscellaneous goods and services also added pressure, offset by cooling for furniture and household goods, food and soft drink as well as clothing and footwear.
January’s unexpectedly soft inflation data, which included a 0.2 percent monthly decline in producer prices, should be only cautiously well received at the BoE and, absent a downside shock in the February CPI report, there may again be only one vote on the Monetary Policy Committee to lower Bank Rate next month. Better news on prices will be needed if Bank Rate is to be lowered at the following meeting in May.
 US consumer prices showed greater than expected pressure in January, up 0.3 percent on the month for the largest gain since September last year and up 3.1 percent year-over-year which was down from 3.4 percent in December but still 1 tenth ahead of the consensus. Excluding food and energy, prices rose 0.4 percent on the month after 0.3 percent in December, while the 12-month rate remained steady at 3.9 percent, where the consensus was 3.7 percent. US consumer prices showed greater than expected pressure in January, up 0.3 percent on the month for the largest gain since September last year and up 3.1 percent year-over-year which was down from 3.4 percent in December but still 1 tenth ahead of the consensus. Excluding food and energy, prices rose 0.4 percent on the month after 0.3 percent in December, while the 12-month rate remained steady at 3.9 percent, where the consensus was 3.7 percent.
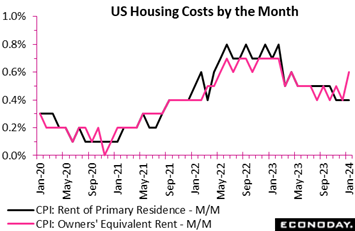
The failure of inflation to slow down as much as expected – or at all for the core measure - was a disappointment, albeit in line with a resilient economy and consumer. Shelter was once again the key culprit for the continued price gains, with monthly appreciation of 0.6 percent after 0.4 percent in December, explaining more than two thirds of the CPI increase. Within shelter, both rent and owners’ equivalent rent of primary residences failed once again to cool, especially the latter which rose 0.6 percent on the month (red line in graph) for the largest increase since April last year. Rent of primary residences (black line) rose 0.4 percent for a third straight month. Higher monthly prices for motor vehicle insurance and medical care also put upward pressure. Food prices increased 0.4 percent on the month, twice as fast as they did in December.
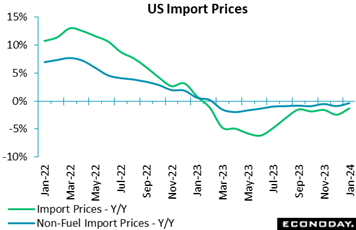 Import prices in the US jumped 0.8 percent in January for the strongest monthly gain since March 2022, yet this follows three straight months of prior declines and leaves the annual rate still sitting in contraction at minus 1.3 percent. Prices of imported fuel, up 1.2 percent on the month, contributed to the increase but January did see broader pressure; excluding fuel, import prices rose 0.7 percent with this annual reading now only barely in the negative column at minus 0.3 percent. Import prices in the US jumped 0.8 percent in January for the strongest monthly gain since March 2022, yet this follows three straight months of prior declines and leaves the annual rate still sitting in contraction at minus 1.3 percent. Prices of imported fuel, up 1.2 percent on the month, contributed to the increase but January did see broader pressure; excluding fuel, import prices rose 0.7 percent with this annual reading now only barely in the negative column at minus 0.3 percent.
Imports of foods, feeds, & beverages rose 1.5 percent in the month with this annual rate at plus 2.9 percent. Prices of finished goods, which are usually flat, posted sizable monthly gains: capital goods up 0.4 percent, consumer goods up 1.1 percent, and autos up 0.8 percent. The annual rate for imported autos is up 2.1 percent on the year, not much compared to other prices in the US economy but still reflecting shortages of product.
Export prices rose 0.8 percent on the month in January but were still down 2.4 percent on the year versus 2.9 percent contraction in the prior month. Export prices of industrial supplies, led by fuel and lubricants, rose 1.9 percent on the month with capital goods, up 0.9 percent, also showing price gains. Exports of foods, feeds, & beverages fell 1.1 percent with this category in annual contraction of 9.3 percent in sharp contrast, especially for US farmers, to upward pressure for related imports.
Though the broad trend for cross-border prices is probably flat, markets may focus on the latest month's results which, in isolation, point to easing moderation and in turn less contribution to overall moderation for US inflation. Note that US producer prices, also released in the week, were likewise tame but still higher than expected, at a 0.9 percent annual rate overall and 2.0 percent when excluding food and energy.
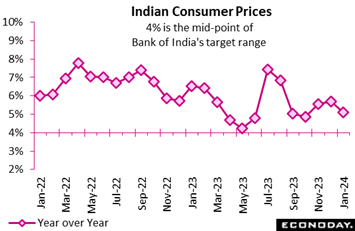 India's consumer price index rose 5.10 percent on the year in January, moderating from an increase of 5.69 percent in December and taking inflation closer to the mid-point of the Reserve Bank of India's target range of two percent to six percent. This follows increases in headline inflation in each of the two previous months. India's consumer price index rose 5.10 percent on the year in January, moderating from an increase of 5.69 percent in December and taking inflation closer to the mid-point of the Reserve Bank of India's target range of two percent to six percent. This follows increases in headline inflation in each of the two previous months.
The moderation in headline inflation was largely driven by food and beverage prices, which account for more than half the weight of the CPI index. These rose 7.58 percent on the year after increasing 8.70 percent previously. Fuel and light charges, around 8 percent of the index, fell 0.60 percent on the year after falling 0.99 percent previously. Inflation in urban areas declined from 5.46 percent in December to 4.92 percent in January, while inflation in rural areas slowed from 5.93 percent to 5.34 percent.
At the RBI's meeting earlier this month, officials left policy rates on hold at 6.50 percent. They advised then that they expect the outlook for headline inflation to remain heavily dependent on food prices but expressed confidence that previous policy tightening will keep core inflation "muted". They stressed, however, that "monetary policy must continue to be actively disinflationary", suggesting that upside risks to the inflation outlook will likely remain their primary focus in upcoming meetings.
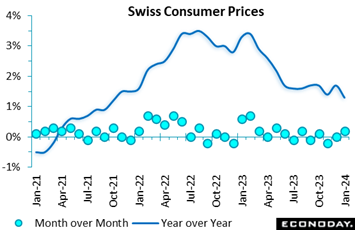 Swiss consumer prices were much weaker than expected at the start of the year. A 0.2 percent monthly rise was 3 tenths below the consensus and small enough to trim the annual inflation rate from 1.7 percent to just 1.3 percent, matching its lowest reading since September 2021. Swiss consumer prices were much weaker than expected at the start of the year. A 0.2 percent monthly rise was 3 tenths below the consensus and small enough to trim the annual inflation rate from 1.7 percent to just 1.3 percent, matching its lowest reading since September 2021.
The fall in headline annual inflation reflected moderation in annual domestic prices from 2.3 percent to 2.0 percent. This was compounded by import prices where the 12-month rate fell from minus 0.2 percent to minus 0.9 percent.
Within the CPI basket, the largest monthly increase in prices was in restaurants and hotels (1.7 percent) followed by housing and energy (1.1 percent) and alcohol and tobacco (0.9 percent). Gains here were partially offset by decreases in clothing and footwear (7.8 percent) which were sharply weaker on seasonal sales, and transport (0.9 percent). Petroleum products (minus 1.7 percent) were also significantly cheaper. As a result, core prices (ex-food ex-energy) dropped 0.3 percent versus December, shaving this rate from 1.5 percent to 1.2 percent, the weakest post since January 2022.
The surprisingly soft January update will boost speculation that the Swiss National Bank. which meets next month, might be the first of the major central banks to cut policy rates. Both headline and core inflation have been sub-2 percent every month since May 2023.
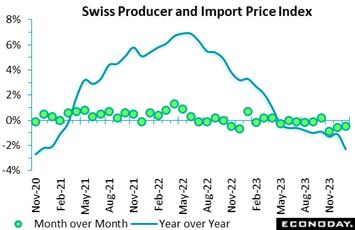 Switzerland’s combined producer and import price index was surprisingly weak at the start of the year. A 0.5 percent monthly drop was no where near the market consensus and, following a 0.6 percent decrease in December, means that prices have fallen in six of the last seven months. The annual inflation rate declined from minus 1.1 percent to minus 2.3 percent matching its weakest reading since November 2020. Switzerland’s combined producer and import price index was surprisingly weak at the start of the year. A 0.5 percent monthly drop was no where near the market consensus and, following a 0.6 percent decrease in December, means that prices have fallen in six of the last seven months. The annual inflation rate declined from minus 1.1 percent to minus 2.3 percent matching its weakest reading since November 2020.
Domestic prices were unchanged on the month, trimming their yearly rate from 0.5 percent to minus 0.1 percent. Import prices were much weaker, sliding 1.6 percent to reduce their annual rate from minus 4.4 percent to 6.5 percent. Within the PPI, petroleum products (minus 6.2 percent) again saw the steepest monthly fall but other sizeable declines were seen in furniture and other manufacturing (2.0 percent) and computer, electronic and optical products (0.7 percent). Against that, electricity and gas supply jumped 5.5 percent and water supply 1.4 percent. Meantime, the drop in import prices was led by mining and quarrying products (minus 16.9 percent) and petroleum products (minus 8.5 percent).
The December update lowers the underlying annual inflation rate from minus 0.4 percent to minus 1.1 percent, matching its weakest print since February 2021. Pipeline price pressures in Swiss manufacturing remain very soft.
 Having provided only experimental estimates since last October due to issues with data accuracy, the Office for National Statistics on Tuesday issued a new version of its survey based on updated estimates of the size and composition of the UK population. These will now become the official labour market statistics. Having provided only experimental estimates since last October due to issues with data accuracy, the Office for National Statistics on Tuesday issued a new version of its survey based on updated estimates of the size and composition of the UK population. These will now become the official labour market statistics.
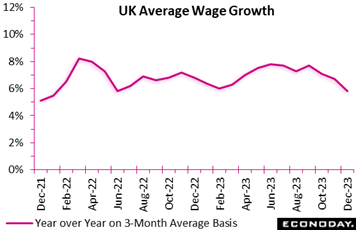
Wage growth came in at expectations, at an annual 3-month average in December of 5.8 percent and down sharply from 6.7 percent in the three months to November. That said, December’s single month rate was only steady at 5.6 percent. Excluding bonuses, the picture was much the same with the headline rate dropping from 6.7 percent to 6.2 percent and the single month rate flat at also 6.2 percent.
In data for January, claimant count unemployment rose 14,100 on the month, marginally more than the market consensus but after a much smaller revised 5,500 increase in December. The jobless rate was unchanged at 4.0 percent.
By contrast, the new ILO data show unemployment falling 87,000 to 1.32 million in the three months ending in December, leaving the number of people out of work at its lowest level since the three months ending January 2023. Moreover, the drop was steep enough to reduce the jobless rate to just 3.8 percent, a couple of ticks short of the consensus and matching its lowest mark since June-August 2022. At the same time, employment continued to rise, this time by 72,000 to 33.174 million. This saw the rate at 75.0 percent, a tidy 0.2 percentage points above the third quarter print. In addition, while payroll growth is slowing, the provisional January estimate revealed a solid 31,000 increase versus December. That said, vacancies fell again, a 26,000 decline in the three months to January extending the downtrend that began back in May-July 2022.
In sum, the new report shows the labour market significantly tighter than originally thought but, it seems, not tight enough to prevent a further deceleration in trend wage growth. It remains to be seen just how trustworthy the latest figures will prove but, as they stand, they’ll likely leave the BoE's MPC scratching its head and probably on hold for now.
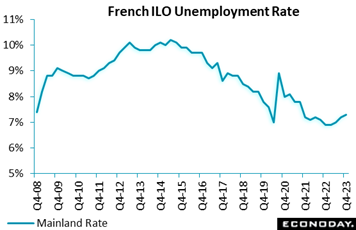 France’s labour market was surprisingly weak at the end of last year. At 7.3 percent, the fourth quarter’s mainland jobless rate was up a tick versus its third quarter reading and fully 0.3 percentage points above the market consensus. This was its third straight increase and the highest since the third quarter of 2021. France’s labour market was surprisingly weak at the end of last year. At 7.3 percent, the fourth quarter’s mainland jobless rate was up a tick versus its third quarter reading and fully 0.3 percentage points above the market consensus. This was its third straight increase and the highest since the third quarter of 2021.
Including overseas territories, unemployment rose 29,000 to 2.33 million. This was the fourth increase in as many quarters but small enough to hold the rate at the third quarter's upwardly revised 7.5 percent. The latest print was 0.4 percentage points above the recent low seen at the start of 2023. At the same time, the overall employment rate edged a tick firmer to 68.4 percent but this failed to reverse a 0.2 percentage point drop recorded in the previous period.
This disappointingly soft report is consistent with weakness shown in many of the other recent indicators; France’s real economy flatlined in both the third and fourth quarters of 2023.
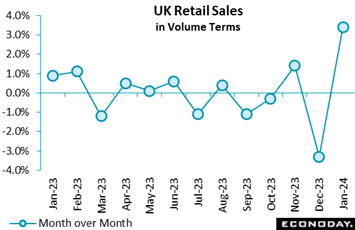 Retailers in the UK made a very solid start to the year albeit only after a miserable end to 2023. Sales climbed fully 3.4 percent on the month, their steepest rise since April 2021 and more than double the market consensus. However, this was still only just enough to reverse December's sharper revised 3.3 percent slump. Annual growth was minus 0.7 percent, up from minus 2.4 percent and the first positive reading since March 2022; purchases now match their highest level since last June. Excluding auto fuel, the picture was much the same with sales rebounding 3.2 percent versus December and increasing also 0.7 percent on the year. Retailers in the UK made a very solid start to the year albeit only after a miserable end to 2023. Sales climbed fully 3.4 percent on the month, their steepest rise since April 2021 and more than double the market consensus. However, this was still only just enough to reverse December's sharper revised 3.3 percent slump. Annual growth was minus 0.7 percent, up from minus 2.4 percent and the first positive reading since March 2022; purchases now match their highest level since last June. Excluding auto fuel, the picture was much the same with sales rebounding 3.2 percent versus December and increasing also 0.7 percent on the year.
Monthly growth was almost evenly split between the food sector (3.4 percent) and the non-food, ex-auto fuel sector (3.0 percent). Within the latter, non-specialised stores (5.4 percent) and the other stores category (6.2 percent) had a particularly good period after hefty losses in December. Non-store retailing (3.2 percent) also saw strong demand and auto fuel was up 5.4 percent.
January's surprisingly strong rebound suggests that the recession indicated by fourth-quarter GDP could well be mild and probably short-lived. Particularly should the labour market remain tight and the housing market stay resilient, consumer spending ought to hold its own.
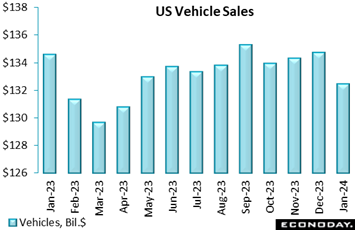 US retail and food services sales fell 0.8 percent in January from December which was well below the consensus of down 0.1 percent in Econoday’s survey of forecasters. January’s weakness in retail activity was broad-based, although a few sectors managed to show some gains. Spending in January reflects the post-holiday period and suggests that if consumers felt inclined to go out and shop in November and December, any pent-up demand had already been exhausted. US retail and food services sales fell 0.8 percent in January from December which was well below the consensus of down 0.1 percent in Econoday’s survey of forecasters. January’s weakness in retail activity was broad-based, although a few sectors managed to show some gains. Spending in January reflects the post-holiday period and suggests that if consumers felt inclined to go out and shop in November and December, any pent-up demand had already been exhausted.
The main source of softness in January sales was a 1.7 percent decline in motor vehicles and parts and a 1.7 percent decrease in sales at gasoline stations. Motor vehicles reflected a decrease in units sold while gasoline stations had lower prices at the pump. Excluding motor vehicles, sales fell 0.6 percent in January; sales excluding gasoline fell 0.8 percent; sales excluding both motor vehicles and gasoline fell 0.5 percent. Motor vehicle sales, at an adjusted $132.4 billion as tracked in the graph, accounted for 18.9 percent of all sales and gasoline 7.5 percent of the total. Also significant was a 0.8 percent decline at nonstore retailers which accounted for 16.9 percent of January’s sales.
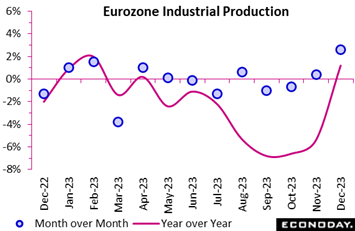 Industrial production in the Eurozone surprised markedly on the upside at year-end. Output climbed fully 2.6 percent on the month and that after November's 0.3 percent fall was revised to a 0.4 percent rise. The December jump was the steepest since August 2022 and made for the first back-to-back increase since January/February last year. Annual change improved from 5.4 percent contraction to growth of 1.2 percent for the best showing since February 2023; production now stands at its highest level since last February. Industrial production in the Eurozone surprised markedly on the upside at year-end. Output climbed fully 2.6 percent on the month and that after November's 0.3 percent fall was revised to a 0.4 percent rise. The December jump was the steepest since August 2022 and made for the first back-to-back increase since January/February last year. Annual change improved from 5.4 percent contraction to growth of 1.2 percent for the best showing since February 2023; production now stands at its highest level since last February.
December's remarkable monthly leap was largely attributable to capital goods which were up fully 20.5 percent, in no small way it seems to reflect a huge spike in Ireland. Elsewhere, intermediates fell 1.2 percent but consumer durables were up 0.5 percent, non-durables 0.2 percent and energy 0.3 percent.
Regionally, France and Italy (both 1.1) posted solid advances but Germany (minus 1.2 percent) and Spain (minus 0.4 percent) saw fresh losses.
The latest data likely provide a misleadingly strong impression of Eurozone manufacturing at the end of 2023. The Central Statistics Office in Ireland, where industrial production rose some 23.5 percent in December after a 7.3 percent increase in November, is currently reviewing its data; recent swings here have clearly distorted the Eurozone’s headline figures.
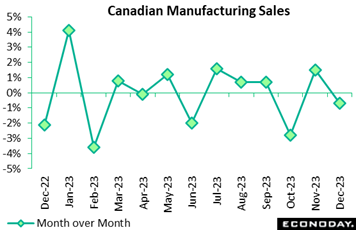 Driven down by motor vehicles and parts, manufacturing sales in Canada contracted 0.7 percent in December, marginally more than the expected 0.6 percent decline. Excluding motor vehicles and parts, sales increased 0.4 percent. Capacity utilization fell sharply to 75.3 percent in December from 79.1 percent in November, the lowest since January 2022, led by transportation and food. Driven down by motor vehicles and parts, manufacturing sales in Canada contracted 0.7 percent in December, marginally more than the expected 0.6 percent decline. Excluding motor vehicles and parts, sales increased 0.4 percent. Capacity utilization fell sharply to 75.3 percent in December from 79.1 percent in November, the lowest since January 2022, led by transportation and food.
Looking at the sales breakdown, two sectors particularly dragged down the overall performance in December: motor vehicles, which fell 13.5 percent, and chemical products, down 3.1 percent. The largest gain was in aerospace product and parts, up 10.6 percent. Petroleum and coal increased 2.7 percent. Overall, durable goods decreased 1.3 percent while non-durables were flat. In volume terms, sales edged down 0.1 percent on the month, illustrating the large impact of lower producer prices on the headline sales number. Industrial prices in December contracted 1.5 percent.
Looking ahead, new orders in December were up 2.3 percent and unfilled orders up 1.2 percent. Inventories contracted 0.6 percent, virtually as much as sales, leaving the inventory-to-sales ratio unchanged at 1.73.
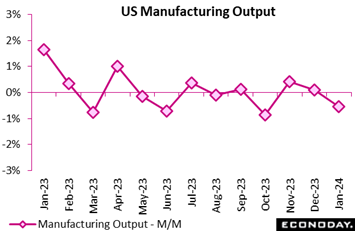 Industrial production in the US dipped 0.1 percent in January after no change in December as manufacturing output, as tracked in the graph, fell a sizable 0.5 percent. Both of these results were lower than expected. Capacity utilization was also lower than expected, falling to 78.5 percent from 78.7 percent in December and below the long-term average of 79.6 percent. Industrial production in the US dipped 0.1 percent in January after no change in December as manufacturing output, as tracked in the graph, fell a sizable 0.5 percent. Both of these results were lower than expected. Capacity utilization was also lower than expected, falling to 78.5 percent from 78.7 percent in December and below the long-term average of 79.6 percent.
Within manufacturing, output of durables did rise 0.1 percent but nondurables were down 1.1 percent. Durables included a 1.5 percent increase for electrical equipment and a 0.9 percent rise in computer and electronic products. Motor vehicles output, however, fell 0.2 percent in January as production no longer played catch-up with prior labor actions. Nondurables manufacturing felt the pinch of a 3.7 percent drop in petroleum and coal products and a 1.3 percent decline in chemicals.
Mining output fell 2.3 percent due to weather-related pullback in oil and gas extraction and a drop in coal production. Utilities output surged 6.0 percent in January with colder weather upping demand for heating. Electric output rose 4.7 percent in January from December and natural gas was up 13.9 percent.
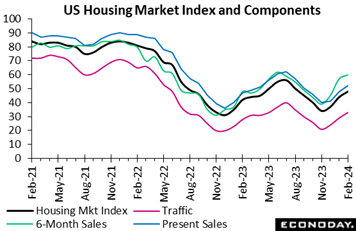 The National Association of Home Builders’ housing market index is up 4 points this month to 48, the highest since 50 in August 2023. The February reading is above The National Association of Home Builders’ housing market index is up 4 points this month to 48, the highest since 50 in August 2023. The February reading is above
Econoday’s consensus of 46. The index is higher due to improvements in all components which reflect moderation in mortgage rates since December. Homebuilders anticipate that the dearth of homes available in the existing market will give new home construction further opportunities to capture sales, especially if mortgage rates decline.
The index of present sales of single-family homes rose 4 points to 52 in February; the index for expected sales of single-family homes rose 3 points to 60; and buyer traffic index gained 4 points to 33 in February. The average Freddie Mac rate for a 30-year fixed rate mortgage is 6.64 percent for February to-date, the same as in January as a whole but below 6.82 percent in December and 7.44 percent in November.
"With future expectations of Fed rate cuts in the latter half of 2024, NAHB is forecasting that single-family starts will rise about 5 percent this year," according to the report. "But as builders break ground on more homes, lot availability is expected to be a growing concern, along with persistent labor shortages. And as a further reminder that the recovery will be bumpy as buyers remain sensitive to interest rate and construction cost changes, the 10-year Treasury rate is up more than 40 basis points since the beginning of the year."
The market for new homes is sufficiently strong that homebuilders are scaling back on incentives. In February, 59 percent of builders offered incentives compared to 62 percent in January. Among incentives, 25 percent of builders offered price cuts compared to 31 percent in January. The average size of a price cut is 6 percent where it has been for the past seven months.
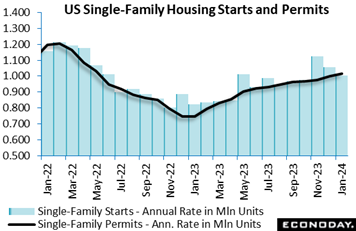 While builders are excited about February’s conditions, it turns out January was slow based on housing starts which fell sharply to a 1.331 million annualized rate that followed, however, a very strong 1.562 million rate in December. The strength of the prior month along with intense cold in parts of the US during January are likely causes of the pull back. But permits in January also declined, though falling less dramatically to a 1.470 million rate from 1.493 million. Yet the good news in the report, as tracked by the graph’s black line, is a gain for single-family permits to 1.015 million from 0.999 million in December; this is the highest rate since June 2022 and up 35.7 percent from January 2023. In sum, US builders have plenty of projects planned and will stay active in the coming months. While builders are excited about February’s conditions, it turns out January was slow based on housing starts which fell sharply to a 1.331 million annualized rate that followed, however, a very strong 1.562 million rate in December. The strength of the prior month along with intense cold in parts of the US during January are likely causes of the pull back. But permits in January also declined, though falling less dramatically to a 1.470 million rate from 1.493 million. Yet the good news in the report, as tracked by the graph’s black line, is a gain for single-family permits to 1.015 million from 0.999 million in December; this is the highest rate since June 2022 and up 35.7 percent from January 2023. In sum, US builders have plenty of projects planned and will stay active in the coming months.
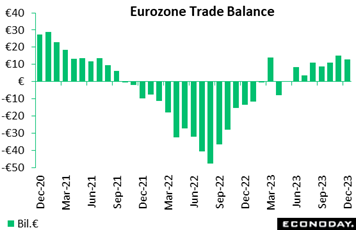 The Eurozone’s seasonally adjusted merchandise trade balance ended 2023 in surplus of €13.0 billion. Unadjusted, the balance was in a €16.8 billion surplus, a marked improvement on an €8.5 billion deficit in December 2022. The Eurozone’s seasonally adjusted merchandise trade balance ended 2023 in surplus of €13.0 billion. Unadjusted, the balance was in a €16.8 billion surplus, a marked improvement on an €8.5 billion deficit in December 2022.
Yet December's report leaves a broadly flat trend for exports and a modestly declining path for imports. Both exports and imports remain well below their respective levels in December 2022; hence, unadjusted annual growth of the former now stands at minus 8.8 percent and of the latter, at minus 14.8 percent. Both sides of the balance sheet continue to be negatively impacted by trade with Russia. Over 2023 as a whole, EU exports to Russia were down 30.4 percent and imports fully 75.0 percent.
The December update means that the Eurozone recorded a small €65.9 million surplus in 2023. This compares with a €332.2 billion shortfall in 2022 and mainly reflects a marked price-led decline in the deficit on energy.
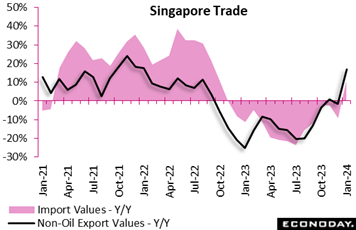 Singapore's non-oil domestic exports increased 16.8 percent on the year in January after falling 1.5 percent in December and rose 2.3 percent on the month after a previous decline of 1.7 percent. Imports advanced 11.1 percent on the year in January after falling 9.3 percent in December and rose 5.2 percent on the month after dropping 5.5 percent previously. Singapore's non-oil domestic exports increased 16.8 percent on the year in January after falling 1.5 percent in December and rose 2.3 percent on the month after a previous decline of 1.7 percent. Imports advanced 11.1 percent on the year in January after falling 9.3 percent in December and rose 5.2 percent on the month after dropping 5.5 percent previously.
Exports of electronics products rose 0.7 percent on the year after dropping 11.7 percent previously, while exports of non-electronic products surged with an increase of 21.2 percent after a previous increase of 1.4 percent. This large increase in non-electronic exports was largely driven by exports of specialised machinery, non-monetary gold and pharmaceuticals. Exports to China, the US and Hong Kong recorded stronger year-over-year growth but exports to the European Union fell after a previous increase while exports to Japan fell at a more pronounced rate.
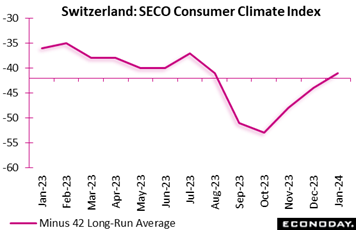 Switzerland’s SECO consumer climate index, which has been recalibrated to a monthly from a quarterly indicator, improved from last October's minus 53 and December's minus 44 to minus 41 but fell well short of the market consensus at minus 28. Nevertheless, the monthly profile shows steady gains since the start of the fourth quarter and the January print was just above the new minus 42 long-term average. Switzerland’s SECO consumer climate index, which has been recalibrated to a monthly from a quarterly indicator, improved from last October's minus 53 and December's minus 44 to minus 41 but fell well short of the market consensus at minus 28. Nevertheless, the monthly profile shows steady gains since the start of the fourth quarter and the January print was just above the new minus 42 long-term average.
Among components, the past financial situation (minus 59 after minus 64) made useful ground as did the financial outlook (minus 40 after minus 46) and, to a lesser extent, buying intentions (minus 38 after minus 40). The economic outlook (minus 28 after minus 29) was little changed but expected inflation (105 after 109) declined further from last September's peak (118).
Overall, the results are cautiously optimistic but hardly in line with a household sector that is about to provide a significant boost to real GDP growth.
Global economic data on net are coming in within consensus forecasts and near the breakeven zero-line for the Relative Performance Index (RPI), at minus 7 overall and minus 8 when excluding prices (RPI-P) to indicate only a marginal degree of underperformance.
A surprising, and possibly spurious, year-end bounce in industrial production was largely responsible for lifting the Eurozone RPI to 8 and the RPI-P to 21. Real economic activity in general is running slightly ahead of market expectations but, more importantly for the European Central Bank, recent inflation data have surprised on the downside. Disagreements over policy on the ECB’s Governing Council are becoming more heated.
In Switzerland, fresh downside surprises in the January inflation reports together with unexpectedly soft consumer sentiment reduced the RPI to minus 32 and the RPI-P to minus 15. Recent developments in prices and the real economy mean that the Swiss National Bank remains a leading contender to be the first among the major central banks to cut policy rates.
In the UK, the onset of recession came as no surprise. Indeed, although the fourth quarter contraction in GDP was slightly steeper than anticipated, the monthly December data together with January retail sales easily beat expectations. Still, with inflation undershooting forecasts, a mixed bag of data put the RPI and RPI-P at 7 and 33 respectively. A cut in Bank Rate in March remains unlikely.
By contrast, Japan’s slide into recession was wholly unexpected and helped to lower both the RPI and RPI to minus 40, their weakest prints since last September. The fall in both indices dampened Bank of Japan tightening speculation, adding to the yen’s problems as the dollar rose above the 150 level. In turn this has raised the possibility of fresh BoJ intervention in the currency markets.
In Canada, disappointingly soft reports on housing and manufacturing nudged the RPI and RPI-P back below zero. However, at minus 12, both measures show recent economic activity in general performing only slightly weaker than forecast and a rate cut by the Bank of Canada before the second quarter still looks improbable.
US data, which had been slightly outperforming, are now coming in as forecast, at minus 2 overall and plus 6 less prices. These readings imply no near-term change for Federal Reserve policy.
**Contributing to this article were Jeremy Hawkins, Brian Jackson, Mace News, Max Sato, and Theresa Sheehan
Wednesday’s minutes from the Federal Reserve’s will be the week’s central focus. Though the meeting was three weeks ago, the minutes will nevertheless be dissected for hints on when the Fed is likely to cut rates. A small 5-basis-point cut on Tuesday is expected for China’s 5-year loan prime rate to 4.15 percent with no change expected for the 1-year rate at 3.45 percent. The Bank of Korea is not expected to change their policy rate at their announcement on Thursday.
Canada’s CPI on Tuesday is expected to moderate slightly to 3.2 percent while the country’s retail sales on Thursday are expected to post a solid rebound. Australia’s quarterly wage price index on Wednesday is expected to slow on a quarter-over-quarter basis but not on the year where the consensus is a 1 tenth climb to 4.1 percent. February’s PMI flashes on Thursday are expected to show limited improvement for Germany as well as the Eurozone as a whole.
Japanese Machinery Orders for December (Sun 2350 GMT; Mon 0850 JST; Sun 1850 EST)
Consensus Forecast, Month over Month: 3.1%
Consensus Forecast, Year over Year: -0.7%
Machinery orders are expected to rebound 3.1 percent in December for year-over-year contraction of 0.7 percent, the latter would compare with 5.0 percent contraction in November. The government’s repeated its assessment in the November report that machinery orders were “pausing”.
China Loan Prime Rates (Tue 0915 CST; Tue 0115 GMT; Mon 2015 EST)
Consensus Change: 1-Year Rate: 0 basis points
Consensus Level: 3.45%
Consensus Change: 5-Year Rate: -5 basis points
Consensus Level: 4.15%
The People's Bank of China is expected to hold their 1-year loan prime rate steady at 3.45 percent but cut the 5-year rate by 5 basis points to 4.15 percent.
Canadian CPI for January (Tue 0830 EST; Tue 1330 GMT)
Consensus Forecast, Month over Month: 0.4%
Consensus Forecast, Year over Year: 3.2%
After December’s 3-tenths rise to 3.4 percent, consumer prices in January are expected to fall back 2 tenths to 3.2 percent.
Japanese Merchandise Trade for January (Wed 0850 JST; Tue 2350 GMT; Tue 1850 EST)
Consensus Forecast: -¥1,923 billion
Consensus Forecast, Imports Y/Y: -7.5%
Consensus Forecast, Exports Y/Y: 11.5%
A deficit of ¥1,923 billion is the consensus for January’s trade balance versus a surplus of ¥68.89 billion in December. Supply constraints tied to a powerful earthquake and suspended output at Toyota may affect January’s report.
Australian Wage Price Index for the Fourth Quarter (Wed 1130 AEDT; Wed 0030 GMT; Tue 1930 EST)
Consensus Forecast, Quarter over Quarter: 0.9%
Consensus Forecast, Year over Year: 4.1%
Wage growth in the fourth quarter is expected to rise 0.9 percent on the quarter and 4.1 percent on the year. These would compare with third-quarter rates of 1.3 and 4.0 percent.
Eurozone: EC Consumer Confidence Flash for February (Wed 1600 CET; Wed 1500 GMT; Tue 1000 EST)
Consensus Forecast: -15.7
Consumer confidence in February is expected to improve to minus 15.7 versus January’s minus 16.1 which was once again was well short of the minus 11.3 long-run average.
Bank of Korea Announcement (Thu 1000 KST; Thu 0100 GMT; Wed 2000 EST)
Consensus Forecast, Change: 0 basis points
Consensus Forecast, Level: 3.50%
Projecting a moderating trend for inflation, the Bank of Korea has kept policy unchanged since early 2023 which is the expectation once again for its February meeting.
French Business Climate Indicator for January (Thu 0845 CET; Thu 0745 GMT; Thu 0245 EST)
Consensus Forecast: 100
At a consensus 100 for January, forecasters see the business climate indicator inching higher from December’s 99.
German PMI Flashes for February (Thu 0930 CET; Thu 0830 GMT; Thu 0330 EST)
Consensus Forecast, Composite: 47.6
Consensus Forecast, Manufacturing: 46.5
Consensus Forecast, Services: 48.2
Manufacturing has been in long contraction though January’s 45.5 was noticeably better than December’s 43.3. Further improvement to 46.5 is expected for February. Services, at 47.7 in January, are seen at 48.2. Consensus for February’s composite is 47.6 following January’s 47.0.
Eurozone PMI Flashes for February (Thu 1000 CET; Thu 0900 GMT; Thu 0400 EST)
Consensus Forecast, Composite: 48.5
Consensus Forecast, Manufacturing: 47.1
Consensus Forecast, Services: 48.7
The composite is expected to rise to 48.5 in February versus 47.9 in January. Manufacturing is expected at 47.1 versus January’s better-than-expected 46.6 with services expected at 48.7 from January’s lower-than-expected 48.4.
Canadian Retail Sales for December (Thu 0830 EST; Thu 1330 GMT)
Consensus Forecast, Month over Month: 0.8%
Retail sales in December are expected to rise 0.8 percent on the month following a weaker-than-expected 0.2 percent decline in November.
German Ifo for February (Fri 1000 CET; Fri 0900 GMT; Fri 0400 EST)
Consensus Forecast, Business Climate: 85.5
Consensus Forecast, Current Conditions: 87.0
Consensus Forecast, Business Expectations: 83.9
The business climate index has missed the consensus the last three reports. February’s consensus is 85.5 which would be little changed from January’s 85.2.
|
