|
Jerome Powell’s semiannual testimony beginning on Wednesday could firm or could reset expectations for how long the markets have to wait for a US rate cut. The Federal Reserve may be reluctant to stimulate the economy and in turn spark more demand for workers and higher wages at a time when labor supplies are still stretched. This would be an unwanted source of inflation and be unwelcome to businesses that are still dealing with the rising costs of attracting and retaining workers. We’ll assess such issues in detail in the week’s rundown of events that begins with monetary policy.
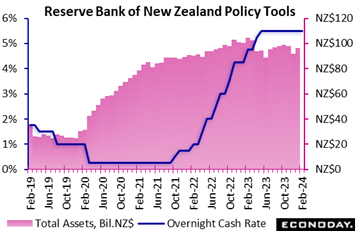 The Reserve Bank of New Zealand's left the official cash rate unchanged at 5.50 percent for the fifth consecutive meeting, in line with the consensus forecast. Prior to this pause, officials had increased policy rates by a cumulative 525 basis points beginning in November 2021 as part of efforts to return inflation to their target range of one percent to three percent. The Reserve Bank of New Zealand's left the official cash rate unchanged at 5.50 percent for the fifth consecutive meeting, in line with the consensus forecast. Prior to this pause, officials had increased policy rates by a cumulative 525 basis points beginning in November 2021 as part of efforts to return inflation to their target range of one percent to three percent.
Headline CPI inflation fell to 4.7 percent in the three months to December from 5.6 percent in the three months to September, with core inflation falling from 5.8 percent to 4.4 percent, its lowest level since mid-2021. Officials still expect inflation will decline back to the target range in the second half of 2024 and they now also expect a fall to the mid-point of that range in 2025. However, although they judge risks to the inflation outlook to be balanced, they also consider that "from a monetary policy perspective, there remains less capacity to absorb upside inflation surprises, relative to downside surprises". This is a hawkish echo of the prior week’s statement from the Reserve Bank of Australia.
Reflecting this assessment, RBNZ officials concluded that "interest rates need to remain at a restrictive level for a sustained period of time". They also advised that they expect policy rates will need to stay around current levels for "an extended period", with rate cuts not projected to take place until 2025.
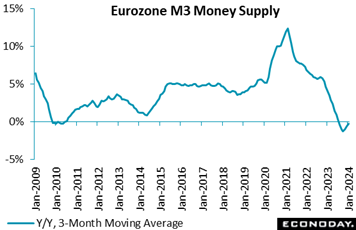 Broad money growth in the Eurozone was again positive at the start of the year. January’s 0.1 percent yearly rise followed December's upwardly revised 0.2 percent post to lift the headline 3-month moving average from minus 0.6 percent to minus 0.2 percent, in line with the market consensus. On the month, M3 fell 0.2 percent but this came after a 0.8 percent gain previously. Broad money growth in the Eurozone was again positive at the start of the year. January’s 0.1 percent yearly rise followed December's upwardly revised 0.2 percent post to lift the headline 3-month moving average from minus 0.6 percent to minus 0.2 percent, in line with the market consensus. On the month, M3 fell 0.2 percent but this came after a 0.8 percent gain previously.
The marginal dip in the annual rate was largely attributable to narrow money M1 which saw an 8.6 percent drop following an 8.5 percent slide in December. Among M3 counterparts, private sector loans were off 0.1 percent on the year, down from a 0.2 percent increase in December. After adjustment for loan sales and securitisation as well for positions due to notable cash pooling services, the rate eased a tick to 0.4 percent. Within this, adjusted loans to households (0.3 percent after 0.4 percent) slowed a little further and borrowing by non-financial corporations (0.2 percent after 0.5 percent) similarly cooled.
In sum, the January data show that the effects of earlier ECB tightening are still filtering through. Still, the trend rate of decline in M3 is becoming gradually more shallow and suggests that the peak impact has now passed.
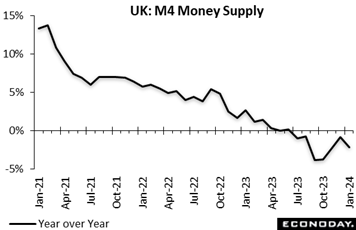 Broad money in the UK dipped 0.1 percent on the month in January which, with base effects strongly negative, was enough to reduce annual growth from minus 0.9 percent to minus 2.2 percent. Even so, annualised growth over the last three months was still positive at 1.4 percent. M4 lending was flat, the first month that it has not expanded since last September but leaving a still solid 2.6 percent 3-monthly annualised rate. Broad money in the UK dipped 0.1 percent on the month in January which, with base effects strongly negative, was enough to reduce annual growth from minus 0.9 percent to minus 2.2 percent. Even so, annualised growth over the last three months was still positive at 1.4 percent. M4 lending was flat, the first month that it has not expanded since last September but leaving a still solid 2.6 percent 3-monthly annualised rate.
Excluding intermediate other financial institutions, M4 was also unchanged versus December while similarly-adjusted lending contracted 0.2 percent.
Elsewhere the financial data were again mixed. In the housing market, mortgage approvals climbed from 51,506 to 55,227 but mortgage lending fell a further £1.09 billion. Net lending to individuals picked up from £0.4 billion to £0.8 billion while overall consumer credit rose £1.877 billion after a £1.257 billion advance.
In sum, the financial data probably remain in line with at least a stabilisation in overall economic activity if not some improvement. As such, January's report should bolster the case of those at the Bank of England arguing against any cut in Bank Rate next month.
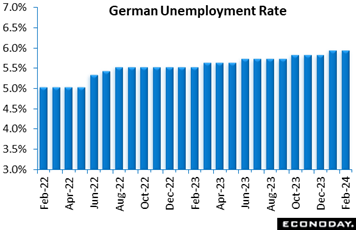 The German labour market showed some further signs of easing in February. An 11,000 increase in the joblessness total was large enough to keep the unemployment rate at 5.9 percent, in line with January's upwardly level but a tick above the market consensus. The German labour market showed some further signs of easing in February. An 11,000 increase in the joblessness total was large enough to keep the unemployment rate at 5.9 percent, in line with January's upwardly level but a tick above the market consensus.
Looking forward, vacancies dropped 8,000 following a revised 1,000 dip last time, consistent with cooling demand for new hires.
Surveys suggest that the sustained weakness of consumer demand has been impacting businesses' hiring plans for a while, particularly in manufacturing. Even so, firms remain reluctant to shed staff meaning that, in the main, the labour market remains historically tight.
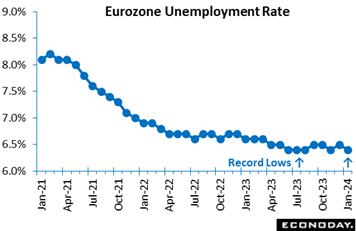 In data for January, the Eurozone’s labour market strengthened albeit from a slightly weaker revised base in December. Joblessness declined a further 34,000 on the month which was enough to reduce the unemployment rate to 6.4 percent from the previous period's upwardly revised 6.5 percent. This was in line with the market consensus and matched the all-time low. The dip in the overall rate mainly reflected falls in both France (7.5 percent after 7.6 percent) and Spain (11.7 percent after 11.8 percent). In data for January, the Eurozone’s labour market strengthened albeit from a slightly weaker revised base in December. Joblessness declined a further 34,000 on the month which was enough to reduce the unemployment rate to 6.4 percent from the previous period's upwardly revised 6.5 percent. This was in line with the market consensus and matched the all-time low. The dip in the overall rate mainly reflected falls in both France (7.5 percent after 7.6 percent) and Spain (11.7 percent after 11.8 percent).
The ECB will view January's report with some concern. The Eurozone labour market remains very tight, and possibly tight enough to prevent the decline in wage rates needed if the bank is to meet its price stability goals. As such, the January data provide further reason for the Governing Council to be cautious about the speed at which they cut rates in 2024.
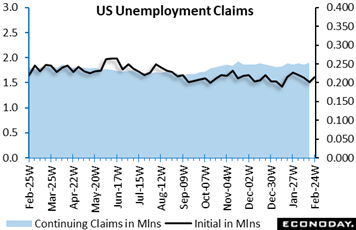 Initial jobless claims in the US moved back higher in the February 24 week, to 215,000 and up 13,000 that followed three straight declines. Given the prior declines, the rise in the latest week wasn't enough to keep the 4-week average from falling 3,000 to 212,500. Initial jobless claims in the US moved back higher in the February 24 week, to 215,000 and up 13,000 that followed three straight declines. Given the prior declines, the rise in the latest week wasn't enough to keep the 4-week average from falling 3,000 to 212,500.
Continuing claims in lagging data for the February 17 week rose 45,000 to 1.905 million lifting this 4-week average by nearly 2,000 to 1.880 million which is up nearly 50,000 from mid-January. The unemployment rate for insured workers edged back higher to a still low 1.3 percent.
Though the trend for initial claims, despite the latest week's rise, remains steady and low, continuing claims have been edging higher. Nevertheless, US claims data are consistent with a tight labor market in which an imbalance between labor supply and labor demand continues to be felt.
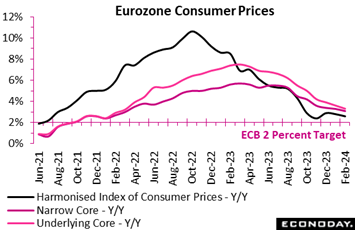 Eurozone inflation extended its downtrend in mid-quarter. Having peaked at 10.6 percent in October 2022, the annual rate has declined almost every month since and, at a flash 2.6 percent in February, hit its second lowest mark since July 2021. The headline rate is now just 0.6 percentage points above its medium-term target; importantly too, core inflation fell again. The narrow core cooled by 0.2 percentage points to 3.1 percent, a couple of ticks above forecasts but its lowest post since March 2022. The underlying core excluding just energy and unprocessed food dropped a steeper 0.3 percentage points to 3.3 percent. Elsewhere, inflation in non-energy industrial goods decreased from 2.0 percent to 1.6 percent and it also declined sharply in food, alcohol and tobacco (4.0 percent after 5.6 percent). Energy (minus 3.7 percent after minus 6.1 percent) provided another boost and, significantly, services (3.9 percent after 4.0 percent) were only marginally weaker. Eurozone inflation extended its downtrend in mid-quarter. Having peaked at 10.6 percent in October 2022, the annual rate has declined almost every month since and, at a flash 2.6 percent in February, hit its second lowest mark since July 2021. The headline rate is now just 0.6 percentage points above its medium-term target; importantly too, core inflation fell again. The narrow core cooled by 0.2 percentage points to 3.1 percent, a couple of ticks above forecasts but its lowest post since March 2022. The underlying core excluding just energy and unprocessed food dropped a steeper 0.3 percentage points to 3.3 percent. Elsewhere, inflation in non-energy industrial goods decreased from 2.0 percent to 1.6 percent and it also declined sharply in food, alcohol and tobacco (4.0 percent after 5.6 percent). Energy (minus 3.7 percent after minus 6.1 percent) provided another boost and, significantly, services (3.9 percent after 4.0 percent) were only marginally weaker.
Regionally, headline inflation was lower in most member states, including France (3.1 percent after 3.4 percent), Germany (2.7 percent after 3.1 percent) and Spain (2.9 percent after 3.5 percent). Italy was only flat (0.9 percent) but remained beneath the target rate.
The flash February data should sit pretty well with the ECB but will certainly not be enough to force a cut in key interest rates as soon as next week. Most Governing Council members will want to see further progress in the core rate and some additional softening in inflation in services.
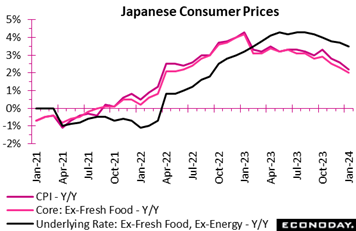 Consumer inflation in Japan continued easing in January but not as fast as expected as downward pressures from falling subsided energy costs, smaller food markups and hotel fee gains were partly offset by a surge in prices for overseas package tours and by higher auto insurance premiums. Consumer inflation in Japan continued easing in January but not as fast as expected as downward pressures from falling subsided energy costs, smaller food markups and hotel fee gains were partly offset by a surge in prices for overseas package tours and by higher auto insurance premiums.
The core CPI (excluding fresh food prices) hit the Bank of Japan’s 2.0 percent target (versus the 1.9 percent consensus) and was down from 2.3 percent in December. The year-over-year increase in the total CPI slowed to a 22-month low of 2.2 percent, down from 2.6 percent in December and 2.8 percent in November but was also slightly above the consensus. Underlying inflation measured by the core-core CPI (excluding fresh food and energy) decelerated to an 11-month low of 3.5 percent from 3.7 percent.
Service costs rose at a faster pace than goods prices for the third month in a row as firms raise wages to secure workers amid widespread labor shortages. Service prices excluding owners' equivalent rent rose 3.2 percent on the year in January. By contrast, goods prices excluding fresh food gained 1.9 percent, slowing clearly from December’s 2.3 percent increase.
Despite easing price pressures, many households have seen their spending power eroded by inflation. The pickup in nominal wages extended into December but real wages fell on the year for the 21st straight month.
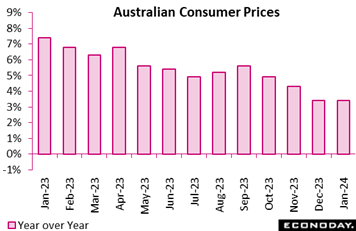 Monthly CPI data show that headline inflation in Australia was unchanged at 3.4 percent in January, below the consensus forecast for 3.6 percent. This follows three consecutive declines and leaves headline inflation above the Reserve Bank of Australia's target range of two to three percent. Monthly CPI data show that headline inflation in Australia was unchanged at 3.4 percent in January, below the consensus forecast for 3.6 percent. This follows three consecutive declines and leaves headline inflation above the Reserve Bank of Australia's target range of two to three percent.
The steady showing reflected offsetting moves across major categories. Food prices rose 4.4 percent on the year in January after advancing 4.0 percent in December, while clothing and footwear prices rose 0.4 percent after a previous decline of 0.8 percent. Fuel prices, in contrast, slowed sharply, up 3.1 percent on the year after a previous increase of 5.3 percent, while the year-over-year increase in housing costs moderated from 5.2 percent to 4.6 percent.
The measure of inflation that excludes volatile items – including fuel and holiday travel – fell from 4.2 percent in November to 4.1 percent in December, while the monthly trimmed mean measure fell from 4.0 percent to 3.8 percent.
RBA officials left policy rates on hold at their February meeting, noting that "inflation is easing". January’s update will likely reinforce their confidence that previous policy tightening is exerting downward pressure on inflation and strengthen the case for policy to remain on hold at their next meeting later this month.
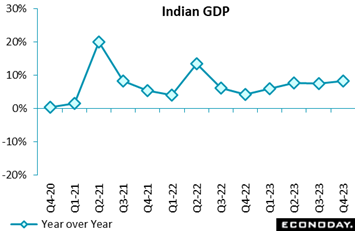 India's gross domestic product expanded 8.4 percent on the year in the three months to December, picking up from an increase of 7.6 percent in the three months to September. Monthly industrial production and PMI survey data showed more subdued but still solid conditions over this period, though more up-to-date data have shown stronger growth in January. India's gross domestic product expanded 8.4 percent on the year in the three months to December, picking up from an increase of 7.6 percent in the three months to September. Monthly industrial production and PMI survey data showed more subdued but still solid conditions over this period, though more up-to-date data have shown stronger growth in January.
The Reserve Bank of India left policy rates on hold at its most recent meeting in early February, with officials noting that they expect growth to remain supported by investment demand and strong business and consumer sentiment. With the latest GDP data showing stronger economic growth, it seems likely that upside risks to the inflation outlook will remain the RBI's primary focus in upcoming meetings.
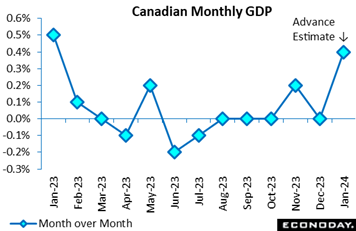 Canada's economy recovered at an annualized rate of 1.0 percent in the fourth quarter, as expected, following 0.5 percent contraction in the third quarter. Household consumption also rose at a 1.0 percent pace contributing 0.5 percentage points to the fourth- quarter’s growth. Net exports, benefiting from crude oil and crude bitumen, contributed 1.8 percentage points. On the downside, business investment fell sharply, trimming the quarter’s growth by a full percentage point. Government spending and housing investment also fell Canada's economy recovered at an annualized rate of 1.0 percent in the fourth quarter, as expected, following 0.5 percent contraction in the third quarter. Household consumption also rose at a 1.0 percent pace contributing 0.5 percentage points to the fourth- quarter’s growth. Net exports, benefiting from crude oil and crude bitumen, contributed 1.8 percentage points. On the downside, business investment fell sharply, trimming the quarter’s growth by a full percentage point. Government spending and housing investment also fell
Looking at monthly data as tracked in the accompanying graph, Canada's economic activity stalled in December, coming in unchanged though StatCan’s estimate for January, at a sharp 0.4 percent rebound, looks for a strong start to 2024. December’s flat performance came even as activity increased in 14 of 20 sectors.
Good-producing industries declined 0.2 percent on the month after expanding 0.7 percent in November while services were flat for a second consecutive month. Educational services and healthcare & social services both fell on them month in contrast to a strong gains for both retail and wholesale trade as well as real estate and rental and leasing.
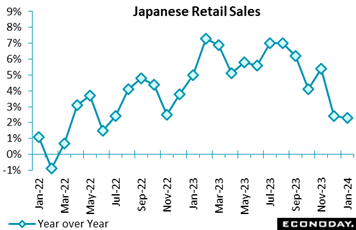 Japanese retail sales in January moderated only slightly to a 2.3 percent gain on the year after increases of 2.4 percent in December and 5.4 percent in November, as sales of vehicles and clothing lost more steam after recent gains and easing inflation continued lowering the values of foodstuffs and fuels. The consensus forecast was a 2.0 percent rise. Japanese retail sales in January moderated only slightly to a 2.3 percent gain on the year after increases of 2.4 percent in December and 5.4 percent in November, as sales of vehicles and clothing lost more steam after recent gains and easing inflation continued lowering the values of foodstuffs and fuels. The consensus forecast was a 2.0 percent rise.
The number of visitors from other countries has recovered to pre-Covid levels, supporting retailers. The year-over-year increase in department store sales picked up after slowing in December, but looking ahead, sharp gains are unlikely as sales have already recovered from the pandemic slump and pent-up demand has waned.
The Ministry of Economy, Trade and Industry maintained its assessment after downgrading it in January, saying retail sales are "taking one step forward and one step back." Previously, sales were "on an uptrend."
The government said in its monthly economic report in the prior week that Japan still needs monetary and fiscal stimulus as well as growth strategies to keep from falling back into deflation, repeating its request first made in May 2022 that the Bank of Japan should "achieve the price stability target of two percent in a sustainable and stable manner, accompanied by wage increase."
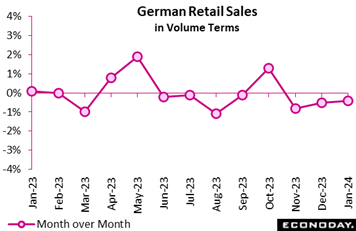 German retailers continued to struggle at the start of the year. Following a 0.5 percent monthly drop in December, volumes fell a further 0.4 percent, easily undershooting the market consensus and making for a third decline in as many months. Indeed, purchases have expanded only once since last May. Unadjusted annual growth was minus 1.6 percent, up from minus 3.4 percent but below zero for the sixth time in the last seven months. German retailers continued to struggle at the start of the year. Following a 0.5 percent monthly drop in December, volumes fell a further 0.4 percent, easily undershooting the market consensus and making for a third decline in as many months. Indeed, purchases have expanded only once since last May. Unadjusted annual growth was minus 1.6 percent, up from minus 3.4 percent but below zero for the sixth time in the last seven months.
The January update is consistent with the sustained weakness of consumer confidence and with sentiment deteriorating again in February. Prospects for March are probably no better. Spending on services has been more robust but private consumption could easily subtract from GDP growth in the first quarter.
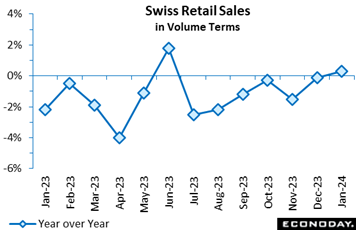 Swiss retail sales were much firmer than expected in January. A 0.7 percent monthly rise was the best performance since last June and following a shallower revised 0.3 percent fall in December, lifted volumes to a 7-month high. Annual workday adjusted growth was 0.3 percent, up from minus 0.1 percent and the first positive post since the middle of last year. Swiss retail sales were much firmer than expected in January. A 0.7 percent monthly rise was the best performance since last June and following a shallower revised 0.3 percent fall in December, lifted volumes to a 7-month high. Annual workday adjusted growth was 0.3 percent, up from minus 0.1 percent and the first positive post since the middle of last year.
The monthly headline gain was largely due to food, drink and tobacco where purchases jumped 1.5 percent having declined in each of the previous three months. Discretionary spending was up a more modest 0.6 percent but this was its third increase in the last four months. Auto fuel was down 0.4 percent.
The January update leaves overall sales 0.7 percent above their average level in the fourth quarter when they rose 0.3 percent versus the third quarter. Consumer confidence is not historically high but is improving and this seems to be providing some support for spending.
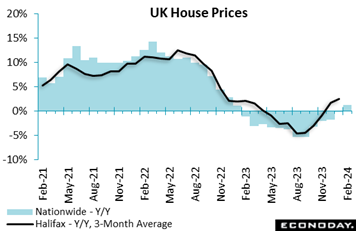 UK house prices again easily beat expectations in February. A second successive 0.7 percent monthly rise in the Nationwide's measure was more than double the market consensus and large enough to lift the annual inflation rate to 1.2 percent (blue column in graph), its first positive print in more than a year. Prices are now around 3 percent less than the record peak seen in the summer of 2022. UK house prices again easily beat expectations in February. A second successive 0.7 percent monthly rise in the Nationwide's measure was more than double the market consensus and large enough to lift the annual inflation rate to 1.2 percent (blue column in graph), its first positive print in more than a year. Prices are now around 3 percent less than the record peak seen in the summer of 2022.
Mortgage applications have strengthened significantly in recent months and the Nationwide noted that a fall in borrowing costs has provided some support for demand. Even so, the lender sees a clouded near-term outlook due to uncertainty over the future path of interest rates and a generally subdued real economy. In addition, house prices remain very high relative to earnings.
Nonetheless, February's update underlines the surprising resilience of the housing market in the face of what has been aggressive BoE tightening. Halifax’s February report will be posted on Thursday of the coming week.
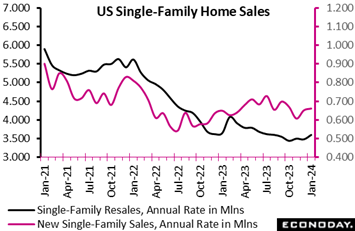 Sales of new single-family homes in US rose 1.5 percent in January to 661,000 units and were up 1.8 percent compared to January 2023. Though somewhat below Econoday’s consensus for 685,000 units, the gain was supported by the scarcity of existing home stock and what was in January more moderate mortgage rates. The Freddie Mac average monthly rate for a 30-year fixed rate mortgage hit a near term peak of 7.65 percent in October 2023, slipped to 7.44 percent in November, and further declined to 6.82 percent in December and 6.64 percent in January. However, mortgage rates are back on the rise toward 7 percent again which could put a chill on future sales. Sales of new single-family homes in US rose 1.5 percent in January to 661,000 units and were up 1.8 percent compared to January 2023. Though somewhat below Econoday’s consensus for 685,000 units, the gain was supported by the scarcity of existing home stock and what was in January more moderate mortgage rates. The Freddie Mac average monthly rate for a 30-year fixed rate mortgage hit a near term peak of 7.65 percent in October 2023, slipped to 7.44 percent in November, and further declined to 6.82 percent in December and 6.64 percent in January. However, mortgage rates are back on the rise toward 7 percent again which could put a chill on future sales.
The supply of new single-family homes available for sale was unchanged in January at 8.3 months and only slightly above the 8.1 in January 2023. The median price of a new single-family home rose 1.8 percent to $420,700 in January from $413,100 in December, but was down 2.6 percent from $432,100 in January 2023. Competition for homes in the existing market continues to drive some buyers to consider new construction, especially when there is a dip in mortgage rates that improves home affordability.
When the dip occurs, buyers will be willing to consider new construction at any stage of construction in order to lock in the more favorable rate. Homes under construction accounted for 44 percent of sales in January compared to 42 percent in December and 43 percent in January last year; 13 percent of buyers bought homes not yet started compared to 14 percent in December and 16 percent in January 2023.
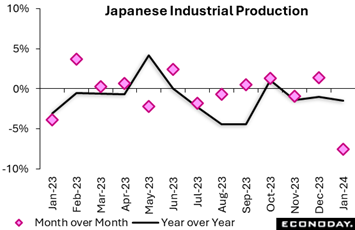 Japan's industrial production plunged 7.5 percent on the month in January, hit by suspended vehicle output over a safety test scandal, after rebounding by 1.4 percent in December and falling 0.9 percent in November. The median forecast was a 7.0 percent drop. Japan's industrial production plunged 7.5 percent on the month in January, hit by suspended vehicle output over a safety test scandal, after rebounding by 1.4 percent in December and falling 0.9 percent in November. The median forecast was a 7.0 percent drop.
From a year earlier, factory output posted a third straight drop, down 1.5 percent (versus consensus for a 1.8 percent decline), after falling 1.0 percent in the prior month. The powerful New Year's Day earthquake in the northwestern region of Hokuriku has also reduced electronic parts supply.
The January slump was caused by suspension of all domestic production by Toyota Motor group firm Daihatsu over a vehicle safety scandal which officials said will have a widespread impact beyond the auto industry. To make matters worse, Toyota said in late January that it would suspend shipments of 10 models after its supplier Toyota Industries admitted to cheating on engine testing.
The Ministry of Economy, Trade and Industry expects output to post a modest 0.8 percent monthly rebound in February and rise a further 2.0 percent in March. Nevertheless, the ministry downgraded its assessment for the first time in six months, saying industrial output "has weakened while taking one step forward and one step back." Previously, it had simply said output was "taking one step forward and one step back."
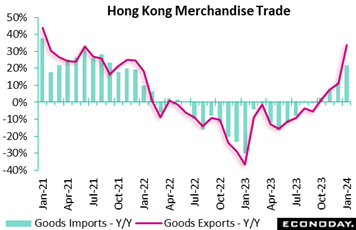 Hong Kong's merchandise trade balance shifted from a deficit of HK$59.8 billion in December to a surplus of HK$3.6 billion in January. This is the first surplus since January 2022. Exports rose 33.6 percent on the year in January after advancing 11.0 percent in December, while imports rose 21.7 percent after a previous increase of 11.6 percent. Hong Kong's merchandise trade balance shifted from a deficit of HK$59.8 billion in December to a surplus of HK$3.6 billion in January. This is the first surplus since January 2022. Exports rose 33.6 percent on the year in January after advancing 11.0 percent in December, while imports rose 21.7 percent after a previous increase of 11.6 percent.
This move into surplus and large year-over-year growth in exports and imports largely reflects the timing of lunar new year holidays, which occurred in January last year but in February this year. This means the number of working days - and, as a result, the volume of trade flows - were somewhat lower than they otherwise would have been in January 2023 but were at more normal levels in January 2024. Similarly, working days and trade volumes were at more normal levels in February 2023 but lower than they otherwise would have been in February 2024.
This, in turn, means that year-over-year growth in trade volumes is somewhat stronger than it would otherwise be in January 2024 and will likely be somewhat weaker in February 2024. Because of this factor, officials noted that it will be more meaningful to examine January and February data combined, when available, to assess the strength of trade flows at the start of the year.
The large increase in headline exports in January was broad-based across major trading partners, with exports to mainland China, the US, and Taiwan advancing 54.2 percent, 11.5 percent, and 46.8 percent respectively. Officials continue to expect external factors will weigh heavily on export performance in coming months.
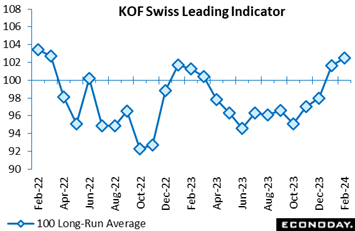 Switzerland’s leading economic indicator remained above its 100 long-run average for a second straight month in February. However, at 101.6 the latest reading was slightly short of the market consensus and nearly 1 point under January's upwardly revised level. Switzerland’s leading economic indicator remained above its 100 long-run average for a second straight month in February. However, at 101.6 the latest reading was slightly short of the market consensus and nearly 1 point under January's upwardly revised level.
Prospects for the manufacturing and construction sectors improved but the outlook for financial and insurance services, hospitality, other services and foreign demand all deteriorated. Consumption was broadly stable.
The February reading points to near-term growth a little above its historic norm and so adds no additional pressure on the Swiss National Bank to cut interest rates next month, even with inflation having stabilised below 2 percent since last May.
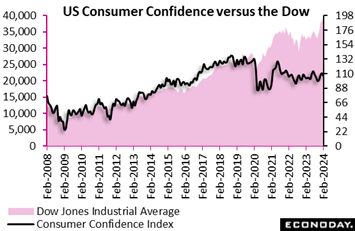 The Conference Board's US consumer confidence index fell unexpectedly in February, down 4.2 points to 106.7 after a sizeable downward revision to 110.9 in January (previously 114.8). The revision in the January index pulls back on the perceived upward momentum for consumer confidence. Taking into account the January revision, overall consumer confidence is much the same over the past three months. The February reading was well below the consensus of 115.0 in the Econoday survey of forecasters. The Conference Board's US consumer confidence index fell unexpectedly in February, down 4.2 points to 106.7 after a sizeable downward revision to 110.9 in January (previously 114.8). The revision in the January index pulls back on the perceived upward momentum for consumer confidence. Taking into account the January revision, overall consumer confidence is much the same over the past three months. The February reading was well below the consensus of 115.0 in the Econoday survey of forecasters.
A review of the consumer confidence index over the past year suggests that underlying attitudes about the present and future economy have not altered much behind the month-to-month variation. Perceptions of current conditions and expectations for six months from now have varied more over time, but the story remains essentially the same. Consumers continue to worry about inflation – although less than they did – and about remaining employed. They are concerned about things like geopolitical events and the impact on the economic outlook, and see less possibility for lower financing costs in the near future. The prospect of higher earnings is moderating along with the cooling in job openings and the pace of hiring.
The current conditions index fell to 147.2 in February after rising to 154.9 in January, possibly reflecting that some households saw a gain in income through cost-of-living adjustments (COLA) or mandated increases in minimum wages. The six-month expectations index dipped to 79.8 in February after 81.5 in January. The Conference Board notes that an expectations reading below 80 is consistent with an outlook for recession, though the February level is only marginally below this threshold.
Four of the report’s five components fell in February. Consumers are less confident about present business conditions and present employment, and about expected business conditions and expected employment. The component for expected personal income is a bit stronger and above January's anticipated income gains but points to only modest anticipation of higher income ahead.
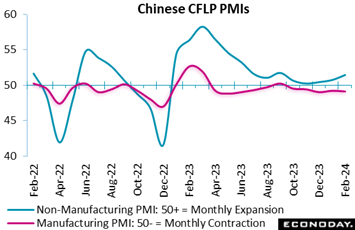 Official Chinese PMI survey data show little change in conditions in China's aggregate economy in February, with the data showing further contraction in the manufacturing sector and somewhat stronger growth in the non-manufacturing sector. The results suggest China's economy remains weighed down by weakness in the property market despite recent measures aimed at improving liquidity conditions. Official Chinese PMI survey data show little change in conditions in China's aggregate economy in February, with the data showing further contraction in the manufacturing sector and somewhat stronger growth in the non-manufacturing sector. The results suggest China's economy remains weighed down by weakness in the property market despite recent measures aimed at improving liquidity conditions.
The headline index for the CFLP manufacturing PMI fell from 49.2 in January to 49.1 in February, just below the consensus forecast of 49.3 and indicating contraction in the sector for the fifth consecutive month. In modest contrast, Standard & Poor’s manufacturing PMI increased slightly from 50.8 in January to 50.9 in February and has now indicated modest growth in the sector for four consecutive months. Respondents to the S&P PMI survey reported slightly stronger growth in output and new orders and a second consecutive increase in export orders. Yet payrolls were cut for the sixth consecutive month.
The CFLP non-manufacturing PMI survey's headline index rose from 50.7 to 51.4, above the consensus forecast of 50.8. CFLP’s composite index covering the entire economy was unchanged at 50.9 in February.
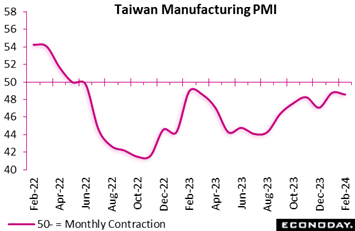 Taiwan’s manufacturing PMI shows activity again contracted in February and at a slightly more pronounced pace, falling from 48.8 in January to 48.6. This survey has indicated contraction in the sector since mid-2022. Survey respondents reported further declines in output, new orders, and new export orders in February but a second consecutive increase in payrolls. The survey's measure of business confidence shows that respondents expect output to increase over the next twelve months, with stronger demand conditions anticipated in 2024. Respondents reported a smaller increase in input costs and a second consecutive reduction in selling prices. Taiwan’s manufacturing PMI shows activity again contracted in February and at a slightly more pronounced pace, falling from 48.8 in January to 48.6. This survey has indicated contraction in the sector since mid-2022. Survey respondents reported further declines in output, new orders, and new export orders in February but a second consecutive increase in payrolls. The survey's measure of business confidence shows that respondents expect output to increase over the next twelve months, with stronger demand conditions anticipated in 2024. Respondents reported a smaller increase in input costs and a second consecutive reduction in selling prices.
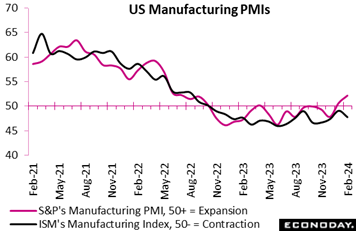 Manufacturing PMIs in the US were mixed in February. The closely watched ISM index remained in contraction territory for a 16th straight month, falling by 1.3 points to a lower-than-expected 47.8. New orders fell sharply to 49.2 from 52.5 with backlog orders, though rising 1.6 points, still in sizable contraction at 46.3. Output fell 2.0 points to 48.4 with employment down 1.2 points to 45.9. Nevertheless the ISM continues to expect the main index to pop above the neutral line of 50 in March or April. Manufacturing PMIs in the US were mixed in February. The closely watched ISM index remained in contraction territory for a 16th straight month, falling by 1.3 points to a lower-than-expected 47.8. New orders fell sharply to 49.2 from 52.5 with backlog orders, though rising 1.6 points, still in sizable contraction at 46.3. Output fell 2.0 points to 48.4 with employment down 1.2 points to 45.9. Nevertheless the ISM continues to expect the main index to pop above the neutral line of 50 in March or April.
S&P's PMI has already popped back over 50 ending February at 52.2, up 7 tenths from the mid-month flash and up 1.5 points from January's 50.7 which was the first 50-plus showing since April. This report’s details are led by the best pace for new orders since May 2022; output and job creation also rose and the sample is now building inventory. Cost pressures are another positive, easing on greater availability of raw materials and improvement in supplier performance. And a positive for the sample if not for Federal Reserve policy is the steepest pace of price hikes in nearly a year, which is further confirmation of the month's strength.
The US has pulled down the Relative Performance Index (RPI) to minus 20 for global data overall and to minus 17 less prices (RPI-P). The week’s downturn in the US RPI, which is now in sizable contraction at minus 38 and at minus 44 for the RPI-P, reflects both the rolling off strong earlier results in the calculation and the latest week’s run of mostly disappointing results, disappointment however that isn’t yet signaling any fundamental trouble for the US economy nor pulling forward a Federal Reserve rate cut.
In the Eurozone, upside surprises on headline and core inflation kept the RPI above zero at 15 and further reduced the likelihood of a cut in ECB interest rates in the coming week. At 4, the RPI-P shows real economic activity performing much as expected but still leaves an economy struggling to keep its head above water.
In Switzerland, a mixed bag of economic data saw the RPI close the week at minus 21, indicating a clear shortfall in overall economic activity versus expectations. However, with the inflation-adjusted RPI-P at exactly zero, downside surprises have been mainly limited to prices and it is this that the Swiss National Bank will be focusing on at its policy meeting later this month. A cut in the policy rate remains a possibility.
In the UK, economic activity continues to surprise on the upside and at 43 and 42 respectively, both the RPI and RPI-P show forecasters have been well wide of the mark. Pressure on the Bank of England to deliver an early rate cut has diminished further.
In Japan, surprisingly strong inflation data combined with unexpectedly soft goods production and retail sales leave the RPI at minus 1. The RPI-P is rather weaker at minus 13 but the Bank of Japan remains on course to tighten. However, the need to assess the results of ongoing wage negotiations would seem to rule out a move before April at the earliest.
By contrast, in China, both the RPI (minus 43) and RPI-P (minus 60) have been negative since late-January sustaining pressure on the authorities to provide further economic stimulus.
Fourth-quarter growth in Canada, however modest, matched expectations and means that the economy avoided recession in 2023. In fact, at minus 1, the RPI-P shows recent real economic activity in general behaving as forecast. Nonetheless, with the RPI at minus 15, downside surprises continue to dominate the inflation data which keeps open the door for a Bank of Canada rate cut, albeit very unlikely at Wednesday’s meeting.
**Contributing to this article were Jeremy Hawkins, Brian Jackson, Mace News, Max Sato, and Theresa Sheehan
Fed Chair Jerome Powell’s semiannual testimony beginning on Wednesday, and how he spins the outlook for rate cuts, will be the first of two major events in the US. The second will be Friday’s monthly employment report where slowing payroll growth together with cooling wage pressures – both favorable for rate cuts – are expected. Neither the Bank of Canada on Wednesday nor the European Central Bank on Thursday are expected to cut rates.
Tokyo consumer prices will be Tuesday’s highlight amid expectations for a pop higher in the data. Chinese consumer price data will be posted on Saturday, March 9 local time in what is expected to be another very benign report.
Updates from Germany and whether the country is sliding into recession will open on Wednesday with merchandise trade followed on Thursday with manufacturing orders and on Friday with industrial production. Declines are mostly expected for the latter reports.
Australian fourth-quarter GDP on Wednesday is expected to show modest growth, while Canada’s labour force survey on Friday is expected, much like the consensus for Friday’s US report, to retrace unusual gains from January.
Korean Industrial Production for January (Mon 0800 KST; Sun 2300 GMT; Sun 1800 EST)
Consensus Forecast, Month over Month: 1.0%
Industrial production is expected to increase 1.0 percent on the month in January on top of a 0.6 percent rise in December that followed a 3.3 percent jump in November.
Tokyo Consumer Price Index for February (Tue 0830 JST; Mon 2330 GMT; Mon 1830 EST)
Consensus Forecast, Year over Year: 2.4%
Ex-Fresh Food, Consensus Forecast: 2.4%
Ex-Fresh Food & Energy, Consensus Forecast: 3.0%
The fading of 2023 utility subsidies is expected to sharply lift Tokyo consumer prices in February. Overall prices as well as ex-fresh food prices are both expected to jump from February’s 1.6 percent to 2.4 percent. But when excluding energy along with fresh food, prices are seen little changed. at 3.0 percent versus January’s 3.1 percent.
China: S&P PMI Composite for February (Tue 0945 CST; Tue 0145 GMT; Mon 2045 EST)
Services Index, Consensus Forecast: 52.9
S&P's services PMI in February is expected to edge higher to 52.9 versus January’s 52.7 that would match December’s 52.9.
Eurozone PPI for January (Tue 1100 CET; Tue 1000 GMT; Tue 0500 EST)
Consensus Forecast, Year over Year: -8.1%
Producer prices have shown sustained weakness and are expected to fall 8.1 percent on the year in January which would compare with 10.6 percent contraction in December.
Korean CPI for February (Wed 0800 KST; Tue 2300 GMT; Tue 1800 EST)
Consensus Forecast, Month over Month: 0.4%
Consensus Forecast, Year over Year: 3.0%
Consumer prices in February, which in January slowed significantly and surprisingly to 2.8 percent from December’s 3.2 percent, are expected to edge back higher to 3.0 percent.
Australian Fourth-Quarter GDP (Wed 0030 GMT; Wed 1130 AEDT; Tue 1930 EST)
Consensus Forecast, Quarter over Quarter: 0.3%
Consensus Forecast, Year over Year: 1.4%
Fourth-quarter GDP is expected to rise a quarterly 0.3 percent for year-over-year expansion of 1.4 percent. Third-quarter respective results were growth of 0.2 and 2.1 percent as consumer spending was flat and private investment strong.
German Merchandise Trade for January (Wed 0800 CET; Wed 0700 GMT; Wed 0200 EST)
Consensus Forecast, Balance: +€21.0 billion
January’s goods balance is expected to narrow to a €21.0 billion surplus versus a greater-than-expected surplus of €22.2 billion in December that, however, masked large declines for both exports and especially imports.
Eurozone Retail Sales for January (Wed 1100 CET; Wed 1000 GMT; Wed 0500 EST)
Consensus Forecast, Month over Month: 0.0%
Consensus Forecast, Year over Year: -1.4%
Retail sales volumes in January are expected to hold unchanged on the month following a marginally deeper-than-expected 1.1 percent fall in December that left volumes down 0.8 percent on the year.
US ADP Private Payrolls for February (Wed 0815 EST; Wed 1315 GMT)
Consensus Forecast: 150,000
Forecasters see ADP's February employment number at 150,000. This would compare with January growth in private payrolls reported by the Bureau of Labor Statistics of 317,000. ADP’s number for January was a distant 107,000.
Bank of Canada Announcement (Wed 1445 GMT; Wed 0945 EST)
Consensus Forecast, Change: 0 basis points
Consensus Forecast, Level: 5.00%
Despite downside surprises for inflation data, the Bank of Canada is expected to hold policy unchanged at its March meeting.
Australian International Trade in Goods for January (Thu 1130 AEDT; Thu 0030 GMT; Wed 1930 EST)
Consensus Forecast, Balance: A$11.5 billion
Consensus for international trade in goods in January is a surplus of A$11.5 billion versus December’s as-expected A$11.0 billion surplus.
German Manufacturing Orders for January (Thu 0800 CET; Thu 0700 GMT; Thu 0200 EST)
Consensus Forecast, Month over Month: -6.0%
Consensus Forecast, Year over Year: -3.6%
Manufacturing orders are expected to fall a monthly 6.0 percent in January versus December’s unexpected 8.9 percent surge tied to major orders for transport machinery. Annual contraction is seen at 3.6 percent versus December expansion of 2.1 percent.
Taiwan CPI for February (Thu 1600 CST; Thu 0800 GMT; Thu 0300 EST)
Consensus, Year over Year: 2.5%
Consumer prices in February are expected to rise to 2.5 percent versus a 1.79 percent year-over-year rate in January that was much lower than the 2.2 percent consensus.
European Central Bank Announcement (Thu 1315 GMT; Thu 1415 CET; Thu 0815 EST)
Consensus Forecast, Change: 0 basis points
Consensus Forecast, Refi Rate: 4.50%
Inflation may be cooling and Germany may be sliding into recession but the European Central Bank is not expected to cut rates.
Canada Merchandise Trade Balance for January (Thu 0830 EST; Thu 1330 GMT)
Consensus Forecast: C$0.3 billion
January’s trade balance is seen in surplus of C$0.3 billion versus December’s deficit of C$0.312 billion that saw exports fall 1.9 percent on the month tied in part to partial shutdowns of vehicle production.
Japanese Household Spending for January (Fri 0830 JST; Thu 2330 GMT; Thu 1830 EST)
Consensus Forecast , Month over Month: 0.5%
Consensus Forecast , Year over Year: -4.3%
Depressed by high costs for basics and falling real wages, inflation-adjusted household spending is expected to contract by 4.3 percent on the year in January versus December contraction of 2.5 percent.
German Industrial Production for January (Fri 0800 CET; Fri 0700 GMT; Fri 0200 EST)
Consensus Forecast, Month over Month: 0.6%
Consensus Forecast, Year over Year: -4.9%
Industrial production in January is expected to rebound 0.6 percent on the month after falling a much deeper-than-expected 1.6 percent in December, which was the sixth decline of the last seven reports and the third straight below estimates. The year-over-year comparison is seen decreasing 4.9 percent following 3.1 percent contraction in December.
German PPI for January (Fri 0800 CET; Fri 0700 GMT; Fri 0200 EST)
Consensus Forecast, Month over Month: 0.3%
Consensus Forecast, Year over Year: -6.6%
After falling a sharper-than-expected 1.2 percent on the month in December, January’s PPI is seen rising 0.3 percent. Year-over-year, the PPI is expected to contract 6.6 percent versus 8.6 percent contraction in December.
Canadian Labour Force Survey for February (Fri 0830 EST; Fri 1330 GMT)
Consensus Forecast: Employment Change: 20,000
Consensus Forecast: Unemployment Rate: 5.8%
Employment in February is expected to rise 20,000 versus January’s 37,300 climb that was well above Econoday’s 14,500 consensus. February’s unemployment rate is expected to edge higher to 5.8 percent versus January’s 5.7 percent that was 2 tenths tighter than the consensus.
US Employment Situation for February (Fri 0830 EST; Fri 1330 GMT)
Consensus Forecast: Change in Nonfarm Payrolls: 188,000
Consensus Forecast: Unemployment Rate: 3.7%
Consensus Forecast: Average Hourly Earnings M/M: 0.3%
Consensus Forecast: Average Hourly Earnings Y/Y: 4.3%
A 188,000 rise is the call for nonfarm payroll growth in February versus 353,000 in January which was far above expectations and included a sharp upward revision to December of 333,000. Average hourly earnings in February are expected to rise 0.3 percent on the month for a year-over-year rate of 4.3 percent; these would compare with January’s higher-than-expected rates of 0.6 percent on the month and 4.5 percent on the year. February’s unemployment rate is expected to hold unchanged at January’s 3.7 percent which was lower than expected.
Chinese CPI for February (Sat 0930 CST; Sat 0130 GMT; Fri 2030 EST)
Consensus Forecast, Year over Year: 0.3%
After 0.8 percent contraction in January that compared with expectations for 0.5 percent contraction, February’s year-over-year rate is expected to move marginally into the plus column at 0.3 percent. China’s CPI last peaked in January last year at 2.1 percent.
Chinese PPI for February (Sat 0930 CST; Sat 0130 GMT; Fri 2030 EST)
Consensus Forecast, Year over Year: -2.6%
Producer prices have been in long annual contraction. February’s consensus is minus 2.6 percent on the year versus January’s contraction of 2.5 percent.
|
