|
Echoing Jerome Powell’s testimony during the week, the Federal Reserve’s Beige Book assessment suggests that economic conditions are noticeably better, though the improvement won’t be changing the bank’s fundamental approach to monetary policy at the March 19-20 meeting. With the US labor market tight and the outlook for inflation uncertain, policymakers will put caution ahead of stimulus. With inflation still appreciably above 2 percent and the US economy continuing to expand, policymakers have the luxury of time to weigh incoming data. Even in Canada where growth has slowed to a 1.0 percent annualized pace, policymakers are putting patience first.
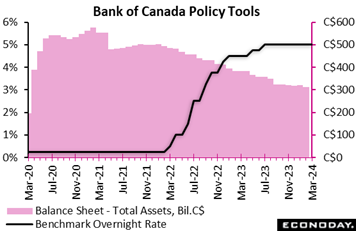 As expected, the Bank of Canada maintained its policy interest rate at 5.0 percent for the fifth straight meeting. Before considering a rate cut, officials want to see clearer signs that inflation is headed down toward the bank's two percent target. The BoC is also continuing its policy of quantitative tightening to trim its balance sheet to a normal level. As expected, the Bank of Canada maintained its policy interest rate at 5.0 percent for the fifth straight meeting. Before considering a rate cut, officials want to see clearer signs that inflation is headed down toward the bank's two percent target. The BoC is also continuing its policy of quantitative tightening to trim its balance sheet to a normal level.
Officials are "still concerned about risks to the outlook for inflation, particularly the persistence in underlying inflation," the statement said, repeating wording in January. "Governing Council wants to see further and sustained easing in core inflation and continues to focus on the balance between demand and supply in the economy, inflation expectations, wage growth, and corporate pricing behaviour."
In an encouraging sign, the bank noted that employment in Canada is growing more slowly than the population, saying "there are now some signs that wage pressures may be easing". Further, it said the pace of economic growth in the fourth quarter "remained weak and below potential."
"Overall, the data point to an economy in modest excess supply," the bank said.
Yet the bank is concerned that underlying inflationary pressures remain. Year-over-year and three-month measures of core inflation are in the 3 percent to 3.5 percent range, and the share of CPI components growing above 3 percent declined but is still above the historical average. "The Bank continues to expect inflation to remain close to 3 percent during the first half of this year before gradually easing."
Speaking to a news conference, Governor Tiff Macklem repeated his warning that the bank's job is not yet done. "Monetary policy is working -- inflation is coming down." he said. "But it's too early to loosen the restrictive policy that has gotten us this far. Low, stable inflation is a cornerstone of shared prosperity, and we remain resolute in our commitment to restore price stability."
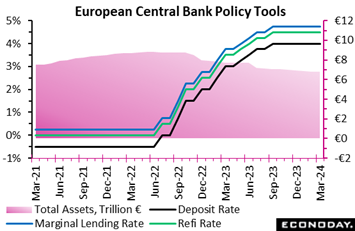 There were no surprises from the European Central Bank in terms of the main policy instruments. The key deposit rate remains at its record high of 4.0 percent while the refi rate stays at 4.50 percent and the rate on the marginal lending facility at 4.75. percent. There were similarly no adjustments made to the QT programme, currently limited to the longstanding asset purchase programme but due to include the pandemic emergency purchase programme from July. Also unchanged was the ‘soft’ forward guidance whereby the "Governing Council considers that the key ECB interest rates are at levels that, maintained for a sufficiently long duration, will make a substantial contribution" to meeting the bank’s inflation goal. There were no surprises from the European Central Bank in terms of the main policy instruments. The key deposit rate remains at its record high of 4.0 percent while the refi rate stays at 4.50 percent and the rate on the marginal lending facility at 4.75. percent. There were similarly no adjustments made to the QT programme, currently limited to the longstanding asset purchase programme but due to include the pandemic emergency purchase programme from July. Also unchanged was the ‘soft’ forward guidance whereby the "Governing Council considers that the key ECB interest rates are at levels that, maintained for a sufficiently long duration, will make a substantial contribution" to meeting the bank’s inflation goal.
However, the bank did make some potentially significant changes to its economic projections, of most importance a generally softer profile for inflation. In December 2023, headline HICP inflation was seen at 1.9 percent in 2026, the end of the forecast horizon, and so just below the two percent medium-term target. However, the core rate that excludes food and energy was seen a couple of ticks higher at 2.1 percent and so justified the decision to leave official interest rates on hold. The revised outlook has left the headline rate at 1.9 percent but trimmed core inflation a tick to 2.0 percent. This will bolster speculation about an interest rate cut in the pipeline.
That said, the bank also pointed out that domestic price pressures remain high, in part due to strong wage growth and a very tight labour market. As such, while opening the door to lower interest rates, the forecast amendments should not be seen as indicating that a cut is just around the corner. It also underlines the importance of the outcome of the current wage round. For the real economy, which is still seen as weak, the bank now sees Eurozone GDP expanding just 0.6 percent this year (down 0.2 percentage points from December) before accelerating to an unrevised 1.5 percent rate in 2025 and a marginally higher revised 1.6 percent in 2026. Risks to growth remain on the downside.
March's discussions will leave financial markets convinced that a cut in key rates is just a matter of time. However, with wages high and core inflation still not officially expected to fall below target until 2026, a move as soon as April remains unlikely. The meeting in June still looks like being the earliest for a full-blown ease.
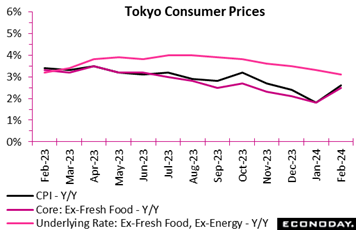 Consumer inflation in Tokyo accelerated at a slightly faster pace than expected in February after easing sharply in January as the base effect of utility subsidies has waned and an influx of Asian visitors during their lunar new year holidays boosted hotel fees, offsetting the impact of a slower gain in processed food prices. Consumer inflation in Tokyo accelerated at a slightly faster pace than expected in February after easing sharply in January as the base effect of utility subsidies has waned and an influx of Asian visitors during their lunar new year holidays boosted hotel fees, offsetting the impact of a slower gain in processed food prices.
The core CPI (excluding fresh food) posted a 2.5 percent gain on year after marking a 22-month low of a 1.8 percent rise in January (revised up from 1.6 percent), coming in just above the consensus call of a 2.4 percent rise and, for a bank fighting deflation not inflation, better in line with the bank's two percent target.
The year-over-year rise in the total CPI picked up to 2.6 percent from a 22-month low of 1.6 percent in January, higher than the median forecast of 2.4 percent. The core-core CPI (excluding fresh food and energy) moderated slightly to a 12-month low of 3.1 percent after easing to 3.3 percent from December's 3.5 percent and a 41-year high of 4.0 percent hit in July 2023.
Prices of services excluding owners' equivalent rent gained 3.1 percent on the year in February, extending a recent uptrend in services costs that reflects moves among many firms to raise wages to secure workers. After a recent slowdown, the annual rate of goods prices excluding fresh food also rose 3.1 percent, accelerating from 1.3 percent the previous month.
BoJ policymakers want to begin unwinding large-scale monetary stimulus after, however, confirming clearer signs of sustained wage hikes in fiscal 2024 that starts in April. Both Governor Kazuo Ueda and Deputy Governor Shinichi Uchida have said financial conditions will remain accommodative even after the bank decides to lift its negative short-term interest rate, an action expected in March or April at the earliest (the bank next meets on Monday, March 18).
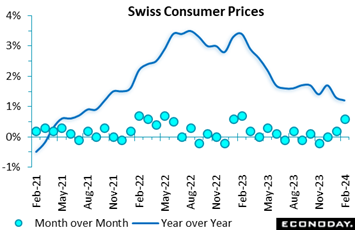 Swiss consumer prices were just slightly firmer than expected in February. A 0.6 percent unadjusted monthly rise was above the consensus but still trimmed the annual inflation rate from 1.3 percent to just 1.2 percent, matching its lowest reading since October 2021. Swiss consumer prices were just slightly firmer than expected in February. A 0.6 percent unadjusted monthly rise was above the consensus but still trimmed the annual inflation rate from 1.3 percent to just 1.2 percent, matching its lowest reading since October 2021.
The dip in headline annual inflation reflected in part a 0.5 percent increase in domestic prices that reduced their yearly rate from 2.0 percent to 1.9 percent. This was compounded by a 1.0 percent rise in import prices that lowered their 12-month rate from minus 0.9 percent to minus 1.0 percent.
Within the CPI basket, petroleum products were up 2.6 percent versus January and clothing and footwear 3.7 percent. Restaurants and hotels (1.3 percent) were also strong. On the downside, there were falls in food and soft drink (0.4 percent), healthcare (0.1 percent) and the other goods and services category (0.2 percent). As a result, core prices (ex-food and energy) climbed 0.7 percent on the month but negative base effects ensured the underlying inflation rate still eased from 1.2 percent to 1.1 percent, the weakest post since January 2022.
Despite being a little firmer than forecast last month, both headline and core inflation have remained below two percent every month since May 2023. The Swiss National Bank will find it increasingly hard to justify keeping its policy rate at 1.75 percent later this month.
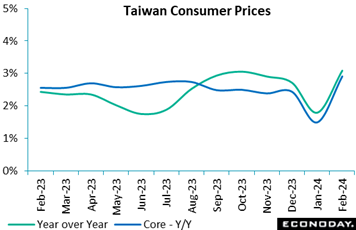 Taiwan's headline consumer price index rose 0.15 percent on the month in February after advancing 0.21 percent in January, with the year-over-year pace accelerating from 1.79 percent to 3.08 percent. The jump largely reflects the timing of lunar new year holidays, which occurred in January last year but in February this year. This means that the price index was somewhat higher this February than it otherwise would have been. Core CPI, which excludes fruits, vegetables, and energy prices, rose 0.79 percent on the month in February after increasing 0.11 percent in January, with this year-over-year increase jumping from 1.49 percent to 2.90 percent. Taiwan's headline consumer price index rose 0.15 percent on the month in February after advancing 0.21 percent in January, with the year-over-year pace accelerating from 1.79 percent to 3.08 percent. The jump largely reflects the timing of lunar new year holidays, which occurred in January last year but in February this year. This means that the price index was somewhat higher this February than it otherwise would have been. Core CPI, which excludes fruits, vegetables, and energy prices, rose 0.79 percent on the month in February after increasing 0.11 percent in January, with this year-over-year increase jumping from 1.49 percent to 2.90 percent.
Taiwan's central bank, the Central Bank of China, left its benchmark discount rate unchanged at 1.875 percent at their quarterly policy meeting in December. Officials expected price pressures to moderate further over the coming year, with annual headline inflation forecast to fall to 1.89 percent in 2024 and annual core inflation forecast to fall to 1.83 percent. The next policy meeting will be held later this month.
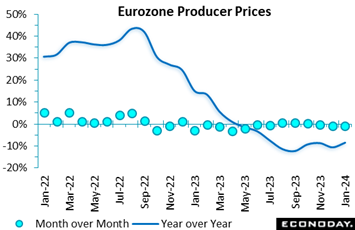 Producer prices continued to slide in the Eurozone at the start of the year and by much more than expected. A 0.9 percent monthly drop was the steepest since May 2023. Yet with base effects strongly positive, annual PPI inflation picked up from minus 10.7 percent to minus 8.6 percent. Producer prices continued to slide in the Eurozone at the start of the year and by much more than expected. A 0.9 percent monthly drop was the steepest since May 2023. Yet with base effects strongly positive, annual PPI inflation picked up from minus 10.7 percent to minus 8.6 percent.
The monthly slide was largely due to energy where prices fell 2.9 percent. Excluding this category, the PPI edged up a couple of ticks for the first increase in the core index since March 2023. Even so, the yearly rate still fell from minus 0.5 percent to a lowly minus 1.5 percent. Elsewhere, intermediates and consumer durables decreased 0.2 percent versus December while consumer non-durables increased 0.3 percent and capital goods 0.6 percent.
January's mixed report still leaves very subdued underlying pipeline inflation pressures in the region as a whole. In terms of meeting its two percent HICP inflation target, manufacturing is not a problem for the ECB.
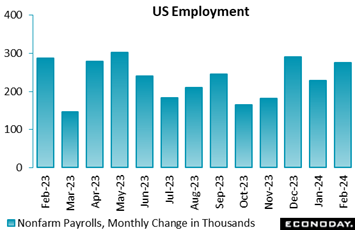 Nonfarm payrolls rose a higher-than-expected 275,000 in February but downward revisions to the two prior months totaled a sharp 167,000. On net, payroll gains in the past three months proved strong even with the lower readings. The monthly average for nonfarm payrolls for the first quarter to-date is 252,000 compared to 212,000 for the fourth quarter 2023. The consensus for February was 190,000 in the Econoday survey of forecasters, though the net revisions suggest that payroll growth was not quite as solid as anticipated. Nonfarm payrolls rose a higher-than-expected 275,000 in February but downward revisions to the two prior months totaled a sharp 167,000. On net, payroll gains in the past three months proved strong even with the lower readings. The monthly average for nonfarm payrolls for the first quarter to-date is 252,000 compared to 212,000 for the fourth quarter 2023. The consensus for February was 190,000 in the Econoday survey of forecasters, though the net revisions suggest that payroll growth was not quite as solid as anticipated.
Private payrolls rose 223,000 in February, reflecting a gain of 19,000 among goods producers and 204,000 among service providers. Strength in goods-producing industries included a 19,000 rise in construction and an 8,000 increase in manufacturing while mining and logging fell 3,000. Among service-providers, payrolls changes were mixed, but generally higher. The largest gain was 90,700 in health care and social assistance, and 58,000 in leisure and hospitality. Government payrolls rose 52,000, with 38,000 in local government.
Average hourly earnings edged up only 0.1 percent on the month; however, year-over-year earnings rose 4.3 percent which is consistent with the trend of the past five months. Gains may have leveled off in recent months but remain solid in a tight labor market.
The unemployment rate rose 2 tenths to 3.9 percent in February, the highest since 4.0 percent in January 2022 and 2 tenths over Econoday’s consensus. The U-6 unemployment rate increased 1 tenth to 7.3 percent in February, the highest since December 2021. The slight rise in the two rates shows some further rebalancing in labor supply and demand as the number of unemployed workers rose 334,000 to 6.458 million in February and the number of employed declined 184,000 to 160.968 million. On net, the labor force increased 150,000. The labor force participation rate held flat for a third month in a row at 62.5 percent. If unemployment is a bit higher in February, it remains low in the historical context and consistent with an economy in tempered expansion.
In separate data for the month of January, job openings in the US continue to come down but only slowly. Openings fell 0.3 percent to 8.863 million which, though down 15.0 percent from 10.425 million in January last year, is still higher than a couple of recent months including October at 8.685 million.
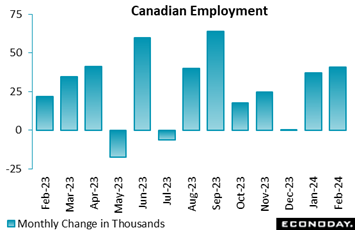 The Canadian economy added 40,700 jobs in February, more than twice as much as expected by forecasters in Econoday’s survey and the largest increase since September 2023. The unemployment rate still edged up to 5.8 percent from 5.7 percent in January, as expected, with a steady participation rate of 65.3 percent. The Canadian economy added 40,700 jobs in February, more than twice as much as expected by forecasters in Econoday’s survey and the largest increase since September 2023. The unemployment rate still edged up to 5.8 percent from 5.7 percent in January, as expected, with a steady participation rate of 65.3 percent.
While the unadjusted average hourly wage growth slowed to 5.0 percent year-over-year from 5.3 percent in January, it is still a pace that might be too uncomfortable for the Bank of Canada to rush into any rate cut.
The economy has been consistently creating jobs since August 2023, for a cumulative seven-month increase of 234,800. Hours worked edged up 0.3 percent on the month, for a 12-month increase of 1.3 percent.
February’s gains were concentrated in full-time positions, up 70,600, the largest increase since June 2023. Part-time employment was down 29,900, the largest decrease since June 2023 and partly erasing January's 48,900 advance.
The number of employees rose just 2,500, as an 18,800 increase in the public sector was mostly offset by a 16,400 decline in the private sector. Self-employment was up 38,300.
Employment increased 46,900 in services but was down 6,300 in goods-producing industries, led by a 13,900 drop in manufacturing, while construction increased 10,500. Agriculture contributed to the weakness with 6,000 jobs lost over the month.
Within services, accommodation and food increased 26,200, professional, scientific and technical services rose 17,900, "other services" were up 10,800 and public administration 8,800. The largest drops were in educational services, wholesale and retail trade, and business, building and other support services, which all recorded double-digit declines totaling 47,000.
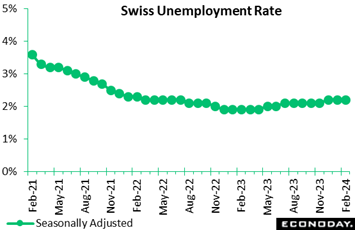 The Swiss labour market weakened slightly further in mid-quarter. Seasonally adjusted joblessness was up 927 or 0.9 percent on the month at 102,328. However, the increase was not steep enough to boost the unemployment rate which again held steady at 2.2 percent, in line with the consensus and so still matching its highest post since April 2022. Unadjusted, the number of people out of work fell 1,296 or 1.1 percent to 111,879, reducing this rate from 2.5 percent to 2.4 percent. However, the rate was still 0.3 percentage points above its level a year ago, matching the gap posted in January. The Swiss labour market weakened slightly further in mid-quarter. Seasonally adjusted joblessness was up 927 or 0.9 percent on the month at 102,328. However, the increase was not steep enough to boost the unemployment rate which again held steady at 2.2 percent, in line with the consensus and so still matching its highest post since April 2022. Unadjusted, the number of people out of work fell 1,296 or 1.1 percent to 111,879, reducing this rate from 2.5 percent to 2.4 percent. However, the rate was still 0.3 percentage points above its level a year ago, matching the gap posted in January.
Vacancies continued to decline, February seeing a hefty 3,213 or 7.2 percent slide on the month to 41,249. This equated to a fall of 21.2 percent versus from January's 18.7 percent.
Overall, February’s update remains consistent with a loosening trend in the Swiss labour market, a development that should go down well at the SNB as it seeks to secure inflation sustainably below 2 percent.
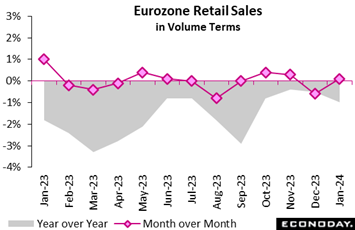 Eurozone retail sales edged firmer at the start of 2023 but failed to reverse December's decline. Volumes rose only 0.1 percent on the month, just beating Econoday’s consensus but after a smaller revised, but still sizeable, 0.6 percent drop at year-end. The minimal increase put annual growth at minus 1.0 percent, down from minus 0.5 percent and a 4-month low. Eurozone retail sales edged firmer at the start of 2023 but failed to reverse December's decline. Volumes rose only 0.1 percent on the month, just beating Econoday’s consensus but after a smaller revised, but still sizeable, 0.6 percent drop at year-end. The minimal increase put annual growth at minus 1.0 percent, down from minus 0.5 percent and a 4-month low.
January's monthly advance came courtesy of a 1.0 percent jump in purchases of food drink and tobacco, their first rise since last September, and a 1.7 percent spurt in auto fuel. Excluding food and auto fuel, sales fell 0.2 percent, compounding a 0.9 percent drop in December.
Regionally, it was the usual mixed performance, reflected in a 1.2 percent bounce in France and a 0.4 percent decrease in Germany.
January's update leaves intact a subdued trend in overall Eurozone sales and a January level 0.2 percent below the fourth-quarter average. Looking ahead, consumer confidence provisionally improved in February but was still historically weak and with ECB interest rates still high, the first quarter seems unlikely to show any significant recovery.
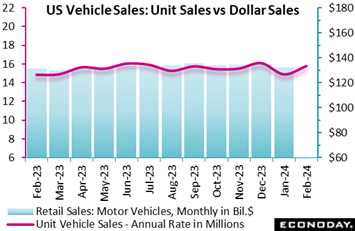 Unit sales of motor vehicles rose to an annualized rate of 15.8 million in February from 14.9 million January and also compared to 14.9 million units in February 2023. Sales were higher than expected and are reflected in forecasts for February retail sales on Friday of the coming week where Econoday’s consensus is a percent headline gain (see Looking Ahead section). Unit sales of motor vehicles rose to an annualized rate of 15.8 million in February from 14.9 million January and also compared to 14.9 million units in February 2023. Sales were higher than expected and are reflected in forecasts for February retail sales on Friday of the coming week where Econoday’s consensus is a percent headline gain (see Looking Ahead section).
The uptick in vehicle sales suggests that the strong 16.1 million units sold in December 2023 was somewhat overstated as was the subsequent decline to 14.9 million units in January. Some of February’s jump may have been helped by tax refunds and dealer incentives.
Sales of domestically produced motor vehicles rose to 12.3 million units in February after 11.7 million in January and above 11.8 million units in February 2023. Motor vehicles produced in North America accounted for 78 percent of all units sold; this is a plus for both US production and US consumer expenditures. Sales of light trucks continued to account for 80 percent of all vehicles sold.
Heavy truck sales rose to a 530,000 rate in February after 506,000 in January and compared to 503,000 in February 2023. This is the highest pace since 565,000 in May 2023. Despite higher financing costs, businesses are buying trucks.
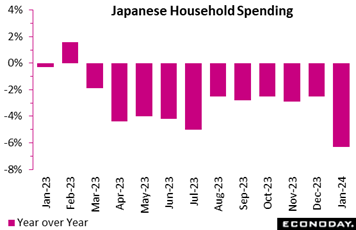 Japan's real household spending posted its 11th straight drop on the year in January, down 6.3 percent (worse than the consensus call of a 4.3 percent drop) after a 2.5 percent dip in December. High costs are generally holding down demand while car purchases slipped in the wake of suspended vehicle output over a safety test scandal. January’s decrease was also led by lower spending on home maintenance and repairs, a volatile factor; lower spending on domestic travel, where subsidies have been lifted, and mild winter weather were also factors. On the month, expenditures fell 2.1 percent for a fourth consecutive decline, which was also weaker than expected. Japan's real household spending posted its 11th straight drop on the year in January, down 6.3 percent (worse than the consensus call of a 4.3 percent drop) after a 2.5 percent dip in December. High costs are generally holding down demand while car purchases slipped in the wake of suspended vehicle output over a safety test scandal. January’s decrease was also led by lower spending on home maintenance and repairs, a volatile factor; lower spending on domestic travel, where subsidies have been lifted, and mild winter weather were also factors. On the month, expenditures fell 2.1 percent for a fourth consecutive decline, which was also weaker than expected.
The core measure of real average household spending (excluding housing, motor vehicles and remittance), a key indicator used in GDP calculation, fell 4.3 percent on the year in January after falling 3.4 percent in December. The average real income of households with salaried workers posted the 16th straight year-over-year drop, down 2.1 percent in January (but up 0.3 in nominal terms), with the pace of decrease easing from a 7.2 percent slump in December (down a nominal 4.4 percent). The main bread-earner's real income in the average household marked the 13th straight year-over-year drop while the average spouse real income posted the ninth straight drop.
Both the government and the Bank of Japan have been providing stimulus to help the economy recover and prevent prices from slipping back into deflation. Real wages have been falling for nearly two years but the year-over-year decline decelerated to 0.6 percent from December's 2.1 percent.
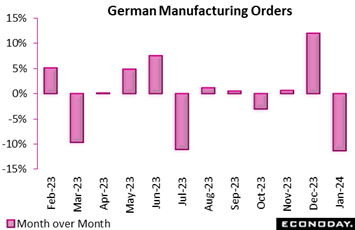 Having surged in December on the back of a jump in major orders, manufacturing orders in Germany slumped at the start of the year as the same category suffered an inevitable reversal. An 11.3 percent drop in total orders was nearly double Econoday’s consensus and more than fully reversed the previous period's even stronger revised 12.0 percent jump. Annual growth dropped from 5.6 percent to 6.2 percent contraction. Having surged in December on the back of a jump in major orders, manufacturing orders in Germany slumped at the start of the year as the same category suffered an inevitable reversal. An 11.3 percent drop in total orders was nearly double Econoday’s consensus and more than fully reversed the previous period's even stronger revised 12.0 percent jump. Annual growth dropped from 5.6 percent to 6.2 percent contraction.
Both domestic and overseas markets posted sizeable monthly declines. The former was down 11.2 percent and the latter 11.4 percent within which orders from the Eurozone fell 25.7 percent. New orders for capital goods decreased 13.1 percent, intermediates 9.3 percent and consumer goods 5.7 percent.
The heightened volatility in the monthly data leaves a still soft picture of demand for manufactured goods. Indeed, January's level was 4.3 percent below the fourth quarter average and the lowest since the middle of 2020. Prospects remain poor for industrial production which, though rising 1.0 percent on the month in separate data for January, remain in deep contraction and still 10.2 percent below its pre-Covid level.
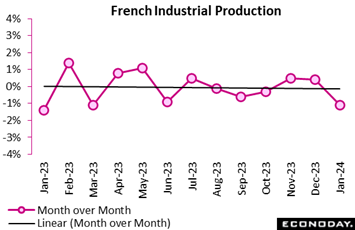 Industrial production in France made a very poor start to the year. A 1.1 percent monthly drop was much steeper than the market consensus and easily more than unwound a 0.4 percent gain in December. Strongly positive base effects still saw annual growth climb from 0.5 percent to 0.8 percent but production hit its lowest level since April 2023. Note that last month INSEE (National Institute for Statistics and Economics Studies) warned that problems with their seasonal adjustment programme due to unusual holiday timings may have artificially boosted the December data. Industrial production in France made a very poor start to the year. A 1.1 percent monthly drop was much steeper than the market consensus and easily more than unwound a 0.4 percent gain in December. Strongly positive base effects still saw annual growth climb from 0.5 percent to 0.8 percent but production hit its lowest level since April 2023. Note that last month INSEE (National Institute for Statistics and Economics Studies) warned that problems with their seasonal adjustment programme due to unusual holiday timings may have artificially boosted the December data.
Manufacturing fared even worse with output falling fully 1.6 percent on the month to touch its worst level since last March. Transport equipment (minus 5.3 percent) and other manufacturing (minus 1.5 percent) did much of the damage while coke and refined petroleum products (minus 10.5 percent) posted a particularly large decrease. Elsewhere, food and drink (1.5 percent) and mining and quarrying, energy, water supply and waste management (1.6 percent) offered partial offsets and construction (0.3 percent) also edged higher.
January's surprisingly poor performance leaves overall goods production 0.7 percent below its average level in the fourth quarter when it dipped 0.1 percent versus the third quarter. Looking ahead, the February manufacturing PMI (47.1) was still below 50 but well up from January (43.1), and INSEE also found a modest improvement in sector sentiment. Even so, goods production looks unlikely to see much of a recovery near-term.
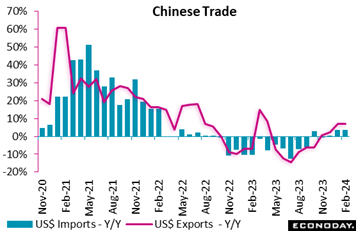 China's trade surplus in US dollar terms widened from US$75.34 billion in December to US$125.16 billion for January and February combined. Officials combine the trade data for the first two months of the year to remove distortions caused by the timing of lunar new year holidays, in line with other major activity data. China's trade surplus in US dollar terms widened from US$75.34 billion in December to US$125.16 billion for January and February combined. Officials combine the trade data for the first two months of the year to remove distortions caused by the timing of lunar new year holidays, in line with other major activity data.
Exports increased 7.1 percent on the year for January and February combined after advancing 2.3 percent in December, while imports rose 3.5 percent after an increase of 0.2 percent previously. In contrast to this improvement in trade flows, PMI survey data have shown weak conditions in the manufacturing sector and only modest growth in the services sector.
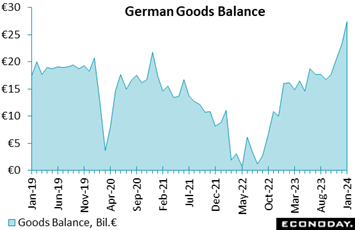 Germany’s merchandise trade surplus widened out significantly in January. A €27.5 billion excess was well above December's upwardly revised €23.3 billion and even further above the consensus. It was also much larger than anything seen in 2023 and indeed, a multi-year high. Unadjusted, the surplus stood at €22.6 billion, similarly a marked increase on the €17.6 billion posted a year ago. Germany’s merchandise trade surplus widened out significantly in January. A €27.5 billion excess was well above December's upwardly revised €23.3 billion and even further above the consensus. It was also much larger than anything seen in 2023 and indeed, a multi-year high. Unadjusted, the surplus stood at €22.6 billion, similarly a marked increase on the €17.6 billion posted a year ago.
Moreover, the monthly headline improvement reflected strong growth in both sides of the balance sheet with exports up a particularly steep 6.3 percent, their best performance since June 2020 and easily outpacing a 3.6 percent gain in imports. The jump in the former was enough to lift unadjusted yearly growth to 1.5 percent, its first positive reading since last June. However, its import counterpart remained sub-zero at minus 7.5 percent. Exports to Russia were down 34.2 percent versus January 2023 while imports were off fully 82.4 percent.
January's surge in the black ink leaves a rising trend in the surplus and puts exports at their highest level since February 2023. Imports stand at just a 2-month peak.
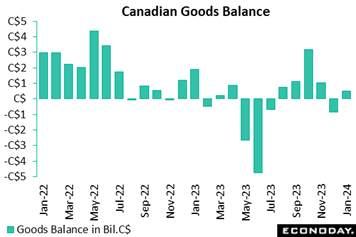 Canada's goods balance returned to a larger-than-expected surplus of C$496 million in January after posting a C$863 million deficit in December despite lower trade activity. Imports contracted 3.8 percent and exports fell 1.7 percent. Lower volumes explained the contraction in international exchanges, as real imports fell 4.1 percent and real exports decreased 1.8 percent. Canada's goods balance returned to a larger-than-expected surplus of C$496 million in January after posting a C$863 million deficit in December despite lower trade activity. Imports contracted 3.8 percent and exports fell 1.7 percent. Lower volumes explained the contraction in international exchanges, as real imports fell 4.1 percent and real exports decreased 1.8 percent.
At C$61.8 billion, imports reached their lowest level since February 2022, with declines in 7 of 11 product categories and across all 10 major countries. Consumer goods imports were down 7.1 percent on the month, reversing most of the 9.8 percent surge in December, led by pharmaceutical products. Motor vehicles and parts decreased 5.2 percent, including a 10.3 percent drop in cars and light trucks amid lower global production as a result of plant retooling, supply issues, strikes and slowing demand.
Export weakness was likewise widespread, across 8 of 11 categories. Metal and non-metallic mineral products dropped 6.2 percent, and aircraft and other transportation equipment fell 13.9 percent. Energy decreased 1.3 percent.
Regionally, trade activity with the US declined in both directions, resulting in the surplus rising to C$8.8 billion from C$8.6 billion. Canada's trade deficit with countries other than the US narrowed to C$8.3 billion from C$9.4 billion.
In services, exports fell 1.6 percent on the month while imports rose 1.5 percent. The combined trade and services deficit with the world narrowed to C$0.8 billion from C$1.6 billion.
 The US trade deficit deepened by $3.2 billion in January to $67.4 billion which gets the contribution of net exports to first-quarter GDP off to a bad start. The US trade deficit deepened by $3.2 billion in January to $67.4 billion which gets the contribution of net exports to first-quarter GDP off to a bad start.
The goods deficit (balance of payments basis) deepened by $3.0 billion to $91.6 billion as imports rose 1.2 percent while exports managed only a 0.1 percent gain. Year-over-year, imports of goods were down 1.7 percent with exports down 3.4 percent.
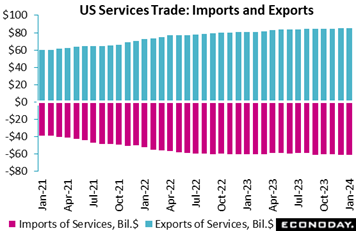
In contrast to goods, the US runs a surplus in services trade, at $24.2 billion in January which, however, was down $0.3 billion from December. Imports of services rose 0.8 percent and outdistanced a 0.2 percent rise in exports of services. Year-over-year, service imports were up 1.2 percent with exports up a very solid 6.2 percent.
Export details included a $1.4 billion rise in vehicles and a $0.6 billion rise in consumer goods, both weak categories for the US. Exports of capital goods, a US strength, also rose $0.6 billion.
Imports of capital goods jumped $3.1 billion which is a good sign for domestic business investment though a negative for the US trade balance. Vehicle imports rose $2.0 billion, consumer goods imports rose $1.1 billion, while imports of crude oil fell $1.9 billion.
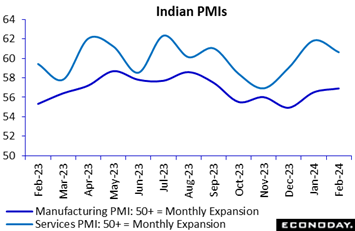 India's services sector PMI shows conditions moderated but remained very strong in February, coming in at 60.6 from a six-month high of 61.8 in January. The manufacturing sector PMI, published in the prior week, showed slightly stronger conditions, advancing from 56.5 to 56.9. Given the strength of these readings, the Reserve Bank of India's will likely remain focused on risks to the inflation outlook. India's services sector PMI shows conditions moderated but remained very strong in February, coming in at 60.6 from a six-month high of 61.8 in January. The manufacturing sector PMI, published in the prior week, showed slightly stronger conditions, advancing from 56.5 to 56.9. Given the strength of these readings, the Reserve Bank of India's will likely remain focused on risks to the inflation outlook.
Respondents to the service sector survey reported output, new orders, and new export orders all grew strongly in February but at a pace down from that recorded in January. The survey also shows slower growth in payrolls while its measure of business confidence eased from a four-month high. Respondents also reported smaller increases in input costs and selling prices in February.
US data improved in the week though the country’s Relative Performance Index is still in the negative column at minus 21 to indicate underperformance relative to Econoday’s consensus forecasts. Inflation isn’t swaying the reading as it stays at minus 21 when excluding prices (RPI-P). When excluding what have been cooler-than-expected prices from Canada’s performance, this country’s RPI rises from minus 6 to plus 10 for the RPI-P to indicate a bias for outperformance in real activity, one that supports the week’s decision by the Bank of Canada not to cut rates.
In the Eurozone, recent upside surprises in the economic data were furthered last week and likewise supported the ECB’s decision to leave rates on hold. In fact, at 26 and 30 respectively, the RPI and RPI-P suggest that the first-quarter economy is running quite well ahead of market expectations.
In the UK, both the RPI (21) and RPI-P (25) remained in positive surprise territory, strengthening the case for no cut in BoE interest rates on March 21st. The country’s labour market on Tuesday of the coming week will have an important say in when forecasters anticipate the first cut in Bank Rate.
In Switzerland, slightly firmer than anticipated consumer prices last month failed to prevent another decline in the annual inflation rate and although the RPI (7) crept back above zero, it was for the first time since early-February. Indeed, even now the RPI-P (0) shows the real economy has only just caught up with expectations. Accordingly, there remains a real possibility of a rate cut from the SNB next week.
In Japan, surprisingly strong Tokyo inflation in February helped to lift the RPI (15) to its first positive reading of any real magnitude since the start of the year. Nonetheless, the real economy continues to disappoint and, at minus 9, the RPI-P shows the majority of non-inflation indicators still slightly undershooting forecasts. The mixed picture will keep investors guessing about when the BoJ will finally tighten.
**Contributing to this article were Jeremy Hawkins, Brian Jackson, Mace News, Max Sato, and Theresa Sheehan
The US CPI on Tuesday is expected to remain overheated, at a 0.4 percent monthly rise overall and a 0.3 percent gain for the ex-food ex-energy core that would leave the latter at an expected 3.7 percent and nearly double the Federal Reserve’s target. Shelter costs will likely still be elevated, while other services like insurance premiums are seeing new hikes.
India’s CPI on Tuesday is expected to edge only 1 tenth lower to 5.0 percent with UK wages, also on Tuesday, likewise not expected to cool very much to 5.7 percent. Yet the UK’s monthly GDP report on Wednesday is expected to offer good news with a 0.2 percent gain.
US retail sales on Thursday are seen rebounding but not US industrial production on Friday where another flat result is the consensus. US consumer sentiment for early March will wind up the week’s calendar with what is expected to be a small gain on top of recent large gains.
UK Labour Market Report (Tue 0700 GMT; Tue 0300 EDT)
Consensus Forecast, ILO Unemployment Rate for three months to February: 3.8%
Consensus Forecast, Average Earnings for three months to February: 5.7%
The ILO unemployment rate for the three months to February is expected to hold at 3.8 percent which in January’s report was 2 tenths tighter than expected. Average earnings growth for the three months to February is seen edging 1 tenth lower to a still overheated 5.7 percent from 5.8 percent and 6.7 percent in the two prior reports.
Indian CPI for February (Tue 1730 IST; Tue 1200 GMT; Tue 0800 EDT)
Consensus Forecast, Year over Year: 5.0%
Consumer prices are expected to ease only marginally to 5.0 percent on the year in February versus January’s as-expected 5.10 percent that followed December’s 5.69 percent.
Indian Industrial Production for January (Tue 1730 IST; Tue 1200 GMT; Tue 0800 EDT)
Consensus Forecast, Year over Year: 4.0%
Year-over-year industrial production growth is expected to rise 4.0 percent in January versus 3.8 percent growth in December that rose from November’s 2.4 percent.
US CPI for February (Tue 1230 GMT; Tue 0830 EDT)
Consensus Forecast, Month over Month: 0.4%
Consensus Forecast, Year over Year: 3.1%
US CPI Core, Less Food & Energy
Consensus Forecast, Month over Month: 0.3%
Consensus Forecast, Year over Year: 3.7%
Consumer prices have come in on the high end of Econoday’s consensus ranges the past two reports with February’s outlook mixed. Core prices in February are expected to slow a notch to a monthly increase of 0.3 percent versus 0.4 percent in January. Overall prices are expected to rise 0.4 percent after increasing 0.3 percent in January. Annual rates, which in January were 3.1 percent overall and 3.9 percent for the core, are expected at 3.1 and 3.7 percent respectively.
UK GDP for January (Wed 0700 GMT; Wed 0300 EDT)
Consensus Forecast, Month over Month: 0.2%
Consensus Forecast, 3-Months over 3-Months: -0.1%
GDP in the month of January is expected to rise 0.2 percent versus 0.1 percent contraction in December.
UK Industrial Production for January (Wed 0700 GMT; Wed 0300 EDT)
Consensus Forecast, Month over Month: -0.1%
Consensus Forecast, Year-over-Year: 0.7%
Manufacturing Output
Consensus Forecast, Month over Month: 0.0%
Consensus Forecast, Year-over-Year: 2.0%
Industrial production is expected to decrease a monthly 0.1 percent in January following December’s 0.6 percent gain. Manufacturing output, which rose 0.8 percent in December, is expected to hold unchanged.
Eurozone Industrial Production for January (Wed 1100 CET; Wed 1000 GMT; Wed 0600 EDT)
Consensus Forecast, Month over Month: -1.1%
Consensus Forecast, Year over Year: -2.7%
Production in January is expected to fall a monthly 1.1 percent after jumping a surprising 2.6 percent in December. Consensus for January’s year-over-year rate is 2.7 percent contraction versus December expansion of 1.2 percent.
Indian Wholesale Price Index for February (Thu 0630 GMT; Thu 1200 IST; Thu 0230 EDT)
Consensus Forecast, Year over Year: 0.2%
Wholesale prices are expected to come in at a year-over-year 0.2 percent in February which would be fractionally changed from 0.27 percent in January.
Canadian Manufacturing Sales for January (Thu 08:30 EDT; Thu 1230 GMT)
Consensus Forecast, Month over Month: 0.4%
After falling 0.7 percent in December that, however, followed a 1.5 percent rise in November, manufacturing sales in January are expected to rise 0.4 percent.
US Retail Sales for February (Thu 0830 EDT; Thu 1230 GMT)
Consensus Forecast, Month over Month: 0.7%
Consensus Forecast, Ex-Vehicles - M/M: 0.4%
Consensus Forecast, Ex-Vehicles, Ex-Gas - M/M: 0.2%
February sales are expected to rise 0.7 percent versus January’s much weaker-than-expected decline of 0.8 percent. January’s ex-auto decline was 0.6 percent with February expected to rebound with a 0.4 percent gain; February’s ex-auto ex-gas is expected at 0.2 percent.
Canadian Housing Starts for February (Fri 0815 EDT; Thu 1215 GMT)
Consensus Forecast, Annual Rate: 225,000
Housing starts are expected to hold steady at 225,000 in February versus January’s lower-than-expected 223,589.
US Industrial Production for February (Fri 1315 GMT; Fri 0915 EDT)
Consensus Forecast, Month over Month: 0.0%
Consensus Forecast, Manufacturing Output - M/M: 0.0%
Consensus Forecast, Capacity Utilization Rate: 78.4%
After a weak 0.1 percent decline in January, industrial production is expected to come in no better than unchanged in February. Manufacturing output is also expected to come in unchanged after falling a steep 0.5 percent. Capacity utilization is expected to fall 1 tenth to 78.4 percent following January’s 2-tenth decline.
US Consumer Sentiment Index, Preliminary March (Fri 1000 EDT; Fri 1400 GMT)
Consensus Forecast: 77.3
Year-Ahead Inflation Expectations
Consensus Forecast: 3.0
After ratcheting to multi-year highs in January and February, consumer sentiment in the first indication for March is expected to rise a further but modest 4 tenths to 77.3. Steady year-ahead inflation expectations are the consensus, no change at 3.0 percent.
|
