|
Strong wage negotiations are setting up what may be a shift away from ultra-loose policy by the Bank of Japan on Tuesday. But for the global markets it may be the Federal Reserve’s quarterly projections for US rates on Wednesday that make the biggest headlines in the coming week. US data still point to tight labor conditions with little sign of any loosening, and underlying inflation pressures are on a dreadfully slow march toward the Fed’s two percent goal. This may mean that the Fed’s prior forecast for 75 basis points in cuts this year could be cut back or even delayed until next year. Shelter costs in the US remain elevated at the same time that energy is re-accelerating.
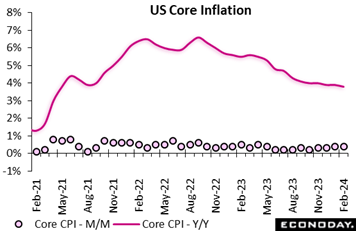 US consumer prices have come in on the high end of Econoday’s consensus ranges the past three reports. February’s headline CPI rose 0.4 percent on the month, as expected, and up from 0.3 percent in January. Prices were up 3.2 percent year-over-year, above Econoday’s 3.1 percent consensus and higher than 3.1 percent the previous month. Core inflation, which excludes food and energy, increased at the steady and overheated pace of 0.4 percent on the month, failing to ease to 0.3 percent expected by forecasters. On a 12-month basis, core inflation slowed to 3.8 percent from 3.9 percent, the lowest rate since May 2021 but above the 3.7 percent consensus expectation and still far above the central bank’s two percent target. US consumer prices have come in on the high end of Econoday’s consensus ranges the past three reports. February’s headline CPI rose 0.4 percent on the month, as expected, and up from 0.3 percent in January. Prices were up 3.2 percent year-over-year, above Econoday’s 3.1 percent consensus and higher than 3.1 percent the previous month. Core inflation, which excludes food and energy, increased at the steady and overheated pace of 0.4 percent on the month, failing to ease to 0.3 percent expected by forecasters. On a 12-month basis, core inflation slowed to 3.8 percent from 3.9 percent, the lowest rate since May 2021 but above the 3.7 percent consensus expectation and still far above the central bank’s two percent target.
Energy rebounded 2.3 percent on the month including a 3.8 percent gain in gasoline prices. Shelter was up 0.4 percent after 0.6 percent in January, and, combined with gasoline, represented 60 percent of the monthly headline CPI increase. Rent was up 0.5 percent, owners' equivalent rent increased 0.4 percent, and lodging edged up 0.1 percent. Airline fares, motor vehicle insurance, apparel, and recreation also pushed core inflation higher on the month; personal care and household furnishings and operations were among categories recording lower prices.
Other US inflation data also failed to cool. Producer prices rose 0.6 percent on the month in February to double Econoday's 0.3 percent consensus estimate and January's result. And imported inflation didn't slow down as much as expected, rising 0.3 percent on the month at the same time that exported inflation rose 0.8 percent on top of January’s 0.9 percent gain.
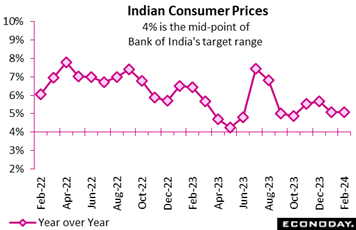 India's consumer price index rose 5.09 percent on the year in February, almost unchanged from an increase of 5.10 percent in January. Inflation in recent months has been well below levels recorded in mid-2023 but remains above the mid-point of the Reserve Bank of India's target range of two percent to six percent. India's consumer price index rose 5.09 percent on the year in February, almost unchanged from an increase of 5.10 percent in January. Inflation in recent months has been well below levels recorded in mid-2023 but remains above the mid-point of the Reserve Bank of India's target range of two percent to six percent.
Steady headline inflation largely reflected a steady increase in food and beverage prices, which account for more than half the weight of the CPI index. These prices rose 7.66 percent on the year after increasing 7.58 percent previously. Fuel and light charges, around 8 percent of the index, fell 0.77 percent on the year after falling 0.60 percent previously. Inflation in urban areas fell from 4.92 percent in January to 4.78 percent in February, while inflation in rural areas was unchanged at 5.34 percent.
At the RBI's most recent policy meeting, held last month, officials left policy rates on hold at 6.50 percent. They advised then that they expected the outlook for headline inflation to remain heavily dependent on food prices but expressed confidence that previous policy tightening would keep core inflation "muted". They stressed that "monetary policy must continue to be actively disinflationary", suggesting that upside risks to the inflation outlook will likely remain their primary focus in upcoming meetings.
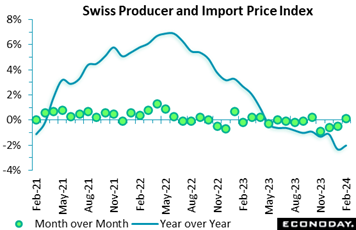 Switzerland’s combined producer and import price index edged up 0.1 percent on the month in February, a tick less than the market consensus but its first increase since last October. The rise was enough to lift the annual inflation rate from minus 2.3 percent to minus 2.0 percent but this was still its second-weakest reading over the last three years. Switzerland’s combined producer and import price index edged up 0.1 percent on the month in February, a tick less than the market consensus but its first increase since last October. The rise was enough to lift the annual inflation rate from minus 2.3 percent to minus 2.0 percent but this was still its second-weakest reading over the last three years.
Domestic prices also rose a monthly 0.1 percent, trimming their yearly rate from minus 0.1 percent to minus 0.3 percent. Import prices were marginally stronger, advancing 0.2 percent to lift their annual rate from minus 6.5 percent to minus 5.4 percent.
Within the PPI, petroleum products (1.7 percent) saw the steepest monthly gain while rubber and plastics (minus 1.5 percent) recorded the sharpest decline. Most other categories were broadly flat. Import prices were similarly boosted by higher petroleum costs (6.0 percent). Consequently, overall core prices dipped 0.1 percent versus January.
The February update reduces the underlying annual inflation rate from minus 1.1 percent to minus 1.4 percent, equaling its weakest print since October 2020. Pipeline price pressures in Swiss manufacturing remain very soft which can only add to speculation about a possible policy rate cut from the Swiss National Bank in the coming week.
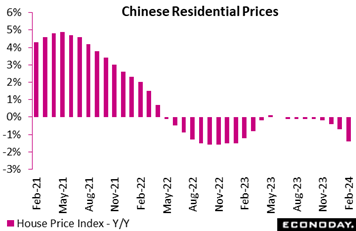 China's residential property prices fell 1.4 percent on the year in February after dropping 0.7 percent in January. This is the biggest year-over-year decline since January 2023, with the size of the decline likely impacted to some extent by the timing of lunar new year holidays. China's residential property prices fell 1.4 percent on the year in February after dropping 0.7 percent in January. This is the biggest year-over-year decline since January 2023, with the size of the decline likely impacted to some extent by the timing of lunar new year holidays.
China's property market has been very weak for nearly two years, representing a major drag on investment and consumer spending. Officials have taken steps in recent months to support the market, including a cut in the five-year loan prime rate last month which should reduce mortgage rates for new borrowers, but February's data again indicate that sentiment and conditions remain very weak for now.
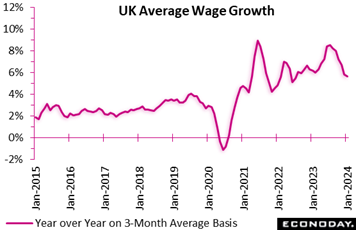 UK wage growth remains overheated but continues to slow. At a 5.6 percent rate, the annual change in the three months to January was down from the fourth quarter's 5.8 percent and a tick below Econoday’s consensus. It was also the lowest rate since mid-2022. Likewise when excluding bonuses, the rate dipped from 6.2 percent to 6.1 percent. UK wage growth remains overheated but continues to slow. At a 5.6 percent rate, the annual change in the three months to January was down from the fourth quarter's 5.8 percent and a tick below Econoday’s consensus. It was also the lowest rate since mid-2022. Likewise when excluding bonuses, the rate dipped from 6.2 percent to 6.1 percent.
Claimant count unemployment rose 16,800 on the month in February following a much smaller revised 3,100 increase at the start of the year. The mid-quarter advance was less than the market consensus and, while leaving intact a solid uptrend in joblessness, kept the unemployment rate unchanged at 4.0 percent.
Meantime, the new ILO data showed the number of people out of work dipping 8,000 to 1.359 million in the three months to January. This extended the unbroken sequence of declines that began back in the third quarter of last year. The fall was accompanied by an uptick in the jobless rate but, at 3.9 percent, it remains only just above its all-time low. Employment dropped 21,00 over the same period, its first decrease since July-September 2023 but only denting the solid gains seen in recent months. Indeed, the employment rate was unchanged at 75.0 percent, well above its long-run average. More up to date, the payroll data showed a 20,000 gain on the month in February but vacancies fell again and a 42,000 slide in the three months to February put their level at the lowest since the second quarter of 2021.
In sum, the new report shows some loosening in overall labour market conditions and a further easing in wage pressures. Even so, the labour market remains very tight and earnings are far too high to accommodate the two percent inflation target without a marked improvement in productivity. For most Bank of England members it is probably a case of so far so good, but there is still some way to go yet before interest rates can be cut.
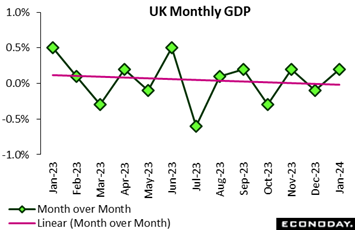 The UK economy performed as expected in January. A 0.2 percent monthly rise in real GDP was in line with Econoday’s consensus and more than reversed December’s 0.1 percent dip. The increase put the 3-monthly change at minus 0.1 percent, up from minus 0.3 percent, but annual growth at minus 0.3 percent, down from 0.0 percent. The UK economy performed as expected in January. A 0.2 percent monthly rise in real GDP was in line with Econoday’s consensus and more than reversed December’s 0.1 percent dip. The increase put the 3-monthly change at minus 0.1 percent, up from minus 0.3 percent, but annual growth at minus 0.3 percent, down from 0.0 percent.
The monthly headline advance was largely attributable to services where output expanded 0.2 percent after a 0.1 percent fall in December. Within this, wholesale and retail (1.9 percent) had a particularly good period as did administrative and support services (0.6 percent) and education (0.7 percent). By contrast, industrial production fell 0.2 percent despite a flat month for manufacturing output but construction advanced fully 1.1 percent, its strongest rise since last June.
Total output now stands at its highest mark since last September and 0.2 percent above its average level last quarter. With business surveys modestly optimistic about February, the economy would seem to be on course to move out of recession by March. Growth is not strong but the apparent pick up in momentum should leave the Bank of England all the more cautious about cutting Bank Rate.
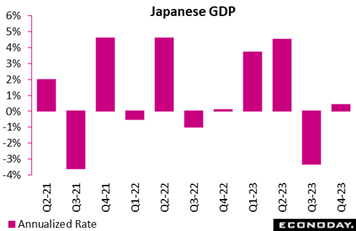 Japan's economy narrowly averted a second straight quarterly drop in the fourth quarter, and thus recession last year, as revised data for gross domestic product showed slight growth, backed by a decent but slightly smaller-than-expected upward revision to business investment and an unrevised rebound in net exports, offsetting the drag from declines in consumption and public works. Japan's economy narrowly averted a second straight quarterly drop in the fourth quarter, and thus recession last year, as revised data for gross domestic product showed slight growth, backed by a decent but slightly smaller-than-expected upward revision to business investment and an unrevised rebound in net exports, offsetting the drag from declines in consumption and public works.
Real GDP expanded 0.1 percent on quarter in the fourth quarter, or an annualized 0.4 percent, revised up from the initial estimate of a 0.1 percent slip (0.4 percent contraction annualized). It was weaker than the median forecast of 0.3 percent growth on quarter, or an annualized 1.3 percent rise.
From a year earlier, the economy grew 1.2 percent in the fourth quarter, revised up from a preliminary 1.0 percent rise, for an 11th consecutive rise following a 1.6 percent (revised down from 1.7 percent) increase in third quarter. The consensus forecast was a 1.5 percent rise.
Looking ahead, the economy in the first quarter of 2024 is expected to post only a slight increase close to zero as consumers remain frugal to cope with elevated living costs and some industries including hotels, restaurants and transport firms are losing business opportunities amid widespread labor shortages.
There are heightened expectations that the Bank of Japan may well act sooner on March 18-19, instead of April 25-26, to lift the negative 0.1 percent short-term interest rate target to zero as part of its gradual process of unwinding large-scale monetary stimulus. Recent official comments point to a higher possibility of achieving stable 2 percent inflation and a reduced risk of falling back into deflation. Some major firms have already accepted demands for higher wages and better working conditions.
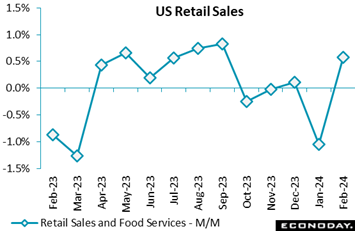 The dollar value of US retail and food services sales rose a slightly lower-than-expected 0.6 percent on the month in February, making little dent in January’s downward revised 1.1 percent decline (initial decline 0.8 percent). The dollar value of US retail and food services sales rose a slightly lower-than-expected 0.6 percent on the month in February, making little dent in January’s downward revised 1.1 percent decline (initial decline 0.8 percent).
Sales excluding motor vehicles rose 0.3 percent in February with January revised lower to a decline of 0.8 percent. February sales got a boost from a 1.6 percent increase for motor vehicles and parts.
Excluding both vehicles and gasoline, sales also rose 0.3 percent following January’s downward revised 0.8 percent decline. Sales of gasoline rose 0.9 percent in February, mainly reflecting higher prices at the pump.
Retail spending outside of motor vehicles and gasoline presents a mixed picture. There seems to be some appetite for spring merchandise and for the sorts of more costly items that a tax refund can help buy. Sales rose a solid 2.2 percent for building materials as some consumers got a head start on spring outdoor projects. Spending on electronics and appliances rose 1.5 percent.
But overall activity is on the soft side. Furniture store spending fell 1.1 percent, while spending at nonstore retailers – which include online retailers – edged 0.1 percent lower in February, and clothing store spending fell 0.5 percent. Spending on food and beverage stores rose only 0.1 percent.
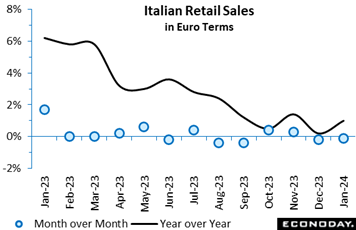 Retail sales in Italy dipped 0.1 percent on the month in January following a 0.2 percent fall in December. This made for the first back-to-back drop since August/September last year and left purchases matching a 4-month low. However, positive base effects lifted annual growth from 0.2 percent to 1.0 percent. Volumes were rather softer, declining 0.3 percent versus December to hit a multi-year low. Both sales of food (minus 0.4 percent) and non-food (minus 0.2 percent) posted fresh losses. February’s update leaves overall volume sales in January 0.6 percent below their average level in the fourth quarter, warning that the retail sector could provide a seventh consecutive hit to GDP growth this quarter. Retail sales in Italy dipped 0.1 percent on the month in January following a 0.2 percent fall in December. This made for the first back-to-back drop since August/September last year and left purchases matching a 4-month low. However, positive base effects lifted annual growth from 0.2 percent to 1.0 percent. Volumes were rather softer, declining 0.3 percent versus December to hit a multi-year low. Both sales of food (minus 0.4 percent) and non-food (minus 0.2 percent) posted fresh losses. February’s update leaves overall volume sales in January 0.6 percent below their average level in the fourth quarter, warning that the retail sector could provide a seventh consecutive hit to GDP growth this quarter.
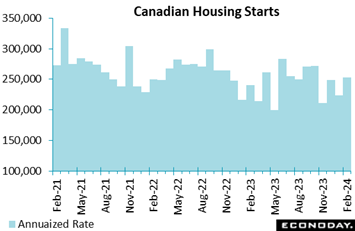 Canadian housing starts rebounded nearly 14 percent in February to an annual rate of 253,468, beating the consensus forecast of 225,000 in an Econoday survey. The rebound erased a 10.2 percent drop recorded the month before. The six-month trend was up 0.4 percent to 245,665 after declining 2.0 percent in January. Canadian housing starts rebounded nearly 14 percent in February to an annual rate of 253,468, beating the consensus forecast of 225,000 in an Econoday survey. The rebound erased a 10.2 percent drop recorded the month before. The six-month trend was up 0.4 percent to 245,665 after declining 2.0 percent in January.
The February advance was due to a growth in actual starts from a year earlier. Housing starts in urban areas rose 11 percent year-over-year, led by a 16 percent increase in multi-unit starts, while single-detached starts fell 14 percent.
The report noted that as the housing shortage continues, “the focus for developers continues to shift towards multi-unit construction in Canada's major centres.”
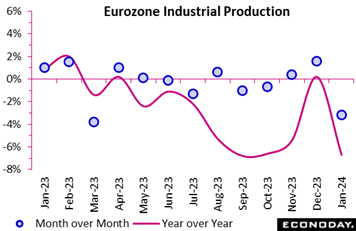 Industrial production in the Eurozone was much weaker than expected at the start of the year. Following a notably smaller revised 1.6 percent monthly rise in December, output fell fully 3.2 percent, its worst performance since March 2023. Annual growth slumped from 0.2 percent to minus 6.7 percent and production now stands at its weakest level since September 2020. Industrial production in the Eurozone was much weaker than expected at the start of the year. Following a notably smaller revised 1.6 percent monthly rise in December, output fell fully 3.2 percent, its worst performance since March 2023. Annual growth slumped from 0.2 percent to minus 6.7 percent and production now stands at its weakest level since September 2020.
January's monthly drop was largely due to capital goods which more than reversed December's 11.3 percent surge with a drop of some 14.5 percent. Consumer durables (minus 1.2 percent) and non-durables (minus 0.3 percent) also lost ground but intermediates (2.6 percent) increased for the first time since last May and energy (0.5 percent) was also stronger.
Regionally, Ireland (minus 29.0 percent after 19.0 percent) again added significantly to overall monthly volatility. However, with the notable exception of Germany (up 0.6 percent), around half of the member states posted fresh declines.
In line with the December report, sharp swings in Ireland mean that January's update provides a distorted impression of Eurozone manufacturing at the start of 2024. Nonetheless, the region's goods producing sector is clearly still struggling and will almost certainly subtract from first quarter GDP.
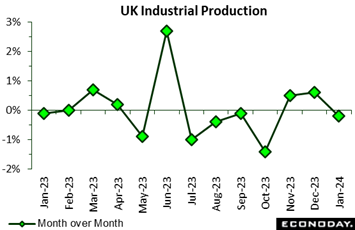 Industrial production in the UK fell 0.2 percent on the month in January. The drop, which was only marginally larger than expected, was the first since last October and followed an unrevised 0.6 percent increase in December. Yearly growth was 0.5 percent, down from 0.6 percent. Industrial production in the UK fell 0.2 percent on the month in January. The drop, which was only marginally larger than expected, was the first since last October and followed an unrevised 0.6 percent increase in December. Yearly growth was 0.5 percent, down from 0.6 percent.
Manufacturing fared a little better, posting no change versus December although this still reduced annual growth from 2.3 percent to 2.0 percent. Seven of the 13 subsectors posted monthly gains with transport equipment (2.3 percent) and other manufacturing and repair (1.8 percent) seeing particularly healthy advances. However, basic pharmaceutical products and pharmaceutical preparations (minus 5.1 percent) recorded a hefty decline.
Elsewhere, overall production was boosted by a 0.5 percent increase in electricity and gas but undermined by weaker total water supply (minus 2.2 percent). Oil and gas extraction (0.1 percent) was essentially flat.
January's setback leaves the 3-monthly change in overall goods production at minus 0.2 percent. However, this is its strongest reading since September 2023 and manufacturing (0.3 percent) is now expanding.
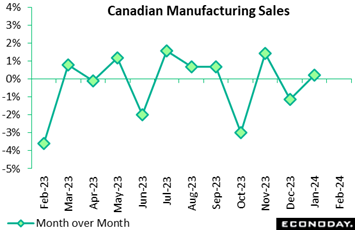 Manufacturing sales in Canada started the year with only a 0.2 percent rebound, half as much as expected by forecasters. Excluding motor vehicles and parts, sales even fell 1.2 percent. However total sales in volume terms rose 1.1 percent, showing that much of the weakness was price related in January. Manufacturing sales in Canada started the year with only a 0.2 percent rebound, half as much as expected by forecasters. Excluding motor vehicles and parts, sales even fell 1.2 percent. However total sales in volume terms rose 1.1 percent, showing that much of the weakness was price related in January.
Inventories contracted 0.2 percent on the month, with the inventory-to-sales ratio unchanged at 1.72. Looking ahead, new orders fell 3.1 percent and unfilled orders were down 1.3 percent on the month, not promising for manufacturing activity ahead.
The unadjusted capacity utilization rate rose to 77.1 percent in January from 75.1 percent in December, but was down from 78.5 percent a year earlier.
Looking at the sales breakdown, the picture was mixed. Gains were led by a 0.8 percent advance in non-durable goods industries, while durable goods decreased 0.3 percent.
Overall, 11 of 21 subsectors posted gains led by a 4.3 percent advance in transportation equipment, including a 19.6 percent surge in motor vehicles as production resumed following a slowdown related to retooling. Also leading sales higher on the month was a 3.5 percent increase in chemicals. Machinery was up 0.4 percent, an indication of slow investment activity. Petroleum and coal products fall 1.3 percent.
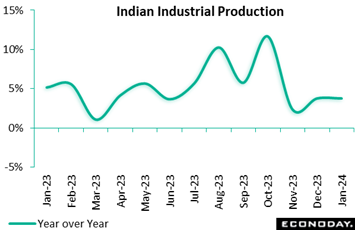 India's index of industrial production rose 3.8 percent on the year in January, as it did in December. Within the industrial sector, manufacturing output advanced 3.2 percent on the year after an increase of 3.9 percent previously. More timely PMI survey data indicate that growth in the manufacturing sector strengthened sharply in January and gained further momentum in February. India's index of industrial production rose 3.8 percent on the year in January, as it did in December. Within the industrial sector, manufacturing output advanced 3.2 percent on the year after an increase of 3.9 percent previously. More timely PMI survey data indicate that growth in the manufacturing sector strengthened sharply in January and gained further momentum in February.
The Reserve Bank of India again left policy rates on hold at 6.50 percent at their most recent meeting held last month. Officials advised then that they expect growth to remain supported by investment demand and strong business and consumer sentiment. January's data showing stronger growth in industrial production suggests upside risks to the inflation outlook will remain the RBI's primary concern in upcoming policy meetings.
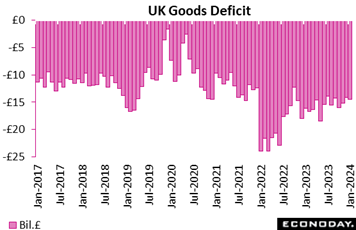 The UK’s trade deficit widened by slightly more than expected in January. At £14.52 billion, the shortfall was £0.42 billion larger than the market consensus and up from December's £13.99 billion but only a 2-month high. The deterioration reflected a 2.0 percent monthly increase in imports which more than offset a 1.3 percent rise in exports. The UK’s trade deficit widened by slightly more than expected in January. At £14.52 billion, the shortfall was £0.42 billion larger than the market consensus and up from December's £13.99 billion but only a 2-month high. The deterioration reflected a 2.0 percent monthly increase in imports which more than offset a 1.3 percent rise in exports.
The red ink with the EU increased from £10.67 billion to £11.09 billion as exports dropped 1.6 percent and imports climbed 0.7 percent. With the rest of the world, the deficit was £3.42 billion, little changed from December's £3.32 billion with exports up fully 4.0 percent and imports 3.8 percent.
The January report leaves the overall goods balance on a modestly improving trend. Even so, it remains sizeable and reflects more the weakness of imports than any real strength in exports.
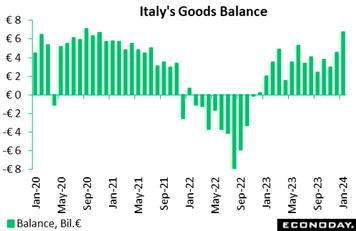 Italy’s merchandise trade balance was in a sizeable €6.77 billion surplus in January, up from a larger revised €4.99 billion in December and a multi-year high. However, the monthly widening masked a 3.2 percent drop in exports and reflected instead a hefty 7.3 percent slump in imports, the latter's third straight decline. The decrease in exports, which hit their weakest level since March 2022, was broad-based with consumer goods sliding 0.3 percent and capital goods and intermediates a hefty 5.7 percent and 5.5 percent respectively. Indeed, without a 12.5 percent bounce in energy, the overall fall would have been 3.7 percent. All the main import categories also lost ground, notably energy (minus 9.8 percent). Italy’s merchandise trade balance was in a sizeable €6.77 billion surplus in January, up from a larger revised €4.99 billion in December and a multi-year high. However, the monthly widening masked a 3.2 percent drop in exports and reflected instead a hefty 7.3 percent slump in imports, the latter's third straight decline. The decrease in exports, which hit their weakest level since March 2022, was broad-based with consumer goods sliding 0.3 percent and capital goods and intermediates a hefty 5.7 percent and 5.5 percent respectively. Indeed, without a 12.5 percent bounce in energy, the overall fall would have been 3.7 percent. All the main import categories also lost ground, notably energy (minus 9.8 percent).
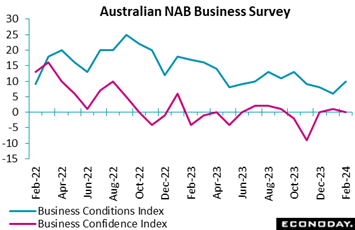 The NAB business survey for Australia showed steady and subdued business confidence in February but improvement in the assessment of conditions. The survey's business conditions index rose from 7 in January to 10 in February, with respondents reporting stronger trading conditions, profitability, and employment, but more pronounced weakness in forward orders. The survey showed steady increases in labour costs, purchase costs but a bigger increase in retail prices. The survey's business confidence index fell from plus 1 in January to zero in February. Sentiment remains weak across most sectors and most parts of the country, with the index still well below its long-run average. The NAB business survey for Australia showed steady and subdued business confidence in February but improvement in the assessment of conditions. The survey's business conditions index rose from 7 in January to 10 in February, with respondents reporting stronger trading conditions, profitability, and employment, but more pronounced weakness in forward orders. The survey showed steady increases in labour costs, purchase costs but a bigger increase in retail prices. The survey's business confidence index fell from plus 1 in January to zero in February. Sentiment remains weak across most sectors and most parts of the country, with the index still well below its long-run average.
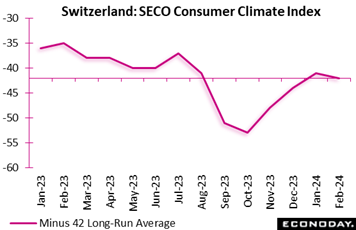 Switzerland’s SECO consumer climate index was little changed in February. At minus 42, the headline index was down just a point versus January but 7 points short of its level a year ago and below the market consensus. However, the latest reading was in line with its long-run average and leaves intact a gently rising trend since last October. Switzerland’s SECO consumer climate index was little changed in February. At minus 42, the headline index was down just a point versus January but 7 points short of its level a year ago and below the market consensus. However, the latest reading was in line with its long-run average and leaves intact a gently rising trend since last October.
Component changes were similarly very limited. However, the economic outlook deteriorated (minus 53 after minus 50) as did job security (minus 26 after minus 14). Planned purchases were essentially flat.
Overall, the results suggest no meaningful shift in consumer confidence which should equate with a modest increase in household spending over coming months.
Econoday’s global Relative Performance Index (RPI) held unchanged in the week at a perfect zero score, perfect that is for Econoday’s consensus forecasts that on net are exactly matching actual outcomes. But there’s a separation at play between real economic activity which is missing forecasts and inflation which is exceeding forecasts. When excluding the latter, the Relative Performance Index less prices (RPI-P) is lagging at minus 8. It’s this bias toward inflation that’s pushing back market expectations for global rate cuts.
US data on net continued to improve in the week, lifting this country’s RPI to plus 10 to indicate general outperformance. Less prices, however, the index eases only slightly to plus 7. With data beating estimates and inflation not cooling much, the Federal Reserve on Wednesday may not feel compelled to stress the need for rate cuts.
Canada, getting a boost from the week’s strong manufacturing sales as well as housing starts, extended the prior week’s gain to stand at 12 both overall and when excluding inflation. The results confirm the wisdom of the Bank of Canada’s decision in the prior week not to cut rates.
An unexpected nosedive in January industrial production trimmed the Eurozone RPI to 5 and the RPI-P to exactly zero to indicate that economic activity is essentially matching expectations. Focus now shifts to the services sector and whether stronger output here can keep first-quarter GDP out of the negative column.
In Switzerland, the RPI (7) and RPI-P (5) held above zero for a second week but still indicated just marginal outperformance versus forecasts. The SNB meeting in the coming week will be focused mainly on inflation and, given prior downside surprises, the door to a rate cut is certainly open.
A mixed week for the UK saw the RPI slip to minus 13 and the RPI-P to minus 10. However, with both measures above zero for much of the first quarter, the latest readings will not be weak enough for the Bank of England to announce a rate cut on Thursday.
Forecasters expect the Bank of Japan to finally abandon its ultra-loose monetary policy on Tuesday. At minus 32, the RPI-P shows the real economy falling well short of expectations in contrast, however, to upside surprises in key inflation updates which, when included in the calculation, lift the RPI to minus 9. Should policy be left on hold this month, interest rates are very likely to be hiked in April.
**Contributing to this article were Jeremy Hawkins, Brian Jackson, Mace News, Max Sato, and Theresa Sheehan
The Bank of Japan, given an uplift in inflation and strong gains in wage negotiations, is expected to tighten policy, a move that would dominate Tuesday’s session and upstage what is expected to be steady policy from the Reserve Bank of Australia.
There are no expectations for looser policy from the US Federal Reserve on Wednesday nor the Bank of England on Thursday, though there is some talk that the Swiss National Bank, given noticeable weakness in Swiss inflation, could cut rates at its meeting on Thursday.
Slowing for industrial production and retail sales are the consensus calls for Chinese data on Monday that will cover the combined months of January and February. Yet such results would not be expected to trigger a further rate cut in the country’s loan prime rates on Wednesday.
Canadian CPI on Tuesday is expected to re-accelerate slightly in contrast to expected slowing for UK consumer prices on Wednesday. Japanese CPI data are expected to be mixed but rise sharply at the headline level on Friday.
New Zealand GDP on Thursday is expected to be marginally positive while Australia’s labour force survey, also on Thursday, is expected to rebound. Both UK and Canadian retail sales on Friday are expected to be weak. PMI flashes on Thursday are expected to show marginal improvement for Germany and for the Eurozone as a whole.
Japanese Machinery Orders for January (Sun 2350 GMT; Mon 0850 JST; Sun 1950 EDT)
Consensus Forecast, Month over Month: -0.7%
Consensus Forecast, Year over Year: -9.8%
Machinery orders are forecast to fall 0.7 percent on the month in January after rising 2.7 percent in December and slumping 4.7 percent in November. Firms are cautiously implementing their capital investment plans amid otherwise solid demand for digitization and automation. Last month, the Cabinet Office maintained its long-held view saying "orders are pausing." Recent figures will be updated in an annual revision to the data series.
Chinese Fixed Asset Investment for January/February (Mon 1000 CST; Mon 0300 GMT; Sun 2200 EDT)
Consensus Forecast, Year-to-Date on Y/Y Basis: 3.2%
Fixed asset investment for the combined months of January and February is expected to rise 3.2l percent. This would compare with 3.0 percent growth in December and 2.9 percent growth in November.
Chinese Industrial Production for January/February (Mon 1000 CST; Mon 0200 GMT; Sun 2200 EDT)
Consensus Forecast, Year over Year: 5.0%
Year-over-year growth in industrial production is expected to slow to 5.0 percent in the combined months of January and February versus growth of 6.8 percent in December.
Chinese Retail Sales for January/February (Mon 1000 CST; Mon 0200 GMT; Sun 2200 EDTT)
Consensus Forecast, Year over Year: 5.0%
After rising 7.4 percent in December versus expectations for stronger growth of 8.0 percent, year-over-year sales in the combined months of January and February are expected to slow to 5.0 percent growth.
Bank of Japan Announcement (Expected sometime between 11:30 and 12:00 JST on Tuesday, March 19)
Consensus Forecast, Change: 0.1 basis point
Consensus Forecast, Level: 0.0%
The Bank of Japan’s nine-member board is expected to decide in a majority vote this week to end its seven-year-old yield curve control framework and lift the minus 0.1 percent short-term rate target to a range of zero to 0.1 percent on news that wage hikes for fiscal 2024 that begins next month are set to well surpass the pace of increase seen in the previous year. A hike would be the bank's first since 2007.
Reserve Bank of Australia Announcement (Tue 1430 AEDT; Tue 0330 GMT; Mon 2330 EDT)
Consensus Forecast, Change: 0 basis points
Consensus Forecast, Level: 4.35%
Saying “inflation continues to moderate but remains high”, the Reserve Bank of Australia kept its policy rate steady at 4.35 percent in February. The RBA is once again expected to keep policy unchanged at its March meeting.
Germany: ZEW Survey for March (Tue 1100 CET; Tue 1000 GMT; Tue 0600 EDT)
Consensus Forecast, Economic Sentiment: 21.0
Expectations (economic sentiment) are expected to rise to 21.0 in March versus February’s 19.9 which, for the seventh month in a row, was higher than expected.
Canadian CPI for February (Tue 0830 EDT; Tue 1230 GMT)
Consensus Forecast, Month over Month: 0.6%
Consensus Forecast, Year over Year: 3.0%
Canadian CPI Core, Less Food & Energy
Consensus Forecast, Month over Month: 0.3%
Consensus Forecast, Year over Year: 3.3%
After January’s better-than-expected cooling to 2.9 percent from December’s 3.4 percent, consumer prices in February are expected to edge higher to 3.0 percent. The core rate is also expected to rise, to 3.3 percent from 3.1 percent.
China Loan Prime Rates (Wed 0915 CST; Wed 0115 GMT; Tue 2115 EDT)
Consensus Change: 1-Year Rate: 0 basis points
Consensus Level: 3.45%
Consensus Change: 5-Year Rate: 0 basis points
Consensus Level: 3.95%
After cutting the 5-year loan prime rate by a deeper-than-expected 25 basis points in February, the People's Bank of China is expected to hold the rate unchanged at 3.95 percent at its March meeting. The 1-year rate, which was left unchanged in February, is also expected to remain unchanged at 3.45 percent.
German PPI for February (Wed 0800 CET; Wed 0700 GMT; Wed 0300 EDT)
Consensus Forecast, Month over Month: -0.1%
After firming 0.2 percent on the month in January, February’s PPI is seen edging 0.1 percent lower.
UK CPI for February (Wed 0700 GMT; Wed 0300 EDT)
Consensus Forecast, Month over Month: 0.7%
Consensus Forecast, Year over Year: 3.6%
At 4.0 percent versus expectations for 4.2 percent, consumer prices in January, due to moderation in goods prices, were softer than expected though services prices climbed again. February’s expectations are cooling to 3.6 percent.
Italian Industrial Production for January (Wed 1000 CET; Wed 0900 GMT; Wed 0500 EDT)
Consensus Forecast, Month over Month: -0.6%
Production in January is expected to fall 0.6 percent on the month following a better-than-expected 1.1 percent rise in December.
Eurozone: EC Consumer Confidence Flash for March (Wed 1600 CET; Wed 1500 GMT; Wed 1100 EDT)
Consensus Forecast: -14.5
Consumer confidence in March is expected to rise to minus 14.5 versus February’s minus 15.5 which was 6 tenths better than January but once again was well short of the minus 11.3 long-run average.
US Federal Reserve Announcement (Wed 1800 GMT; Wed 1400 EDT)
Consensus Forecast, Policy Rate Change: 0 basis points
Consensus Forecast, Target Range: 5.25% to 5.50%
The Fed is once again expected to keep policy unchanged at its March meeting. The jobs market remains tight and strong while inflation remains too high.
New Zealand Fourth-Quarter GDP (; Thu 1045 NZDT; Wed 2145 GMT; Wed 1745 EDT)
Consensus Forecast, Quarter over Quarter: 0.1%
Consensus Forecast, Year over Year: 0.1%
Consensus for fourth-quarter GDP is quarter-to-quarter expansion of 0.1 percent versus 0.3 percent contraction in the third quarter. The year-over-year rate is also seen at plus 0.1 percent versus 0.6 percent contraction previously.
Japanese Merchandise Trade for February (Thu 0850 JST; Wed 2350 GMT; Wed 1950 EDT)
Consensus Forecast: -Y862 billion
Consensus Forecast, Imports Y/Y: 4.0%
Consensus Forecast, Exports Y/Y: 5.7%
A deficit of ¥862 billion is the consensus for February’s trade balance versus a deficit of ¥1,760 billion in January that nevertheless saw an 11.9 percent year-over-year rise in exports. Exports in February are expected to rise 5.7 percent with imports seen 4.0 percent higher. Cargo flows in Asia slowed in early February due to the lunar new year holidays after rush pre-holiday shipments in January.
Australian Labour Force Survey for February (Thu 1130 AEDT; Thu 0030 GMT; Wed 2030 EDT)
Consensus Forecast, Employment: 32,000
Consensus Forecast, Unemployment Rate:4.0%
Consensus Forecast, Participation Rate:66.8%
At a consensus rise of 32,000, employment in February is expected to climb versus January’s virtually flat increase of 500. Unemployment is expected to edge lower to 4.0 percent from 4.1 percent with the participation rate expected to hold steady at 66.8 percent.
Swiss National Bank Monetary Policy Assessment (Thu 0930 CET; Thu 0830 GMT; Thu 0430 EDT)
Consensus Forecast, Change: 0 basis points
Consensus Forecast, Level: 1.75%
The majority of forecasters see no move on the policy rate until at least the next MPA in June. However, persistently sub-2 percent inflation means that a 25 basis point cut is at least a possibility.
German PMI Flashes for March (Thu 0930 CET; Thu 0830 GMT; Thu 0430 EDT)
Consensus Forecast, Composite: 46.8
Consensus Forecast, Manufacturing: 43.5
Consensus Forecast, Services:48.8
Manufacturing sank into even deeper contraction in February, falling to 42.5 from January’s 45.5. Small improvement to 43.5 is expected for March. Services, which improved in February to 48.3, are seen at 48.8. Consensus for March’s composite is 46.8 following February’s 46.3.
Eurozone PMI Flashes for March (Thu 1000 CET; Thu 0900 GMT; Thu 0500 EDT)
Consensus Forecast, Composite: 49.6
Consensus Forecast, Manufacturing: 47.0
Consensus Forecast, Services: 50.5
The composite is expected to rise to 49.6 in March versus 49.2 in February. Manufacturing is expected at 47.0 versus February’s lower-than-expected 46.5 with services expected at 50.5 from February’s higher-than-expected 50.2.
UK PMI Flashes for March (Thu 0930 GMT; Thu 0530 EDT)
Consensus Forecast, Composite: 53.3
Consensus Forecast, Manufacturing: 47.8
Consensus Forecast, Services: 54.2
Services growth slowed slightly in February to 53.8 with March expected to slow further to 53.3. Manufacturing improved slightly but remained in the doldrums at 47.5 with March’s consensus at 47.8. The composite is expected to rise slightly to 53.3 from February’s 53.0.
Bank of England Announcement (Thu 1200 GMT; Thu 0800 EDT)
Consensus Forecast, Change: 0 basis points
Consensus Forecast, Level: 5.25%
Bank Rate is expected to be left at 5.25 percent. Swati Dhingra is almost certain to vote again for a 25-basis-point cut but will probably be the lone dove.
Japanese CPI for February (Fri 0830 JST; Thu 1930 EDT; Thu 2330 GMT)
Consensus Forecast, Year over Year: 2.9%
Consensus Forecast, Ex-Fresh Food; Y/Y: 2.8%
Consensus Forecast, Ex-Fresh Food Ex-Energy; Y/Y: 3.3%
Consumer inflation in Japan is expected to accelerate in two key measures in February as the base-year effect of utility subsidies has run its course and after an influx of Asian visitors during the lunar holidays boosted hotel fees, offsetting a continued slowdown in price hikes for processed foods. February is expected to re-accelerate to a year-over-year 2.9 percent versus 2.2 percent in January; when excluding fresh food, the rate is seen at 2.8 percent versus 2.0 percent. However when also excluding energy, the rate is seen slowing to 3.3 from 3.5 percent.
UK Retail Sales for February (Fri 0700 GMT; Fri 0300 EDT)
Consensus Forecast, Month over Month: -0.5%
Consensus Forecast, Year over Year: -1.0%
After rebounding a monthly 3.4 percent in January following December’s 3.3 percent slump, volume sales in February are expected to fall back 0.5 percent.
German Ifo for March (Fri 1000 CET; Fri 0900 GMT; Fri 0500 EDT)
Consensus Forecast, Business Climate: 86.0
Consensus Forecast, Current Conditions: 87.0
Consensus Forecast, Business Expectations: 85.1
Though edging 3 tenths higher, February’s 85.5 was the second lowest business climate reading since October 2022 and historically very weak. March’s consensus is 86.0.
Canadian Retail Sales for January (Fri 0830 EDT; Fri 1230 GMT)
Consensus Forecast, Month over Month: -0.4%
Retail sales in January are expected to fall 0.4 percent on the month to partly reverse a mostly as-expected 0.9 percent rise in December.
|
