|
Global demand for labor remains strong and consumer demand, outside of Germany, is generally solid. A safety scandal in Japan’s auto sector is hurting this country’s production while production in the US is on the rise despite troubles at Boeing. Economic confidence generally remains flat though consumer sentiment in the US has seen a recent pickup especially the last two weeks of March. Global activity on net is coming in better than expected suggesting that the restrictive effects of prior rate hikes may well be passing, evident also in Eurozone money supply which is beginning to loosen.
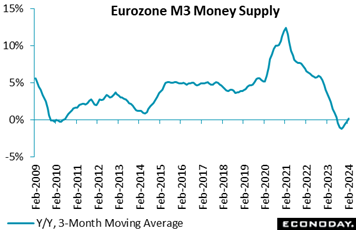 Broad money expanded in February. A 0.2 percent monthly gain put annual growth at 0.4 percent, up from January's 0.1 percent mark and the strongest print since June last year. It was also enough to lift headline 3-month moving average rate from minus 0.2 percent to plus 0.2 percent, in line with Econoday’s consensus. Broad money expanded in February. A 0.2 percent monthly gain put annual growth at 0.4 percent, up from January's 0.1 percent mark and the strongest print since June last year. It was also enough to lift headline 3-month moving average rate from minus 0.2 percent to plus 0.2 percent, in line with Econoday’s consensus.
The increase in the single month’s annual rate was largely attributable to narrow money M1 where contraction eased to 7.7 percent following 8.6 percent contraction in January. Among M3 counterparts, private sector loans rose 0.2 percent on the year after a 0.1 percent dip and, after adjustment for loan sales and securitisation as well for positions due to notable cash pooling services, 0.7 percent following a 0.4 percent gain. Within the latter, adjusted loans to households were steady (0.3 percent) but borrowing by non-financial corporations (0.4 percent after 0.2 percent) firmed slightly.
In sum, the February data hint that the effects of earlier ECB tightening are beginning to diminish although monetary conditions in general remain tight.
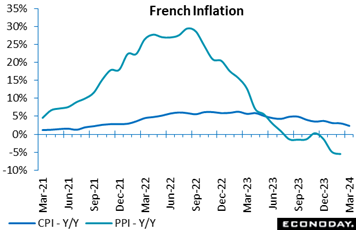 French inflation fell sharply and by much more than expected in March. Consumer prices provisionally rose 0.2 percent on the month, some 0.5 percentage points less than the consensus and a small enough increase to slash the annual inflation rate from February's 3.0 percent to 2.3 percent. The rate now stands at its weakest mark since September 2021. French inflation fell sharply and by much more than expected in March. Consumer prices provisionally rose 0.2 percent on the month, some 0.5 percentage points less than the consensus and a small enough increase to slash the annual inflation rate from February's 3.0 percent to 2.3 percent. The rate now stands at its weakest mark since September 2021.
The deceleration in the annual rate was broad-based but helped by sharp declines in food (1.7 percent) and energy (10.7 percent). Inflation in overall manufactured goods dropped from 0.4 percent to a minimal 0.1 percent while its service sector counterpart eased from 3.2 percent to 3.0 percent. Consequently, the core rate (2.7 percent in February) declined as well.
On a harmonised basis, French consumer prices fell from 3.2 percent all the way to 2.4 percent in March, just 4 tenths above the ECB target. This together with a 1.3 percent rate for Italy (which we’ll turn to next), bodes well for another fall in the headline Eurozone rate, data that will be posted on Wednesday of the coming week (see Looking Ahead at the end of this article). The ECB will be happy with these results though it will note that prices in services remain somewhat sticky.
Continuing with France, producer prices contracted again in February, this time by 1.7 percent on the month following a 1.0 percent drop in January. On the year, producer prices now stand at minus 5.5 percent, down from minus 4.9 percent at the start of the year. Mining and quarrying, energy and water led February’s decline.
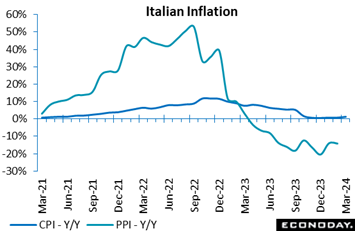 Consumer prices in Italy continued to undershoot expectations in March. A 0.1 percent monthly increase for the month’s flash was a tick short of the consensus but with base effects quite strongly positive, still large enough to boost annual inflation from February's 0.8 percent to 1.3 percent. Consumer prices in Italy continued to undershoot expectations in March. A 0.1 percent monthly increase for the month’s flash was a tick short of the consensus but with base effects quite strongly positive, still large enough to boost annual inflation from February's 0.8 percent to 1.3 percent.
March's annual increase was largely attributable to easing contraction for non-regulated energy (minus 10.3 percent after minus 17.2 percent), regulated energy (minus 13.8 percent after minus 18.4 percent) and a rise for transport (4.4 percent after 3.8 percent). Pulling down the rate were falls in unprocessed food (minus 2.6 percent after 4.4 percent) and tobacco (minus 1.9 percent after 2.6 percent). Consequently, core inflation edged just a tick higher to 2.4 percent.
The country’s harmonised flash climbed a much steeper 1.2 percent on the month, mainly due to end-of-winter sales of clothing and footwear (not included in the national CPI). This saw the yearly HICP rate rise from 0.8 percent to 1.3 percent, still 7 tenths below the ECB's target. Despite March's uptick, inflation in Italy is unlikely to cause the ECB any sleepless nights. Still, the pick-up will make for some upside risk to the coming week's full Eurozone report.
Looking at producer prices in Italy, they fell for a fourth straight month in data for February. Another sizeable 1.5 percent monthly drop followed January's even steeper 2.5 percent decrease to trim the annual inflation rate from minus 14.0 percent to minus 14.2 percent. Once again the February PPI data, like that from France, underscore the absence of any underlying pipeline price pressures in the manufacturing sector.
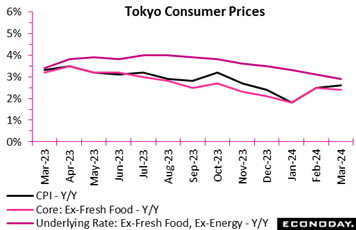 Ex-fresh food core inflation in Tokyo decelerated slightly in March after accelerating sharply in February when waning base-year effects of utility subsidies held back the comparative decline in energy prices. The core rate posted a 2.4 percent gain on year, as expected, after climbing to 2.5 percent in February from 1.8 percent in January. Ex-fresh food core inflation in Tokyo decelerated slightly in March after accelerating sharply in February when waning base-year effects of utility subsidies held back the comparative decline in energy prices. The core rate posted a 2.4 percent gain on year, as expected, after climbing to 2.5 percent in February from 1.8 percent in January.
The year-over-year rise in the total CPI edged up to 2.6 percent (consensus was 2.5 percent) after rising a tenth to 2.5 percent from January's 1.8 percent. The underlying CPI (excluding fresh food and energy) moderated further to a 15-month low of 2.9 percent from 3.1 percent in line with the consensus.
Services costs lifted overall prices higher as firms have been raising wages to secure qualified workers amid widespread labor shortages. In addition, processed food prices were elevated after recent slowing.
Prices of services excluding owners' equivalent rent gained 2.9 percent on the year in March following a 3.1 percent rise in February. Goods prices excluding fresh food rose 3.0 percent, decelerating only slightly from a 3.1 percent rise the previous month
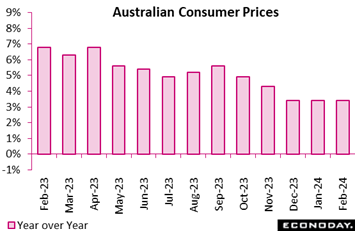 Consumer prices in Australia were unchanged at 3.4 percent in February, only just below the consensus forecast for a small increase to 3.5 percent. Headline inflation has now been at this level for three consecutive months after falling in each of the three previous months, remaining above the Reserve Bank of Australia's target range of two percent to three percent. Consumer prices in Australia were unchanged at 3.4 percent in February, only just below the consensus forecast for a small increase to 3.5 percent. Headline inflation has now been at this level for three consecutive months after falling in each of the three previous months, remaining above the Reserve Bank of Australia's target range of two percent to three percent.
Steady headline inflation in February reflected offsetting moves across major categories. Food prices rose 3.6 percent after advancing 4.4 percent in January, with communication prices also increasing at a slower pace. Clothing and footwear prices rose 0.8 percent after a previous increase of 0.4 percent, while the year-over-year increase in fuel prices accelerated from 3.1 percent to 4.1 percent. Housing costs rose at an unchanged pace of 4.6 percent on the year.
Like the headline, underlying rates were also steady in February. The measure that excludes volatile items – including fuel and holiday travel – fell from 4.1 percent in January to 3.9 percent in February, while the monthly trimmed mean measure rose from 3.8 percent to 3.9 percent.
RBA officials left policy rates on hold at their most recent meeting earlier in the month, noting that "inflation continues to moderate". Officials advised, however, that they are "not ruling anything in or out" and the latest data showing that the moderation in inflation stalled again in February may reinforce their view that it remains premature to start loosening policy in the near-term.
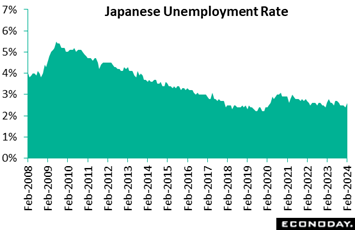 Japanese payrolls posted a 19th straight rise on year in February amid labor shortages at factories, communications firms, hotels and restaurants; nevertheless the adjusted unemployment rate unexpectedly rose to a five-month high of 2.6 percent after falling to a nearly four-year low of 2.4 percent in January. February’s consensus was 2.4 percent. Japanese payrolls posted a 19th straight rise on year in February amid labor shortages at factories, communications firms, hotels and restaurants; nevertheless the adjusted unemployment rate unexpectedly rose to a five-month high of 2.6 percent after falling to a nearly four-year low of 2.4 percent in January. February’s consensus was 2.4 percent.
Compared to a year earlier, the number of employed rose 610,000 to an unadjusted 67.28 million in February for the 19th straight increase, led by a sharp rise among women and also a rebound for men. Both regular and non-regular jobs marked sizable gains. This follows increases of 250,000 in January, 380,000 in December and 560,000 in November.
But the number of unemployed also rose, up 30,000 on the year to an unadjusted 1.77 million in February, after falling 10,000 in January and 20,000 in December and rising 40,000 in November. This has drifted down from a pandemic peak of 2.17 million in October 2020. December's 1.56 million was the lowest since 1.46 million in December 2019.
February’s overall employment increase was led by a continued surge in job creation at information communications firms including news media, mobile phone carriers and software developers. The number of workers in the manufacturing industry rose for a fourth straight month and the pace of increase accelerated. The hotels, restaurants and bars category also continued hiring more people to fill vacancies but at a slower pace. There was a rebound in jobs in the medical and welfare category after a slump in January. Even financial firms raised payrolls from year-earlier levels after cutting jobs for eight months. Employment in the wholesale and retail industry rose for the first time in four months.
On the downside, employment in the real-estate and goods leasing category plunged in February after showing a solid gain in January. The construction industry slashed jobs on the year by a wide margin in February after shedding slightly in January and adding in December.
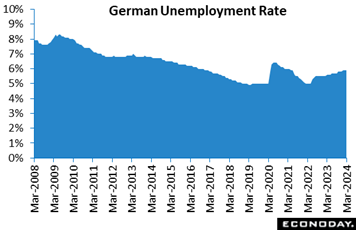 The German labour market loosened a little more in March. However, a modest 4,000 increase was too small to impact the unemployment rate which remained at 5.9 percent, in line with Econoday’s consensus. Looking ahead, vacancies dropped a further 6,000 following an 8,000 decrease last time, consistent with cooling demand for new hires. The German labour market loosened a little more in March. However, a modest 4,000 increase was too small to impact the unemployment rate which remained at 5.9 percent, in line with Econoday’s consensus. Looking ahead, vacancies dropped a further 6,000 following an 8,000 decrease last time, consistent with cooling demand for new hires.
Even so, the March data underline the reluctance of firms to shed staff even with the German economy in recession. The market remains tight and continues to support wage growth at a high enough level to trouble the ECB.
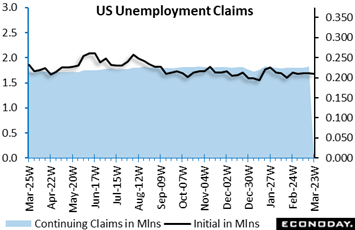 Initial jobless claims in the US extended a steady and very tight trend, edging 2,000 lower to 210,000 in the March 23 week. Claims have held a 210,000 to 212,000 range the past four weeks and a 210,000 to 213,000 range in seven of the past eight weeks. Initial jobless claims in the US extended a steady and very tight trend, edging 2,000 lower to 210,000 in the March 23 week. Claims have held a 210,000 to 212,000 range the past four weeks and a 210,000 to 213,000 range in seven of the past eight weeks.
Continuing claims in lagging data for the March 16 week rose 24,000 to 1.819 million keeping the unemployment rate for insured workers at a very low 1.2 percent, where it has remained unchanged for more than a year!
Federal Reserve officials, wanting to see easing pressures on wage, are looking for loosening in the labor market, but they won't find any in unemployment claims.
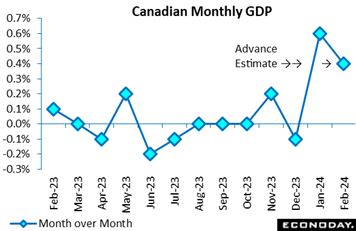 The Canadian economy started the year on a more positive note than anticipated as it expanded 0.6 percent in January, beating expectations of 0.4 percent in an Econoday survey, even when factoring in a slight downward revision to the previous month when activity contracted 0.1 percent after being initially reported as flat. The Canadian economy started the year on a more positive note than anticipated as it expanded 0.6 percent in January, beating expectations of 0.4 percent in an Econoday survey, even when factoring in a slight downward revision to the previous month when activity contracted 0.1 percent after being initially reported as flat.
The advance estimate for February points to a further 0.4 percent increase on the month on widespread gains.
The stronger-than-expected data will weigh in favor of a longer wait before the Bank of Canada starts cutting interest rates, especially with February estimates pointing to a further solid monthly expansion.
The expansion in January was broad based across 18 of 20 sectors, led by a 0.7 percent growth in services as educational services rebounded following the resolution of public sector strikes in Quebec in December and November. Educational services surged 6.0 percent on the month after declines of 3.8 percent in December and 2.3 percent in November. The rebound could have been even stronger if not for a strike by the Saskatchewan Teachers' Federation, which represents around 13,500 teachers, that started in January. Overall, public sector activity - educational services, health care and social assistance and public administration – was up 1.9 percent in February after two months of retreat.
Elsewhere in services, real estate and rental and leasing was up 0.4 percent on higher resale activity. Information and cultural services increased 1.0 percent, led by a 12.0 percent surge in the motion and sound recording industry following the end of a strike in November, with TV shows and other productions resuming. Finance and insurance edged up 0.1 percent after rising 0.8 percent the previous month, with advance estimates pointing to a further increase in February.
Good-producing industries recovered 0.2 percent after contracting 0.5 percent in December. Manufacturing rebounded 0.9 percent after declining 0.8 percent in December, with non-durables up 1.0 percent and durable manufacturing up 0.9 percent. Utilities rose 3.2 percent after falling 3.7 percent. On the downside, construction decreased 0.5 percent in a fourth consecutive retreat. Mining, quarrying, and oil and gas extraction was down 1.9 percent, with energy down 0.7 percent overall. The industry sector was up 0.5 percent, reversing the previous month's drop. In February, advance estimates point to an increase in mining, quarrying, and oil and gas extraction, manufacturing partly offset by a decrease in utilities.
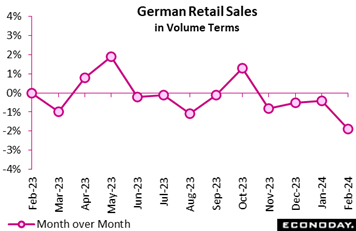 German retailers saw demand contract again in mid-quarter. February’s 1.9 percent monthly drop in sales volumes was much steeper than Econoday’s consensus and means that purchases have now declined in each of the last four months. Sales of food decreased 1.7 percent versus January while non-food was off 1.0 percent. Internet and mail order declined a sharper 2.8 percent. German retailers saw demand contract again in mid-quarter. February’s 1.9 percent monthly drop in sales volumes was much steeper than Econoday’s consensus and means that purchases have now declined in each of the last four months. Sales of food decreased 1.7 percent versus January while non-food was off 1.0 percent. Internet and mail order declined a sharper 2.8 percent.
The February update leaves average purchases in the first two months of the quarter well down from their average level in the fourth quarter of last year. Accordingly, the sector looks certain to subtract from first quarter GDP which also now seems all the more likely to be negative.
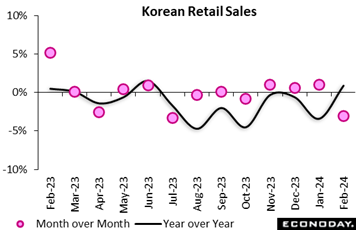 South Korea's retail sales index fell 3.1 percent on the month in February after increasing 1.0 percent in January. On the year, the index rose 0.9 percent after a decline of 3.3 percent previously. Sales of consumer durables, however, fell 9.0 percent on the year after advancing 7.3 percent previously. South Korea's retail sales index fell 3.1 percent on the month in February after increasing 1.0 percent in January. On the year, the index rose 0.9 percent after a decline of 3.3 percent previously. Sales of consumer durables, however, fell 9.0 percent on the year after advancing 7.3 percent previously.
Officials also published a separate report on sales for 25 large retailers. This showed an increase in year-over-year growth from 8.2 percent in January to 13.7 percent in February, with lunar new year holidays helping to boost sales growth for online retailers, department stores and supermarkets.
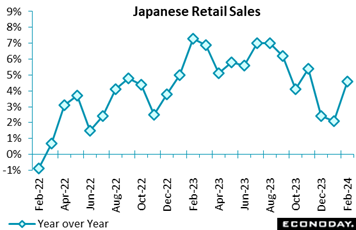 Japanese retail sales rose a higher-than-expected 4.6 percent on the year in February after rising 2.1 percent in January as the weak yen and lunar new year holidays in Asia boosted inbound spending at department stores while mild weather pushed up demand for spring clothing, mitigating the drag from suspended vehicle production, The consensus forecast was a 2.8 percent rise. On the month, retail sales rose a seasonally adjusted 1.5 percent, above the median forecast of a 1.1 percent increase. Japanese retail sales rose a higher-than-expected 4.6 percent on the year in February after rising 2.1 percent in January as the weak yen and lunar new year holidays in Asia boosted inbound spending at department stores while mild weather pushed up demand for spring clothing, mitigating the drag from suspended vehicle production, The consensus forecast was a 2.8 percent rise. On the month, retail sales rose a seasonally adjusted 1.5 percent, above the median forecast of a 1.1 percent increase.
The Ministry of Economy, Trade and Industry maintained its assessment, saying retail sales are "taking one step forward and one step back." The three-month moving average rose 0.1 percent on the month in February after three months of decline.
Sales of automobiles fell 8.6 percent on year in February after marking the first drop in 20 months in January at 4.0 percent drop. Sales of machinery and equipment (largely consumer electronics) rose 5.4 percent in February for the eighth increase in a row after rising 1.5 percent previously.
Sales of food and beverages, a category which has the largest share in retail sales, posted their 17th straight rise, up 5.7 percent after rising 3.5 percent the previous month. Food price markups have peaked but the weak yen could keep import costs high.
General merchandise sales at department stores and supermarkets marked a 24th straight year-over-year gain, up 8.4 percent in February after rising 3.4 percent in January. Sales of apparel and accessories rose 0.7 percent for the first rise in six months after falling 8.3 percent the previous month. Demand for medicine and cosmetics remained solid, up 8.6 percent in February after a 5.5 percent gain in January.
Sales of fuels rose 2.3 percent on the year in February after rising 1.5 percent in January. Retail gasoline prices in Japan have stabilized after hitting a record high in early September and slowing down afterwards. The government has scaled back subsides to refineries.
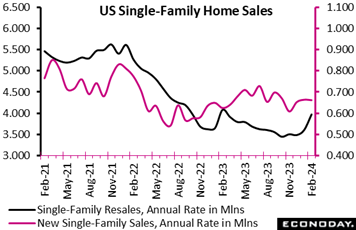 Sales of new single-family homes were nearly unchanged in February, edging down 0.3 percent to 662,000 at a seasonally adjusted annual rate after 664,000 in January as tracked in the red line of the accompanying graph. Compared to February last year, prices in February this year were up 5.9 percent. The latest result was not materially different from the consensus of 675,000 in the Econoday survey of forecasters. Sales of new single-family homes were nearly unchanged in February, edging down 0.3 percent to 662,000 at a seasonally adjusted annual rate after 664,000 in January as tracked in the red line of the accompanying graph. Compared to February last year, prices in February this year were up 5.9 percent. The latest result was not materially different from the consensus of 675,000 in the Econoday survey of forecasters.
Sales of new homes continued at a solid pace despite mortgage rates remaining relatively elevated. Some of the sales will be due to homebuyers with a lower rate from a mortgage application in January deciding to buy in February before their rate lock expired. The average rate for a Freddie Mac 30-year fixed rate mortgage was 6.64 percent in January and rose to 6.81 percent in February, and for March to-date is averaging 6.83 percent.
The supply of new homes available for sale remains plentiful compared to the scarcity of existing units. In February there was 8.4 months' supply of homes, much the same as 8.3 in January and 8.4 in February 2023. The median price of a new home slipped 3.5 percent in February to $400,500 from $414,900 in January and was down 7.6 percent from $433,300 in February 2023. The decrease in price included some discounting on the part of homebuilders, but also reflected that homebuilders are responding to demand for smaller, entry-level properties for first-time buyers and likely to downsizing on the part of retirees.
Homebuilders are finding fewer buyers for projects not yet started, but more where units are already under construction but not completed. The share of homes sold in February for units not started was down to 12 percent in February after 15 percent in January. February is the smallest share since 13 percent in December 2022. Homes under construction had a 45 percent share of sales in February after 41 percent in January. Homes completed accounted for the remaining 42 percent of sales.
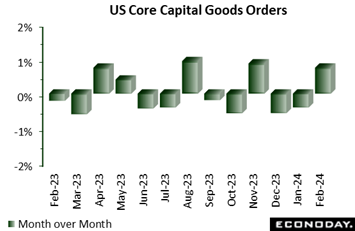 Durable goods orders in the US rebounded 1.4 percent in February, roughly in line with expectations, following a 6.9 percent drop in January. Excluding transportation, orders were up 0.5 percent, also in line with the consensus. Core capital goods orders (nondefense ex-aircraft) increased 0.7 percent on the month, easily beating the highest forecast of 0.2 percent, but following a 0.4 percent drop in January. Durable goods orders in the US rebounded 1.4 percent in February, roughly in line with expectations, following a 6.9 percent drop in January. Excluding transportation, orders were up 0.5 percent, also in line with the consensus. Core capital goods orders (nondefense ex-aircraft) increased 0.7 percent on the month, easily beating the highest forecast of 0.2 percent, but following a 0.4 percent drop in January.
Transportation equipment rose 3.3 percent in February, too little to recover the 18.3 percent drop in January. Motor vehicles and parts were up 1.8 percent, and nondefense aircraft and parts rebounded 24.6 percent, partly offsetting January's 63.5 percent plunge. Defense aircraft and parts orders were up 9.8 percent.
Machinery orders rose 1.9 percent, more than erasing the 0.8 percent decrease recorded in January. Gains elsewhere included primary metals (1.4 percent) and fabricated metal products (0.8 percent), while computers and electronics were down 1.4 percent. Note that all these categories provide inputs into the capital goods data.
Total shipments advanced 1.2 percent, inventories rose 0.3 percent, while unfilled orders, which have been climbing sharply, were flat.
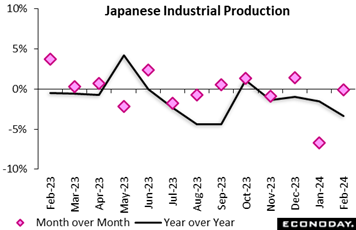 Japan's industrial production unexpectedly slipped 0.1 percent on the month in February following a 6.7 percent plunge in January as the impact of suspended vehicle output over a safety test scandal lingered. The median forecast was a 1.0 percent gain. Of the 15 industries, 7 posted decreases from the previous month and 8 marked increases. The overall decline was led by the auto sector, which offset gains among chemical firms as well as pulp and paper makers. Japan's industrial production unexpectedly slipped 0.1 percent on the month in February following a 6.7 percent plunge in January as the impact of suspended vehicle output over a safety test scandal lingered. The median forecast was a 1.0 percent gain. Of the 15 industries, 7 posted decreases from the previous month and 8 marked increases. The overall decline was led by the auto sector, which offset gains among chemical firms as well as pulp and paper makers.
From a year earlier, factory output posted a fourth straight drop, down 3.4 percent (versus consensus of a 2.8 percent decline), after a 1.5 percent dip the prior month. Output has also received downward pressures from the powerful New Year’s earthquake in the northwestern region of Hokuriku, which has educed electronic parts supply.
METI's survey of producers indicated that output is expected to rebound 4.5 percent in March and rise a further 3.3 percent in April.
The January slump was caused by suspension of all domestic production by Toyota Motor group firm Daihatsu over a vehicle safety scandal from late December until mid-February, which has had a widespread impact beyond the auto industry. Toyota also suspended shipments of 10 models in late January after its supplier Toyota Industries admitted to cheating on engine testing.
The ministry maintained its assessment after downgrading it for the first time in six months for the January data, saying industrial output "has weakened while taking one step forward and one step back." METI said it will keep a close watch on the effects of global economic growth and resumed automobile production.
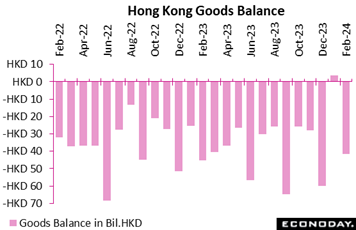 Hong Kong's merchandise trade balance swung from a surplus of HK$3.6 billion in January to a deficit of HK$41.7 billion in February. Exports rose 0.8 percent on the year in February after surging 33.6 percent in January, while imports fell 1.8 percent after an increase of 21.7 percent previously. Hong Kong's merchandise trade balance swung from a surplus of HK$3.6 billion in January to a deficit of HK$41.7 billion in February. Exports rose 0.8 percent on the year in February after surging 33.6 percent in January, while imports fell 1.8 percent after an increase of 21.7 percent previously.
This volatility in the trade balance and year-over-year growth in exports and imports largely reflects the timing of lunar new year holidays, which occurred in January last year but in February this year. This means the number of working days - and, as a result, the volume of trade flows - were somewhat lower than they otherwise would have been in January 2023 but were at more normal levels in January 2024. Similarly, working days and trade volumes were at more normal levels in February 2023 but lower than they otherwise would have been in February 2024.
Because of this, officials advise instead that it is more meaningful to examine combined January and February trade data. Exports increased 16.6 percent on the year for the first two months of the year, up from year-over-year growth of 11.0 percent in December, while imports rose 9.7 percent after increasing 11.6 percent in December. Officials noted solid demand from mainland China and the US, offset by weakness in demand from the European Union and mixed performance among Asian trading partners. Officials continue to expect external factors will weigh on export performance in the near-term, but expressed optimism that an expected easing in global monetary conditions may provide support later in the year.
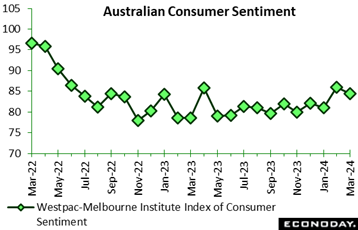 Australia’s Westpac-Melbourne Institute index of consumer sentiment fell 1.8 percent on the month from 86.0 in February to 84.4 in March. This decline follows a strong increase previously, extending the volatility in sentiment seen in recent months. The index has oscillated between increases and declines for the last seven months, largely reflecting shifting assessments of the outlook for monetary policy over this period. Cost of living pressures also continue to weigh on consumer sentiment. Australia’s Westpac-Melbourne Institute index of consumer sentiment fell 1.8 percent on the month from 86.0 in February to 84.4 in March. This decline follows a strong increase previously, extending the volatility in sentiment seen in recent months. The index has oscillated between increases and declines for the last seven months, largely reflecting shifting assessments of the outlook for monetary policy over this period. Cost of living pressures also continue to weigh on consumer sentiment.
This month's survey was conducted over four days last week, just before and just after the Reserve Bank of Australia policy meeting. Officials left policy rates on hold at that meeting but advised they would not rule out the possibility of additional rate increases in upcoming meetings. Respondents who were surveyed after this statement were much less confident about the outlook than those surveyed before.
Around 40 percent of respondents still expect further interest rate increases by the RBA over the next 12 months, with just over 20 percent expecting rate cuts, just over 20 percent expecting no change, and the balance saying they don't know. The survey indicates that respondents are less confident about the outlook for their family finances and the economic outlook over the next 12 months but, in contrast, are less pessimistic that now is a good time to buy a house.
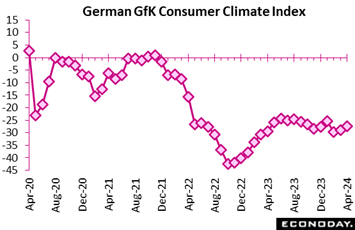 GfK’s survey revised confidence marginally firmer in March and forecasts another slight improvement in April. The climate indicator this month was nudged a couple of ticks higher to minus 28.8 while April is expected to climb to minus 27.4, slightly stronger than the consensus. However, both values remain historically weak. GfK’s survey revised confidence marginally firmer in March and forecasts another slight improvement in April. The climate indicator this month was nudged a couple of ticks higher to minus 28.8 while April is expected to climb to minus 27.4, slightly stronger than the consensus. However, both values remain historically weak.
The improvement in March in part reflected stronger income expectations which rose 3.3 points to minus 1.5. This was their highest reading since February 2022, before the war in Ukraine began. Economic expectations were also up 3.3 points at minus 3.1. However, they were still 6.8 points below their level a year ago. Moreover, the willingness to buy dipped 0.3 points to minus 15.3, an increase of only 1.7 points versus March 2023.
While the trend in consumer confidence would seem to be moving slowly in the right direction, its absolute level remains too weak to signal any near-term recovery in household spending.
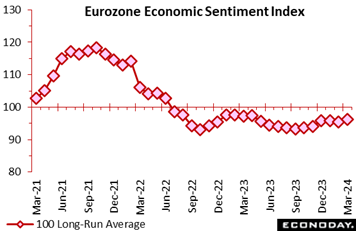 Economic sentiment improved in March, rising 0.8 points versus February’s 96.3. This was 0.5 points above the consensus and a 3-month high but still nearly 4 points short of its long-run average. Economic sentiment improved in March, rising 0.8 points versus February’s 96.3. This was 0.5 points above the consensus and a 3-month high but still nearly 4 points short of its long-run average.
The modest improvement reflected rising confidence in industry (minus 8.8 after minus 9.4), retail trade (minus 5.7 after minus 6.6) and in the consumer sector (minus 14.9 after minus 15.5). Confidence in construction (minus 5.6 after minus 5.5) was essentially unchanged.
Regionally, national sentiment improved in France (100.7 after 98.1), Germany (89.8 after 88.9) and Italy (100.9 after 99.4). Spain (102.0 after 102.4) posted a modest deterioration.
Inflationary expectations were mixed. Hence, in manufacturing expected selling prices rose from 3.9 to 5.6, an 11-month peak. However, by contrast, in the key services area they declined from 17.3 to 15.2, a 6-month low. Households (12.3 after 15.4) also fell, albeit to only a 2-month trough.
March's update remains consistent with, at best, only sluggish growth for Eurozone GDP this quarter. Still, taken together with the varied picture of inflation, the ECB is unlikely to feel any more pressured to deliver a cut in interest rates at its next meeting in April.
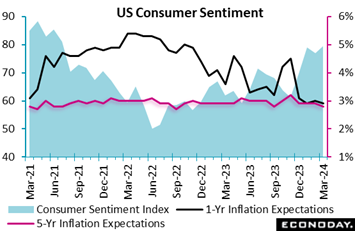 Consumer sentiment accelerated noticeably late this month, based at least on the separation between the US index's mid-month showing at 76.5 and final showing at 79.4. Splitting the difference implies a second-half reading in the mid-to-low 80s which would be the first 80s showing since June 2021. As is, the 79.4 builds on jumps in December and January for the best reading since July 2021. Consumer sentiment accelerated noticeably late this month, based at least on the separation between the US index's mid-month showing at 76.5 and final showing at 79.4. Splitting the difference implies a second-half reading in the mid-to-low 80s which would be the first 80s showing since June 2021. As is, the 79.4 builds on jumps in December and January for the best reading since July 2021.
Part of the gain is tied to easing inflationary pressures, evident in both the 1-year and 5-year expectations which both edged 1 tenth lower in the month to 2.8 and 2.9 percent respectively. The 5-year rate never really has shown much pressure during the inflation surge (indicating that long-term inflation expectations have remained firmly anchored all along) while the 1-year rate has been coming down from a mid-5 percent peak in mid-2022. The cooling in the 1-year rate is in line with the Federal Reserve’s key PCE price indexes, at 2.5 percent overall in data for February and 2.8 percent for the ex-food ex-energy core in mostly steady and as-expected results released in Friday’s personal income and outlays report.
Turning back to the sentiment index, both components improved in March especially current conditions up 3.1 points to 82.5 with expectations gaining 2.2 points to 77.4. The gain in current conditions will help boost forecasts for March retail spending.
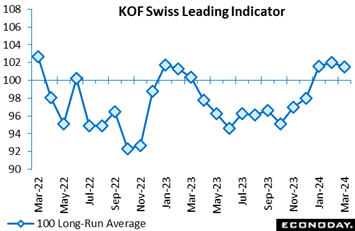 The leading economic indicator lost a little ground in March but still held above its 100 historic norm for a third straight month. At 101.5 the latest reading was down from February's upwardly revised 102.0 and slightly short of the market consensus. The leading economic indicator lost a little ground in March but still held above its 100 historic norm for a third straight month. At 101.5 the latest reading was down from February's upwardly revised 102.0 and slightly short of the market consensus.
The monthly dip was mainly attributable to weaker conditions in construction and household consumption. However, finance and insurance posted more positive signals while manufacturing was broadly flat.
The March update leaves overall economic activity lagging slightly behind market expectations as we detail below in the Bottom Line.
Global data are continuing to exceed forecasts ending the week at 16 on the Relative Performance Index (RPI) and rising a bit further to 21 when excluding price data (RPI-P) to indicate tangibly greater-than-expected strength in real activity. These results are only slightly less favorable than the prior week’s respective RPI and RPI-P scores of 23 and 26.
First quarter data from the Eurozone continue to surprise mainly on the upside but not by much. At 3, the latest readings on both the RPI and RPI-P show overall economic activity currently performing much as expected. And this should be more than enough to underpin speculation that the European Central Bank will be cutting key interest rates soon.
In the UK, the latest real economy news on average has contained no major shocks. Indeed, the RPI-P ended last week at exactly zero. Still, with the RPI currently at minus 12, inflation developments remain on the soft side of forecasts which should mean that a reduction in Bank Rate is still just a matter of time.
A similar picture is true of Switzerland where, at minus 4, the RPI stayed close to zero and, at minus 10, the RPI-P shows just a very limited degree of underperformance. Without some upside surprises on inflation, the Swiss National Bank’s policy rate could well be lowered again at June’s Monetary Policy Assessment.
In Japan, a mixed week for economic data left both the RPI (minus 18) and RPI-P (minus 20) in negative surprise territory, extending the clear bias towards downside surprises seen since the start of the year. Against this backdrop, prospective Bank of Japan tightening is unlikely to be aggressive.
In Canada, the real economy began 2024 on a surprisingly strong note and lifted the RPI-P to 43, its highest value since June 2023. Even so, with the RPI fully 20 points lower at 23, the implications are that inflation continues to undershoot expectations so the door to a Bank of Canada rate cut remains open.
US data maintained an upside bias but just barely, slowing from 31 the prior week for both the RPI and RPI-P to 5 and 6 respectively in the latest week. Nevertheless first quarter growth is shaping up well, justifying the Federal Reserve’s decision to leave policy on hold earlier this month.
**Contributing to this article were Jeremy Hawkins, Brian Jackson, Mace News, Max Sato, and Theresa Sheehan
Japan’s quarterly Tankan survey will open the week amid expectations for slowing at large manufacturers. Slowing is expected for US nonfarm payroll growth on Friday to a still strong 200,000 in March from 275,000 in February; wage pressures are also seen slowing but still overheated. Likewise, slowing is expected for Canadian employment on Friday to a very solid 25,000 from February’s 40,700.
Inflation data from Europe will be Tuesday’s and Wednesday’s focus, first from German where some cooling is expected for March then from the Eurozone as a whole where only marginal cooling is the call, to 2.5 from 2.6 percent overall and to 3.0 from 3.1 percent for the narrow core.
Policy news will include the Bank of Canada’s business outlook survey on Monday and minutes from the Reserve Bank of Australia on Tuesday and European Central Bank on Thursday.
Japanese Tankan for First Quarter (Mon 0850 JST; Sun 2350 GMT; Sun 1950 EDT)
Consensus Forecast, Large Manufacturers: 10
Consensus Forecast, Large Non-Manufacturers: 33
Consensus Forecast, Capital Expenditure Plans: 10.4%
Forecasters see the first quarter index for large manufacturers, reflecting suspended vehicle output due to a safety scandal, falling to 10 from 12 in the fourth quarter but rising to 33 from 30 for non-manufacturers. Capital expenditure plans for large firms are seen slowing to 10.4 percent from 13.5 percent.
China: S&P Manufacturing PMI for March (Mon 0945 CST; Mon 0145 GMT; Sun 2145 EDT)
Consensus Forecast: 51.0
After an as-expected 50.9 in February, S&P's manufacturing PMI is expected to edge a tenth higher in March to 51.0. This PMI has held above breakeven 50 for the past for four months, in contrast to the official CFLP manufacturing PMI which has been in long contraction.
US: ISM Manufacturing Index for March (Mon 1000 EDT; Mon 1400 GMT)
Consensus Forecast: 48.3
The ISM manufacturing index has been in contraction the last 16 months and isn’t expected to emerge in March, at a consensus 48.3 versus February’s much lower-than-expected 47.8.
Korean CPI for March (Tue 0800 KST; Mon 2300 GMT; Mon 1900 EDT)
Consensus Forecast, Month over Month: 0.3%
Consensus Forecast, Year over Year: 3.0%
Consumer prices in March, which in February rose to 3.1 percent from January’s 2.8 percent, are expected to edge lower to 3.0 percent.
German CPI, Preliminary March (Tue 1400 CEST; Tue 1200 GMT; Tue 0800 EDT)
Consensus Forecast, Month over Month: 0.5%
Consensus Forecast, Year over Year: 2.3%
Harmonised
Consensus Forecast, Month over Month: 0.7%
Consensus Forecast, Year over Year: 2.4%
March’s consensus is a year-over-year 2.3 percent versus February’s 2.5 percent rate that was down from 2.9 percent in January. Consensus for the harmonised data is 2.4 percent which would compare with 2.7 percent in February.
China: S&P PMI Composite for March (Wed 0945 CST; Wed 0145 GMT; Tue 2145 EDT)
Services Index, Consensus Forecast: 52.7
S&P's services PMI in March is expected to edge back to 52.7 versus February’s 52.5 and January’s 52.7.
Eurozone HICP Flash for March (Wed 1100 CEST; Wed 0900 GMT; Wed 0500 EDT)
Consensus Forecast, Year over Year: 2.5%
Narrow Core
Consensus Forecast, Year over Year: 3.0%
Consensus for March’s HICP flash is 2.5 percent and 3.0 percent for the narrow core. These would compare respectively with February’s 2.6 and 3.1 percent, the former versus January’s 2.8 percent and the latter versus 3.3 percent.
Eurozone Unemployment Rate for February (Wed 1100 CEST; Wed 0900 GMT; Wed 0500 EDT)
Consensus Forecast: 6.4%
Consensus for February's unemployment rate is no change at 6.4 percent. Unemployment in the Eurozone has been running at record lows.
US ADP Private Payrolls for March (Wed 0815 EDT; Thu 1215 GMT)
Consensus Forecast: 150,000
Forecasters see ADP's March employment number at 150,000. This would compare with February growth in private payrolls reported by the Bureau of Labor Statistics of 223,000. ADP’s number for February was 140,000.
Eurozone PPI for February (Thu 1100 CEST; Thu 1000 GMT; Thu 0500 EDT)
Consensus Forecast, Month over Month: -0.5%
Consensus Forecast, Year over Year: -8.4%
Producer prices have shown sustained weakness and are expected to fall 8.4 percent on the year in February which would compare with 8.6 percent contraction in January. The monthly showing, at a consensus decline of 0.5 percent in February, fell 0.9 percent in both January and December.
Canada Merchandise Trade Balance for February (Thu 0830 EDT; Thu 1230 GMT)
Consensus Forecast: C$0.8 billion
February’s trade balance is seen in surplus of C$0.8 billion versus January’s C$0.5 billion surplus that masked declines for both imports and exports.
Japanese Household Spending for February (Fri 0830 JST; Thu 2330 GMT; Thu 1930 EDT)
Consensus Forecast , Month over Month: 0.3%
Consensus Forecast , Year over Year: -3.0%
Real household spending in February is expected to rise 0.3 percent on the year versus unexpectedly deep contraction in January of 6.3 percent.
Australian International Trade in Goods for February (Fri 1130 AEDT; Fri 0030 GMT; Thu 2030 EDT)
Consensus Forecast, Balance: A$10.5 billion
Consensus for international trade in goods in February is a surplus of A$10.5 billion versus January’s A$11.0 billion surplus that for a second month in a row saw monthly gains for both imports and exports.
German Manufacturing Orders for February (Fri 0800 CEST; Fri 0600 GMT; Fri 0200 EDT)
Consensus Forecast, Month over Month: 0.8%
Manufacturing orders are expected to increase a monthly 0.8 percent in February versus January’s 11.3 percent plunge and December’s 12.0 percent surge in swings tied to major orders.
French Industrial Production for February (Fri 0845 CEST; Fri 0645 GMT; Fri 0245 EDT)
Consensus Forecast, Month over Month: 0.6%
February production is expected to increase 0.6 percent after falling a much sharper-than-expected 1.1 percent in January, a month-over-month fall that was likely exaggerated by seasonal adjustment issues in December.
Eurozone Retail Sales for February (Fri 1100 CEST; Fri 0900 GMT; Fri 0500 EDT)
Consensus Forecast, Month over Month: -0.2%
Consensus Forecast, Year over Year: -0.8%
Retail sales volumes in February are expected to fall 0.2 percent on the month after edging 0.1 percent higher in January that left intact a subdued trend.
Canadian Labour Force Survey for March (Fri 0830 EDT; Fri 1230 GMT)
Consensus Forecast: Employment Change: 25,000
Consensus Forecast: Unemployment Rate: 5.9%
Employment in March is expected to rise 25,000 versus February’s 40,700 which well exceeded Econoday’s consensus for a second month in a row. March’s unemployment rate is expected to edge a tenth higher to 5.9 percent.
US Employment Situation for March (Fri 0830 EDT; Fri 1230 GMT)
Consensus Forecast: Change in Nonfarm Payrolls: 200,000
Consensus Forecast: Unemployment Rate: 3.9%
Consensus Forecast: Average Hourly Earnings M/M: 0.3%
Consensus Forecast: Average Hourly Earnings Y/Y: 4.1%
A 200,000 rise is the call for nonfarm payroll growth in March versus 275,000 in February which was higher than expected but included a sharp downward revision to a still strong 229,000 in January. Average hourly earnings in March are expected to rise 0.3 percent on the month for a year-over-year rate of 4.1 percent; these would compare with February’s rates of 0.1 percent on the month and 4.3 percent on the year. March’s unemployment rate is expected to hold unchanged at February’s 3.9 percent which was higher than expected.
|
