|
Global economic performance continues to outstrip forecasts, running in the 20s according to Econoday’s Relative Performance Index. March’s 303,000 rise was the fifth month in a row that US nonfarm payrolls have exceeded Econoday’s consensus estimate and the fourth month in a row that exceeded the high end of Econoday’s consensus range. The 3-month average of 276,000 is the highest since March last year! What is going on here? Is it a fair question to ask whether rates in the US have really peaked?
Perhaps what we’re finding is that the degree of embedded rate hikes, however substantial, isn’t doing enough to slow current activity. No where is growth stronger than it is in India where the Bank of India nevertheless refrained from raising rates, instead repeating on Friday the familiar phrase that prior policy tightening, in due course, will slow inflation back to the bank’s target. And yes, aside from the US and India, the pace of activity in most economies is demonstrably cooling as is inflation, and perhaps no where more convincingly than in Europe – that is except for service prices.
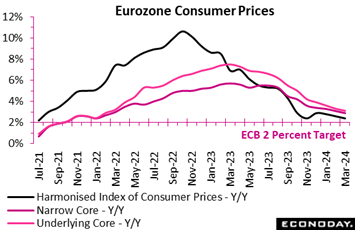 Inflation in the Eurozone provisionally fell again in March. A 0.8 percent monthly rise in the flash HICP put the annual rate at 2.4 percent, down from February's final 2.6 percent and a tick below Econoday’s consensus. The latest reading matches the lowest mark since July 2021 and means that the headline rate is now just 0.4 percentage points above its medium-term target. Inflation in the Eurozone provisionally fell again in March. A 0.8 percent monthly rise in the flash HICP put the annual rate at 2.4 percent, down from February's final 2.6 percent and a tick below Econoday’s consensus. The latest reading matches the lowest mark since July 2021 and means that the headline rate is now just 0.4 percentage points above its medium-term target.
There was also good news on the core. The narrowest measure was down 0.2 percentage points at 2.9 percent, similarly a tick short of forecasts and its first sub-3 percent post since March 2022. Excluding just energy and unprocessed food, the rate also dropped 0.2 percentage points to 3.1 percent.
However, elsewhere the picture was more mixed. While inflation in non-energy industrial goods decreased from 1.6 percent to just 1.1 percent, the rate in services again held steady at 4.0 percent and has now been at that level for five consecutive months. Energy (minus 1.8 percent after minus 3.7 percent) provided another boost but food, alcohol and tobacco (2.7 percent after 3.9 percent) subtracted again.
Regionally, headline inflation was lower in most member states, including France (2.4 percent after 3.2 percent) and Germany (2.3 percent after 2.7 percent). Both Italy (1.3 percent after 0.8 percent) and Spain (3.2 percent after 2.9 percent) recorded gains but the former is still below target.
The flash March data should leave the European Central Bank happy enough but still wary. Headline and, more importantly, core inflation continue to decelerate but prices in services remain worryingly sticky and the rate well above target. This should ensure no change in key interest rates in the coming week and will leave Governing Council members all the more keen to see some easing in the sector's inflation in the April and May data.
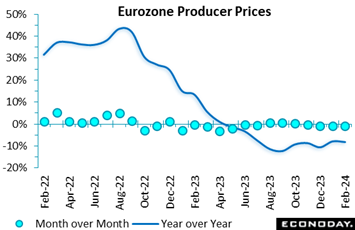 Producer prices in the Eurozone fell for a fourth straight month in February. Following a 0.9 percent drop in January, the PPI declined a further 1.0 percent on the month, double the consensus and the steepest decrease in the sequence. Annual inflation was pared from January’s minus 8.0 percent to minus 8.3 percent. Producer prices in the Eurozone fell for a fourth straight month in February. Following a 0.9 percent drop in January, the PPI declined a further 1.0 percent on the month, double the consensus and the steepest decrease in the sequence. Annual inflation was pared from January’s minus 8.0 percent to minus 8.3 percent.
In line with January, February's monthly slide was largely due to energy where prices were down a further 3.5 percent. Still, even when excluding this category, the PPI only edged up 0.1 percent, trimming the yearly underlying rate from minus 1.3 percent to minus 1.5 percent. Elsewhere, intermediates were flat but there were gains in capital and non-durable consumer goods (both 0.2 percent) and consumer durables (0.3 percent).
The February report provides further evidence that deflationary pressures in Eurozone manufacturing are beginning to ebb – core prices recorded their first back-to-back increase since February/March last year. Even so, the broader picture remains soft and the sector poses few problems for the ECB in its quest to get HICP inflation back on target.
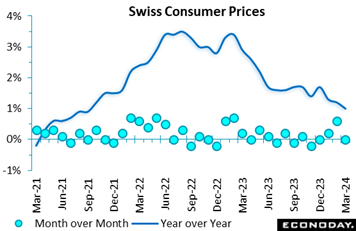 Consumer prices are significantly weaker than expected in Switzerland. March’s flat monthly performance undercut the consensus by fully 0.3 percentage points and trimmed the annual inflation rate from 1.2 percent to 1.0 percent, its lowest reading since September 2021. Consumer prices are significantly weaker than expected in Switzerland. March’s flat monthly performance undercut the consensus by fully 0.3 percentage points and trimmed the annual inflation rate from 1.2 percent to 1.0 percent, its lowest reading since September 2021.
The drop in annual inflation in part reflected a 0.2 percent fall in domestic prices that reduced their yearly rate from 1.9 percent to 1.8 percent. This was compounded by a 0.7 percent rise in import prices that lowered their 12-month rate from minus 1.0 percent to minus 1.3 percent.
Within the CPI basket the main upward pressure on the monthly change came from clothing and footwear, where prices rose 3.4 percent, and recreation and culture, up 1.4 percent. However, gains here were essentially offset by falls in restaurants and hotels (1.4 percent) and household goods and services (0.8 percent). As a result, core prices (ex-food and energy) edged 0.1 percent higher to reduce the underlying yearly inflation rate from 1.1 percent to just 1.0 percent, the weakest post since January 2022.
The March data are surprisingly soft and will bolster speculation that the Swiss National Bank might well cut its policy rate again in June.
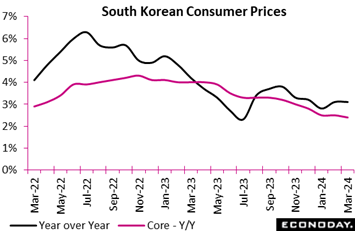 South Korea's headline consumer price index rose 3.1 percent on the year in March, as it did in February, holding above the Bank of Korea's 2.0 percent target. The index rose 0.1 percent on the month after advancing 0.5 percent previously. Steady headline inflation reflects similar stability in food prices. These rose 0.2 percent on the month, with the year-over-year increase easing from 6.9 percent to 6.7 percent. South Korea's headline consumer price index rose 3.1 percent on the year in March, as it did in February, holding above the Bank of Korea's 2.0 percent target. The index rose 0.1 percent on the month after advancing 0.5 percent previously. Steady headline inflation reflects similar stability in food prices. These rose 0.2 percent on the month, with the year-over-year increase easing from 6.9 percent to 6.7 percent.
Underlying price pressures were also steady in March. Core CPI, excluding food and energy, rose 2.4 percent on the year, easing from an increase of 2.5 percent previously, and advanced 0.1 percent on the month after a previous increase of 0.3 percent. Transport costs rose at a faster pace, up 2.8 percent on the year after increasing 2.0 percent previously, while the year-over-year increase in clothing prices moderated from 5.7 percent to 5.4 percent.
At its most recent policy meeting, held in mid-February, the BoK left policy rates on hold. Officials noted then that higher agricultural prices would likely put upward pressure on headline inflation in the near-term and that "there are high uncertainties around the inflation outlook". March's data showing headline inflation remaining well above the target level will likely reinforce officials' view that policy settings will need to remain restrictive in upcoming meetings. The BoK's next policy meeting will be held in the coming week.
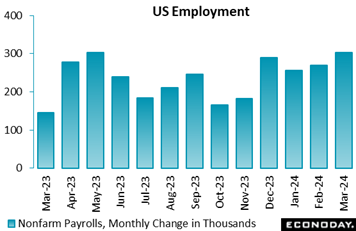 Nonfarm payrolls increased 303,000 in March after a revised 270,000 climb in February and a revised 256,000 in January. The net upward revision was up 22,000. The March increase is well above the consensus of up 200,000 in the Econoday survey of forecasters. Private payrolls rose 232,000 in March with government up 71,000. Nonfarm payrolls increased 303,000 in March after a revised 270,000 climb in February and a revised 256,000 in January. The net upward revision was up 22,000. The March increase is well above the consensus of up 200,000 in the Econoday survey of forecasters. Private payrolls rose 232,000 in March with government up 71,000.
Average hourly earnings rose 0.3 percent month-over-month and were up 4.1 percent year-over-year. The gain versus a year ago is the lowest since up 3.9 percent in June 2021. Nevertheless, if the pace of wage growth is slowing, it remains above the inflation rate.
The unemployment rate tightened by a tenth to 3.8 percent, mostly due to rounding which suggests unemployment is essentially unchanged. March's rate last year was 3.5 percent. The U-6 unemployment rate – the most inclusive rate of unemployment– was unchanged at 7.3 percent. March and February were the highest since 7.3 percent in December 2021. Although unemployment has crept a bit higher in the past year or so, it remains consistent with a tight labor market.
Private goods-producers' payrolls increased 42,000 in March, mainly due to a 39,000 rise in construction while manufacturing payrolls were unchanged and mining and logging were up 3,000. Private service-providers' payrolls rose 190,000 in March with over 2/3 of these jobs from gains of 88,000 gain in education and health services and 49,000 in leisure and hospitality. Government payroll gains mainly reflected hiring of 49,000 at the local level.
March offers yet more data confirming that labor market conditions remain tight and consistent with economic expansion which the FOMC will take into account in setting monetary policy. Even if the inflation data show further progress toward reaching the two percent objective, the strength of the labor market will counsel against moving too quickly to ease monetary policy.
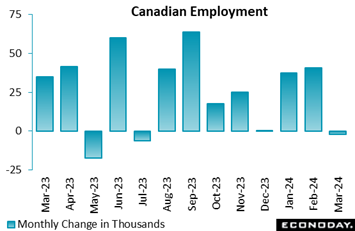 The Canadian economy unexpectedly shed 2,200 jobs in March, while forecasters in an Econoday survey had anticipated employment to rise 25,000. The unemployment rate rose to 6.1 percent from 5.8 percent in February, the highest level since January 2022. The participation rate remained steady at 65.3 percent. Total hours worked were virtually unchanged. The Canadian economy unexpectedly shed 2,200 jobs in March, while forecasters in an Econoday survey had anticipated employment to rise 25,000. The unemployment rate rose to 6.1 percent from 5.8 percent in February, the highest level since January 2022. The participation rate remained steady at 65.3 percent. Total hours worked were virtually unchanged.
The poor results weren't offset by easing wage inflation. To the contrary, average hourly wages edged yet higher to 5.1 percent year-over-year versus 5.0 percent in February.
Both full-time and part-time employment suffered in March, with losses of 700 and 1,600, respectively. The number of employees increased 27,000, with the private sector adding 15,200 jobs and the public sector 11,900. Self-employment, on the other hand, fell 29,300 on the month.
The sector breakdown was a tale of two stories, with goods-producing industries creating 29,900 jobs while services employment fell 32,000.
Within services, accommodation and food was down 26,600, wholesale and retail trade cut 23,100 positions, and professional, scientific and technical services lost 19,900 jobs. On the upside, health care and social assistance rose 39,900, and finance, insurance, real estate, rental and leasing increased 11,000.
Within goods-producing industries, employment increased in four of the five main categories. The largest gains were in construction, with 15,300 jobs created, and manufacturing, with 9,300 jobs. Agriculture was down 2,500.
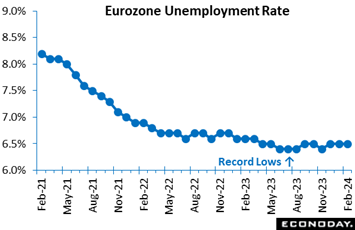 Germany’s labour market lost a little ground in February. Although at 6.5 percent, the jobless rate was unchanged on the month it followed an upward revision to January and masked a 17,000 increase in unemployment to 11.102 million, a 3-month high. The rate was also a tick above the consensus. All that said, the jobs market remains historically very tight. Germany’s labour market lost a little ground in February. Although at 6.5 percent, the jobless rate was unchanged on the month it followed an upward revision to January and masked a 17,000 increase in unemployment to 11.102 million, a 3-month high. The rate was also a tick above the consensus. All that said, the jobs market remains historically very tight.
The steady overall rate reflected no change in Germany (3.2 percent) but concealed falls in France (7.4 after 7.5 percent) and Spain (11.5 after 11.6 percent) and a rise in Italy (7.5 after 7.3 percent).
The ECB will welcome the tentative signs that the Eurozone labour market is finally beginning to cool. However, it will still be concerned that it remains tight enough to support potentially inflationary wage increases. To this end, it will want to see updated wage data before delivering the June cut in rates that financial markets currently fully discount.
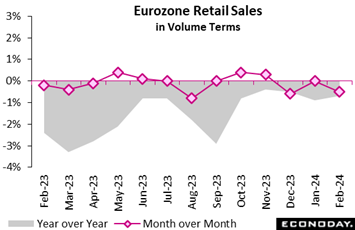 European retailers had a poor February. Sales fell 0.5 percent on the month, more than Econoday’s consensus and following a flat performance at the start of the year. The latest drop means that volumes have not increased since last November and now stand at their lowest level since April 2021. Annual change was minus 0.7 percent, up from minus 0.9 percent in January but only courtesy of positive base effects. European retailers had a poor February. Sales fell 0.5 percent on the month, more than Econoday’s consensus and following a flat performance at the start of the year. The latest drop means that volumes have not increased since last November and now stand at their lowest level since April 2021. Annual change was minus 0.7 percent, up from minus 0.9 percent in January but only courtesy of positive base effects.
February's monthly setback reflected a 0.4 percent decline in purchases of food, drink and tobacco, compounded by a 0.2 percent dip in non-food, ex-auto fuel demand. Auto fuel was also down 1.4 percent.
Regionally, both France (minus 0.3 percent) and, in particular, Germany (minus 1.9 percent) posted contractions but Spain (0.5 percent) reversed at least some of the previous two months' losses.
February's update leaves overall Eurozone sales on course to subtract from first quarter GDP. March will require a 1.8 percent monthly rise to ensure a positive contribution. To this end, consumer confidence seems to be improving but only slowly and remains quite well short of its long-term average. For now, the retail sector looks likely to continue to struggle over at least the near-term.
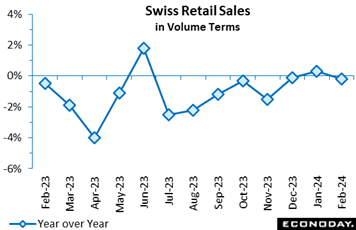 Pulled down by fuel, Swiss retail sales were surprisingly soft in February. However, a 0.1 percent monthly dip followed an upwardly revised 0.8 percent rise in January and was only the second fall since last September. The February report leaves a still rising trend although negative base effects helped to cut annual workday adjusted growth from 0.3 percent to minus 0.2 percent. Pulled down by fuel, Swiss retail sales were surprisingly soft in February. However, a 0.1 percent monthly dip followed an upwardly revised 0.8 percent rise in January and was only the second fall since last September. The February report leaves a still rising trend although negative base effects helped to cut annual workday adjusted growth from 0.3 percent to minus 0.2 percent.
As it is, the monthly headline drop was wholly attributable to auto fuel which decreased 2.9 percent. Purchases of food, drink and tobacco rose a further 0.4 percent while discretionary spending (ex-auto fuel) was up 0.5 percent, its third increase in the last four months.
Accordingly, the underlying picture is probably rather firmer than first appearances might suggest.
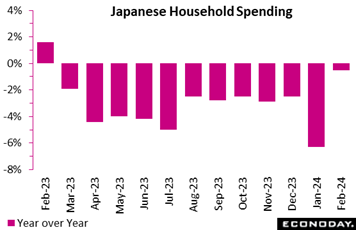 Japan's real household spending posted its 12th straight drop on the year in February as mild weather led to lower costs for heating, but the pace of decrease slowed to a 0.5 percent fall from a 6.3 percent slump in January, backed by the leap-year effect. Without this extra day of consumption, spending would have been down by a deeper 2.7 percent. Japan's real household spending posted its 12th straight drop on the year in February as mild weather led to lower costs for heating, but the pace of decrease slowed to a 0.5 percent fall from a 6.3 percent slump in January, backed by the leap-year effect. Without this extra day of consumption, spending would have been down by a deeper 2.7 percent.
Easing but still elevated living costs have kept consumers frugal and new car purchases remained weak due to suspended vehicle output over a safety test scandal. Partly offsetting lower spending were higher tuition fees and medical costs but these factors are also squeezing households.
The core measure of real average household spending (excluding housing, motor vehicles and remittance), a key indicator used in GDP calculation, fell 0.8 percent on the year in February, similar to the 0.5 percent dip in overall spending.
Average real income of households with salaried workers posted a 17th straight year-over-year drop, down 2.5 percent in January (but up 0.7 percent in nominal terms), after a 2.1 percent fall in January (up a nominal 0.3 percent). The main bread-earner's real income in the average household marked the 14th straight year-over-year drop while the average spouse real income posted the first rise in 10 months.
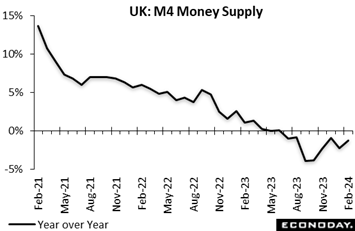 Broad money in the UK expanded 0.5 percent on the month in February following a flat performance in January. As a result, annual growth climbed from minus 2.2 percent to minus 1.2 percent, although this was still its eighth successive sub-zero print. Annualised growth over the last three months was a solid 4.0 percent, its strongest reading since October 2022. However, M4 lending declined 0.9 percent, its first fall since last September and reducing its 3-monthly rate to minus 2.8 percent. Broad money in the UK expanded 0.5 percent on the month in February following a flat performance in January. As a result, annual growth climbed from minus 2.2 percent to minus 1.2 percent, although this was still its eighth successive sub-zero print. Annualised growth over the last three months was a solid 4.0 percent, its strongest reading since October 2022. However, M4 lending declined 0.9 percent, its first fall since last September and reducing its 3-monthly rate to minus 2.8 percent.
Excluding intermediate other financial institutions, M4 rose 0.3 percent versus January and was 1.1 percent lower on the year. Similarly-adjusted lending contracted 0.7 percent and was up 0.3 percent respectively.
Elsewhere the financial data were also mixed. In the housing market, mortgage approvals climbed from an upwardly revised 56,087 to 60,383, their third straight gain and their highest level since September 2022. Mortgage lending was £1.51 billion, up from a £1.07 billion repayment. However, overall consumer credit still eased from £1.77 billion to £1.373 billion.
In sum, falling mortgage rates are providing a boost to the housing market but consumers in general remain cautious about borrowing ahead of a possible cut in Bank Rate in June.
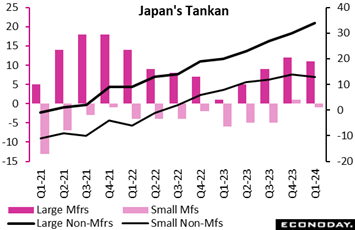 The Bank of Japan's quarterly Tankan business survey showed confidence among manufacturers falling slightly in March as suspended vehicle output over a safety test scandal triggered a widespread slump in overall production. The index for large manufacturers posted its first drop in four quarters, slipping to 11 from 13 in December while the index for small manufacturers slipped 2 points to minus 1. The Bank of Japan's quarterly Tankan business survey showed confidence among manufacturers falling slightly in March as suspended vehicle output over a safety test scandal triggered a widespread slump in overall production. The index for large manufacturers posted its first drop in four quarters, slipping to 11 from 13 in December while the index for small manufacturers slipped 2 points to minus 1.
Sentiment among non-manufacturers, in contrast, remains very strong reflecting pent-up demand for traveling and eating out. The large non-manufacturers index rose another 2 points to 34 for the highest reading in 33 years.
Large firms projected their plans for business investment in equipment would rise a combined 11.5 percent on the year in fiscal 2023 ending in March 2024, revised down from the 13.2 percent increase planned in the December survey. Their plans for fiscal 2024 are a 4.0 percent increase over the previous year, higher than Econoday’s consensus for 3.0 percent rise. Smaller firms largely maintained their combined capital spending plans at an 8.4 percent increase in fiscal 2023. Capex plans are generally supported by demand for automation amid labor shortages.
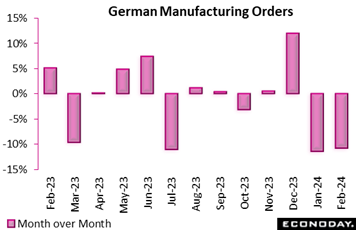 Having slumped in January after booming in December, manufacturing orders were little changed in February. A 0.2 percent monthly rise was well short of the market consensus and left annual growth deep in negative territory at minus 10.7 percent. Having slumped in January after booming in December, manufacturing orders were little changed in February. A 0.2 percent monthly rise was well short of the market consensus and left annual growth deep in negative territory at minus 10.7 percent.
The domestic market was rather stronger, posting a 1.5 percent monthly increase although this still left a nearly 11 percent annual decline. By contrast, orders from overseas fell again, this time by 0.7 percent within which the Eurozone was off some 13.1 percent. Overall orders for capital goods decreased 0.6 percent but intermediates increased 1.0 percent and consumer goods 2.2 percent.
Recent sharp swings in so-called large-scale orders have led to heightened volatility in the monthly data that clouds the underlying picture of demand. However, as the data currently stand, average aggregate orders in January/February were 4.3 percent below their mean level in the fourth quarter. Absent any revisions, this leaves March needing a monthly rise of at least 13.5 percent just to keep the current quarter flat. In other words, the near-term outlook for industrial production remains weak.
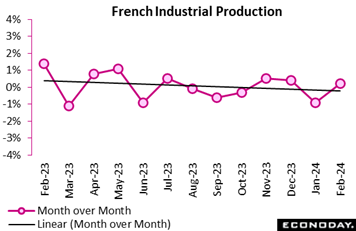 Industrial production in France staged only a partial rebound in February. After a 0.9 percent monthly fall in January, output rose a modest 0.2 percent, undershooting the consensus by 0.4 percentage points and reducing annual growth from 0.9 percent to minus 0.8 percent, its first negative print since last September. Indeed, production was still some 5.6 percent below its pre-Covid level. Industrial production in France staged only a partial rebound in February. After a 0.9 percent monthly fall in January, output rose a modest 0.2 percent, undershooting the consensus by 0.4 percentage points and reducing annual growth from 0.9 percent to minus 0.8 percent, its first negative print since last September. Indeed, production was still some 5.6 percent below its pre-Covid level.
With a 0.9 percent monthly advance, manufacturing fared rather better although this came nowhere close to reversing January's 1.5 percent drop. Machinery and equipment (1.3 percent) and the other manufacturing category (1.2 percent) both had a good month but transport equipment (minus 2.8 percent) was again very weak. Elsewhere, food and drink (1.1 percent) saw solid growth but there were hefty falls in mining and quarrying, energy, water supply and waste management (3.4 percent) and construction (2.1 percent).
February's limited recovery puts the 3-monthly change in industrial production at exactly zero but, revisions aside, leaves March needing a 1.2 percent monthly rise just to keep the first quarter flat. The sector remains weak.
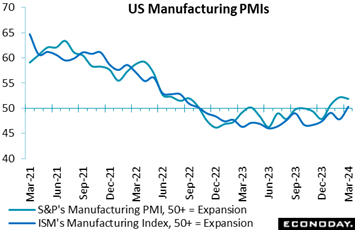 One of the week’s highlights was ISM manufacturing’s break above 50, ending a dismal 17-month run below this expansion-vs-contraction barrier. March’s index rose 2.5 points to a much better-than-expected 50.3 that, however, is only just above 50 to indicate only a marginal month-over-month rise in composite activity. One of the week’s highlights was ISM manufacturing’s break above 50, ending a dismal 17-month run below this expansion-vs-contraction barrier. March’s index rose 2.5 points to a much better-than-expected 50.3 that, however, is only just above 50 to indicate only a marginal month-over-month rise in composite activity.
Yet the ISM is confident that the index is unlikely to fall back below 50, saying demand is in the early stages of recovery. New orders rose 2.2 points to 51.4 while production surged 6.2 points to 54.6. A negative for the Federal Reserve, however, was a 3.3-point rise in prices paid to a 20-month high of 55.3. Employment is a general negative, at 47.5 with the ISM sample continuing to reduce head counts through layoffs – results echoed by March’s employment report where manufacturing payrolls were unchanged after falling 10,000 in February.
The rival PMI manufacturing ended March at 51.9, confirming a third straight month above 50 for this index. New orders in this sample were held down by a flat showing for foreign sales but, relying on back orders, the PMI sample, like the ISM’s, increased its pace of production in the month.
Also pointing to strength were definitive numbers for US factory orders, up 1.4 percent in data for February and showing solid breadth across categories. Excluding transportation, February orders jumped an outstanding 1.1 percent. Manufacturing is traditionally considered a leading barometer for total economic change, and emerging momentum in this sector won't be overlooked by the Fed policymakers in their deliberations to cut or not to cut interest rates.
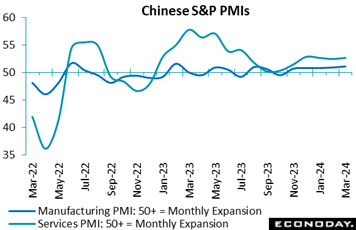 S&P’s PMI composite index for China increased to 52.7 in March from 52.5 in February, indicating that China's economy may be gaining momentum. The services component rose from February’s 52.5 to 52.7, while the manufacturing component rose from 50.9 to 51.1 in March. Official PMI data published by CFLP also showed strength, showing a return to expansion in the manufacturing sector and somewhat stronger growth in the non-manufacturing sector as well. S&P’s PMI composite index for China increased to 52.7 in March from 52.5 in February, indicating that China's economy may be gaining momentum. The services component rose from February’s 52.5 to 52.7, while the manufacturing component rose from 50.9 to 51.1 in March. Official PMI data published by CFLP also showed strength, showing a return to expansion in the manufacturing sector and somewhat stronger growth in the non-manufacturing sector as well.
Respondents to S&P’s services survey reported stronger growth in output, new orders, and new export orders in March, with the latter growing at the fastest pace in nine months. Payrolls fell marginally, largely driven by resignations and redundancies, while the survey's measure of confidence increased for the first time in three months. Respondents also reported weaker growth in input costs and a smaller increase in selling prices.
Output for manufacturers grew in March at the fastest pace since May 2023, with new orders and new export orders rising at a faster pace. Payrolls, however, were reported to have been cut for the seventh consecutive month, with respondents citing a focus on efforts to cut costs. The survey's measure of business confidence rose for a third consecutive month to its highest level since April 2023. Price pressures moderated further in March with the survey showing the first decline in input costs since July 2023 and a reduction in selling prices for the third month in a row.
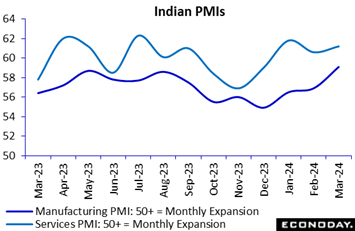 No country can match India’s growth pace. India's services PMI strengthened further in March increasing from 60.6 to 61.2 in February; India’s manufacturing PMI advanced from 56.9 to 59.1 its highest level since 2008. No country can match India’s growth pace. India's services PMI strengthened further in March increasing from 60.6 to 61.2 in February; India’s manufacturing PMI advanced from 56.9 to 59.1 its highest level since 2008.
The services sample reported a stronger pace for new orders in March, new export orders, output and employment. Respondents also reported bigger increases in input costs and selling prices, with the latter increasing at the fastest pace since 2017.
Manufacturers reported stronger growth across key measures with the exception of business confidence which fell on inflation concerns. Respondents reported input costs increased at the fastest pace in five months but very few raised their selling prices which rose at the weakest pace in more than a year.
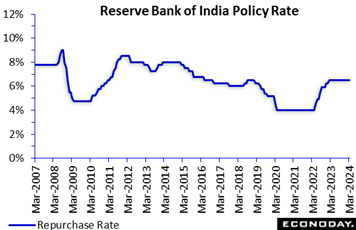 Recent activity data, such as the PMIs, have generally shown ongoing strength in economic conditions. But the trend hasn’t convinced the Reserve Bank of India that a rate hike is needed, at least yet, as the bank on Friday left its repurchase rate unchanged at 6.50 percent, in line with the consensus forecast. This rate has now been on hold since February 2023 after it was earlier increased by a cumulative 250 basis points beginning in May 2022. Recent CPI data have shown headline inflation moderating from 5.69 percent in December to 5.10 percent in January and 5.09 percent in February, closer but still above the four percent mid-point of the RBI's two to six percent target range. Recent activity data, such as the PMIs, have generally shown ongoing strength in economic conditions. But the trend hasn’t convinced the Reserve Bank of India that a rate hike is needed, at least yet, as the bank on Friday left its repurchase rate unchanged at 6.50 percent, in line with the consensus forecast. This rate has now been on hold since February 2023 after it was earlier increased by a cumulative 250 basis points beginning in May 2022. Recent CPI data have shown headline inflation moderating from 5.69 percent in December to 5.10 percent in January and 5.09 percent in February, closer but still above the four percent mid-point of the RBI's two to six percent target range.
In their statement, RBI officials said they expect inflation to fall to around 4.5 percent in coming quarters, but stressed that "the path of disinflation needs to be sustained". Officials expect growth to remain supported by investment demand and an improved outlook for consumer spending.
The decision to leave rates on hold again indicates that officials remain confident that policy tightening implemented previously will return headline inflation to its target range in due course. They stressed, however, that "monetary policy must continue to be actively disinflationary", suggesting that upside risks to the inflation outlook will remain a primary focus of discussion at upcoming meetings.
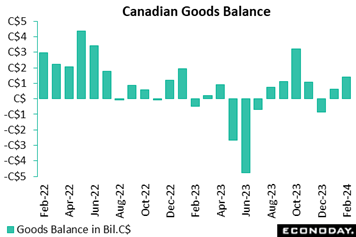 Canada's goods surplus widened much more than expected in February amid rebounding trade activity, as it reached C$1.392 billion, up a surplus of C$608 million in January. Exports grew 5.8 percent, the largest expansion since August 2023. The advance more than offset January's 1.2 percent drop and outpaced a 4.6 percent increase in imports, which had contracted 3.1 percent in January. Canada's goods surplus widened much more than expected in February amid rebounding trade activity, as it reached C$1.392 billion, up a surplus of C$608 million in January. Exports grew 5.8 percent, the largest expansion since August 2023. The advance more than offset January's 1.2 percent drop and outpaced a 4.6 percent increase in imports, which had contracted 3.1 percent in January.
In real terms, exports rose 6.2 percent and imports 4.1 percent, showing that higher trade figures were led by stronger volumes.
Gains in exports were widespread across 9 of 11 sectors, led by a nominal 31.1 percent surge in metal and non-metallic mineral products. Unwrought gold, silver, and platinum group metals and their alloys – mostly unwrought gold – jumped 68.8 percent. More than half of total export growth owed to gains in unwrought gold, without which total exports would have been up 2.8 percent instead of 5.8 percent. Statistics Canada cited increased high-value shipments of refined gold and transfers of gold assets in the banking sector. These developments occurred amid a sharp appreciation in gold prices at the end of February.
Elsewhere, exports of farm, fishing and intermediate food products rose 9.7 percent, the largest increase since July 2023. Motor vehicles and parts were up 3.8 percent, energy up 0.4 percent and consumer goods 3.8 percent.
On the import front, gains were also broad based across 10 of 11 sectors, metal and non-metallic mineral products being the only category to contract, by 0.6 percent. Imports of electronic and electrical equipment and parts increased 9.7 percent to a record C$7.6 billion. Consumer goods were up 3.3 percent, machinery, equipment and parts 3.6 percent, and energy 10.2 percent.
Regionally, the surplus with the US widened to C$9.1 billion in February from C$8.8 billion in January. Meanwhile, Canada's trade deficit with countries other than the US narrowed to C$7.7 billion from C$8.2 billion.
In services, exports rebounded 1.9 percent on the month while imports rose a further 0.8 percent. The combined trade and services balance with the world went to a surplus of C$0.4 billion from a deficit of C$0.6 billion.
Global data continue to exceed forecasts at 21 on the Relative Performance Index (RPI) and 26 less prices (RPI-P) to indicate tangible outperformance especially for the real economy. These results are a bit firmer than the prior week’s respective RPI and RPI-P scores of 16 and 21.
China is now the center of the RPI’s strength, at 79 overall and 75 for the RPI-P. There has been some speculation that the People’s Bank of China is considering introducing quantitative easing to stimulate demand but on current trends it might not be needed.
Canada also continues to exceed forecasts though March’s disappointing employment report pulled the RPI lower to 8, down from the prior week’s 23 though when excluding what have been soft inflation data, the RPI-P rises to 26. With inflation undershooting expectations and employment data softening, a rate cut by Bank of Canada may be in play.
However much the US employment beat forecasts, the rolling off of even stronger prior results finds this country’s RPI and RPI-P both at minus 4, very near the zero line to indicate that recent US data are coming within Econoday’s forecast ranges. Nevertheless, the unrelenting strength of the US labor market is not building the case for rate cuts.
In the Eurozone, another downside surprise on inflation in March helped to trim the RPI to minus 8 and underpinned speculation about a cut in the ECB’s key interest rates in June. However, the unexpected weakness of prices is not mirrored in the real economy for which an RPI-P of 11 indicates a degree of outperformance. As such, the chances of the central bank lowering benchmark rates in the coming remain very low.
Similarly in the UK a mixed batch of data leaves the RPI (minus 4) just in negative surprise territory but the RPI-P (15) showing real economic activity running slightly ahead of forecasts. Overall, the latest readings leave open the door to a cut in Bank Rate but add no extra pressure for a move before June.
In Switzerland, surprisingly weak March inflation data helped to ensure that the recent period of modest economic outperformance was very short-lived. At minus 29 and minus 15 respectively, both the RPI and the RPI-P show activity once again falling quite well short of forecasts, in turn feeding speculation about another cut in the SNB’s policy rate later this quarter.
In Japan, the RPI (minus 7) and RPI-P (minus 5) are just in negative surprise territory. Both gauges have been mainly sub-zero since late January, arguing against any aggressive Bank of Japan tightening and, to the concern of the authorities, adding to downside pressure on the yen. With USD/JPY testing the 152 level, there is a growing chance of renewed intervention.
**Contributing to this article were Jeremy Hawkins, Brian Jackson, Mace News, Max Sato, and Theresa Sheehan
With inflation cooling and economic activity no worse than steady, wait and see is the coming week’s policy directive. Forecasters expect no change at a run of central bank meetings: Reserve Bank of New Zealand and Bank of Canada both on Wednesday, the European Central Bank on Thursday, and the Bank of Korea on Friday. Federal Reserve minutes on Wednesday will detail conditions from three weeks ago when policymakers were cautious in their policy outlook. Data since have not changed the overall picture.
The week’s biggest data release will be US consumer prices on Wednesday which are not expected to show much cooling. If upward price pressure on food prices has abated, energy prices – particularly for gasoline – continued to rise in March. And more important than ever will be service prices that, despite past rate hikes, have continued to be a steady source of upward pressure.
Industrial production from Germany on Monday is not expected to improve, while monthly GDP data from the UK on Friday is expected to be mixed. Chinese inflation pressures in data for Thursday are expected to remain dormant, while Indian inflation data on Friday are expected to remain well above target.
German Industrial Production for February (Mon 0800 CEST; Mon 0600 GMT; Mon 0200 EDT)
Consensus Forecast, Month over Month: 0.3%
Consensus Forecast, Year over Year: -7.1%
Industrial production in February is expected to rebound a further 0.3 percent on the month after rising a better-than-expected 1.0 percent in January. Yet the year-over-year comparison is seen sinking to minus 7.1 percent following January’s 5.4 percent contraction.
German Merchandise Trade for February (Mon 0800 CEST; Mon 0700 GMT; Mon 0200 EDT)
Consensus Forecast, Balance: +€26.0 billion
February’s goods balance is expected to narrow to a €26.0 billion surplus versus a larger-than-expected surplus of €27.5 billion in a positive January report that saw strong gains for imports and even stronger gains for exports.
Taiwan CPI for March (Tue 1600 CST; Tue 0800 GMT; Tue 0400 EDT)
Consensus, Year over Year: 2.5%
Consumer prices in March are expected to ease to 2.5 percent versus a 3.08 percent year-over-year rate in February that, inflated by timing of the lunar holidays, was up from January’s 1.79 percent.
Reserve Bank of New Zealand Announcement (Wed 1400 NZST; Wed 0200 GMT; Tue 2200 EDT)
Consensus Forecast, Change: 0 basis points
Consensus Forecast, Level: 5.50%
Though inflation has remained stubbornly high, at 4.7 percent in the fourth quarter, the Reserve Bank of New Zealand has been keeping policy steady. Consensus for April’s meeting is once again no change for the policy rate at 5.50 percent.
US CPI for March (Wed 1230 GMT; Wed 0830 EDT)
Consensus Forecast, Month over Month: 0.3%
Consensus Forecast, Year over Year: 3.5%
US CPI Core, Less Food & Energy
Consensus Forecast, Month over Month: 0.3%
Consensus Forecast, Year over Year: 3.7%
Consumer prices have come in on the high end of Econoday’s consensus ranges the past three reports. Core prices in March are expected to slow to a monthly increase of 0.3 percent versus 0.4 percent in February. Overall prices are also expected to rise 0.3 after also increasing 0.4 percent in February. Annual rates, which in February were 3.2 percent overall and 3.8 percent for the core, are expected at 3.5 and 3.7 percent respectively.
Bank of Canada Announcement (Wed 0945 EDT; Wed 1345 GMT)
Consensus Forecast, Change: 0 basis points
Consensus Forecast, Level: 5.00%
Given mostly improving economic growth and still high rates of inflation, the Bank of Canada is expected to hold rates unchanged for a sixth straight meeting.
Chinese Merchandise Trade Balance for March (Estimated for Thursday, release time not set)
Consensus Forecast: US$71.1 billion
Consensus Forecast: Imports - Y/Y: 1.3%
Consensus Forecast: Exports - Y/Y: -1.5%
China's trade surplus for March is expected to come in at a sizable US$71.1 billion versus a larger-than-expected surplus of US$125.2 billion in the combined months of January and February in a report that saw a 7.1 percent year-over-year jump in exports.
Chinese CPI for March (Thu 0930 CST; Thu 0130 GMT; Wed 2130 EDT)
Consensus Forecast, Year over Year: 0.5%
April’s year-over-year rate is expected to edge lower to 0.5 percent versus March’s 0.7 percent. China’s CPI last peaked in January last year at 2.1 percent.
Chinese PPI for March (Thu 0930 CST; Thu 0130 GMT; Wed 2130 EDT)
Consensus Forecast, Year over Year: -2.8%
Producer prices have been in long annual contraction. March’s consensus is minus 2.8 percent versus February’s annual contraction of 2.7 percent.
Italian Industrial Production for February (Thu 1000 CEST; Thu 0900 GMT; Thu 0400 EDT)
Consensus Forecast, Month over Month: 0.5%
Production in February is expected to rise 0.5 percent on the month following an unexpectedly weak 1.2 percent decline in January.
European Central Bank Announcement (Thu 1215 GMT; Thu 1415 CEST; Thu 0815 EST)
Consensus Forecast, Change: 0 basis points
Consensus Forecast, Refi Rate: 4.50%
Inflation may be cooling but services inflation remains sticky. The European Central Bank is not expected to cut rates at its April meeting.
Bank of Korea Announcement (Fri 1000 KST; Fri 0100 GMT; Thu 2100 EDT)
Consensus Forecast, Change: 0 basis points
Consensus Forecast, Level: 3.50%
Reflecting moderation in consumer prices, the Bank of Korea has kept policy unchanged since early 2023 which it is expected to do once again at its April meeting.
UK GDP for February (Fri 0700 BST; Fri 0600 GMT; Fri 0200 EDT)
Consensus Forecast, Month over Month: 0.1%
Consensus Forecast, 3-Months over 3-Months: 0.1%
GDP in the month of February is expected to rise 0.1 percent versus as-expected 0.2 percent expansion in January that saw gains for both wholesale and retail.
UK Industrial Production for February (Fri 0700 BST; Fri 0600 GMT; Fri 0200 EDT)
Consensus Forecast, Month over Month: 0.6%
Consensus Forecast, Year-over-Year: 0.0%
Manufacturing Output
Consensus Forecast, Month over Month: 0.0%
Consensus Forecast, Year-over-Year: 1.9%
Industrial production is expected to rebound 0.6 percent in February after slipping 0.2 percent in January following solid gains in the prior two months. Manufacturing output is expected to come in unchanged for a second straight month.
Indian CPI for March (Fri 1730 IST; Fri 1200 GMT; Fri 0800 EDT)
Consensus Forecast, Year over Year: 5.0%
Consumer prices are expected to edge fractionally lower to 5.0 percent on the year in March versus 5.09 and 5.10 percent in the two prior months.
Indian Industrial Production for February (Fri 1730 IST; Fri 1200 GMT; Fri 0800 EDT)
Consensus Forecast, Year over Year: 6.0%
Year-over-year industrial production growth is expected to rise 6.0 percent in February versus 3.8 percent growth in both January and December.
US Consumer Sentiment Index, Preliminary April (Fri 1000 EDT; Fri 1400 GMT)
Consensus Forecast: 79.0
After ratcheting to multi-year highs this year, consumer sentiment in the first indication for April is expected to hold steady at 79.0 versus 79.4 in March.
|
