|
Diverging trends in the global economy are becoming starker: China and Europe continue to struggle while the UK and US continue to strengthen. Market rates in the US are rising fast as 30-year mortgages jumped 12 basis points from the prior week to 7.13 percent as tracked by the Mortgage Bankers Association. Federal Reserve officials spent the week pushing back rate-cut expectations, headlined by Jerome Powell who cited “lack of progress” in achieving the bank’s inflation goals and underscored by New York Fed President John Williams who, speaking in response to questions, declined to rule out an actual rate hike. And another rate hike is the expected next move by the Bank of Japan as it battles its own divergent mix, that of wage inflation and the country’s peculiar nemesis – deflation.
 Consumer inflation in Japan moderated in all three key measures in March in light of easing food and durable goods markups, offsetting slight upward pressure from a slower pace of decline in energy costs. Hotel fees continued to post a double-digit percentage gain amid a sharp rise in the number of visitors from overseas but the pace of increase also slowed. Consumer inflation in Japan moderated in all three key measures in March in light of easing food and durable goods markups, offsetting slight upward pressure from a slower pace of decline in energy costs. Hotel fees continued to post a double-digit percentage gain amid a sharp rise in the number of visitors from overseas but the pace of increase also slowed.
The core CPI (excluding fresh food prices), closely watched by the Bank of Japan for its policy stance, slowed to an as-expected 2.6 percent on the year after a 2.8 percent gain in February. The increase in the total CPI unexpectedly eased to 2.7 percent from 2.8 percent despite faster fresh food price rises, coming in above Econoday’s median forecast of 2.9 percent.
Underlying inflation measured by the core-core CPI (excluding fresh food and energy) decelerated to a 16-month low of 2.9 percent from 3.2 percent, just below the median forecast of a 3.0 percent rise. The annual rate for this narrow indicator had been at or above 3.0 percent from December 2022 until February 2024.
Service costs have seen gradual upward pressures as many firms are offering higher wages to secure workers amid widespread labor shortages but goods prices jumped last month due to a much smaller drop in utility charges. Service prices excluding owners' equivalent rent rose 2.9 percent on the year in March following a 3.1 percent rise in February. Goods prices excluding fresh food gained 3.1 percent after a 3.4 percent increase; this was much higher than the 2.2 percent rise seen in March 2023. Goods prices excluding fresh food gained 3.1 percent after a 3.4 percent increase and were down from 4.8 percent a year earlier.
The Bank of Japan is expected to maintain its policy stance at its meeting in the coming week. At its March meeting, the bank decided in a majority vote to end its seven-year-old yield curve control framework and lift the minus 0.1 percent overnight interest rate target to a range of zero to 0.1 percent, its first rate hike in 17 years in reaction to a jump in wage pressures and its gradual process of normalizing monetary policy.
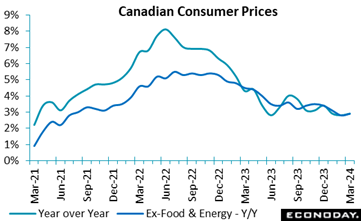 Consumer prices in Canada rose 0.6 percent in March from February and 2.9 year-over-year, sightly less than expectations of 0.7 percent and 3.0 percent, respectively, in Econoday’s survey. Still, the monthly gain hasn't been this large since July 2023. Consumer prices in Canada rose 0.6 percent in March from February and 2.9 year-over-year, sightly less than expectations of 0.7 percent and 3.0 percent, respectively, in Econoday’s survey. Still, the monthly gain hasn't been this large since July 2023.
The Bank of Canada's own core measures of inflation came down to 2.9 percent year-over-year in March on average, from 3.1 percent in February and 3.3 percent in January. Excluding food and energy, the CPI rose 0.7 percent on the month, up from 0.2 percent in February, and increased 2.9 percent year-over-year, up from 2.8 percent the previous month.
Food was down 0.2 percent on the month and up 3.0 percent year-over-year, and energy rose 2.1 percent and 2.8 percent, respectively. Gasoline was among the top upward contributors to inflation both on a monthly and yearly basis, up 4.9 percent on the month and 4.5 percent year-over-year.
Shelter was also a top contributor: rent increased 0.9 percent from February, and mortgage interest costs 1.2 percent, for 12-month gains of 8.5 percent and 25.4 percent respectively. Overall shelter prices increased 0.4 percent on the month and 6.5 percent from a year earlier.
Overall, services prices appreciated 0.7 percent on the month and 4.5 percent year-over-year, while goods prices were up 0.5 percent and 1.1 percent. This separation between services and goods is evident across many global CPI reports.
The 2.9 percent headline inflation rate brought the first-quarter average to 2.9 percent from 3.2 percent in the fourth quarter of 2023, roughly in line with the Bank of Canada's projection of 2.8 percent in its April Monetary Policy Report. The central bank projects the average to remain steady at 2.9 percent in the second quarter. In its MPR, the BoC pointed out that the easing in inflation has been broad-based with a declining share of prices rising by more than 3 percent. It also highlighted signs of softening wage growth with the range of measures declining to 3.5 percent to 4.5 percent from 4 percent to 5 percent. That said, productivity would need to increase significantly for wage growth to be compatible with the bank’s two percent inflation target.
While March's headline report was slightly better than expected, the move toward the two percent target has been slowing, with the CPI 12-month increase of 2.9 percent no lower than it was in January. Lack of progress may well call for more wait and see from the BoC.
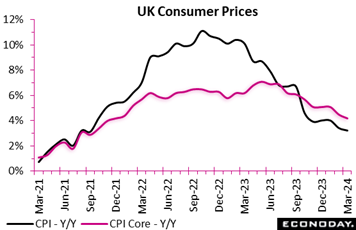 Inflation in the UK fell again but prices in March were still a little firmer than expected. A 0.6 percent monthly rise was small enough to reduce the headline rate from 3.4 percent to 3.2 percent, its least elevated reading since September 2021 but 0.1 percentage point more than the market consensus. The gap with the two percent target duly narrowed to 1.2 percentage points. Core prices similarly increased 0.6 percent versus February to reduce underlying yearly inflation from 4.5 percent to 4.2 percent, matching its lowest print since November 2021. Overall goods inflation declined from 1.1 percent to just 0.8 percent but its services counterpart dipped just a tick to 6.0 percent. Inflation in the UK fell again but prices in March were still a little firmer than expected. A 0.6 percent monthly rise was small enough to reduce the headline rate from 3.4 percent to 3.2 percent, its least elevated reading since September 2021 but 0.1 percentage point more than the market consensus. The gap with the two percent target duly narrowed to 1.2 percentage points. Core prices similarly increased 0.6 percent versus February to reduce underlying yearly inflation from 4.5 percent to 4.2 percent, matching its lowest print since November 2021. Overall goods inflation declined from 1.1 percent to just 0.8 percent but its services counterpart dipped just a tick to 6.0 percent.
The main downward contribution to the change in the annual headline rate came from food and soft drink where inflation fell from 5.0 percent to 4.0 percent. Clothing and footwear (also 4.0 percent after 5.0 percent) as well as furniture and household goods (minus 0.9 percent after 0.0 percent) similarly weighed. Upside pressure came mainly from household services (minus 1.6 percent after minus 1.7 percent) and communication (7.5 percent after 5.6 percent).
Largely due to one-off effects, the Bank of England expects inflation to dip below 2 percent this quarter before rising again over the second half of the year. As such, the latest deceleration is unlikely to come as any real surprise and should not be expected to bring forward any cut in Bank Rate. Indeed, inflation in services remains a real problem.
 The UK’s February/March employment report shows the labour market taking another step in the right direction. Claimant count unemployment rose 10,900 on the month in March, somewhat less than expected and following a 4,100 increase in February. The unemployment rate again held steady at a historically low 4.0 percent. The UK’s February/March employment report shows the labour market taking another step in the right direction. Claimant count unemployment rose 10,900 on the month in March, somewhat less than expected and following a 4,100 increase in February. The unemployment rate again held steady at a historically low 4.0 percent.
Meantime, the updated ILO data showed the number of people out of work climbing 85,000 in the three months to February. This is the largest increase since May-July 2023 and steep enough to lift the jobless rate from an upwardly revised 4.0 percent to 4.2 percent, a couple of ticks above expectations and also its highest print since the three months ending July last year. Employment painted a similar picture, dropping a further 156,000 over the same period for its worst performance since June-August 2023 and reducing the employment rate to 74.5 percent, the lowest reading since March-May 2021. More up to date, the payroll data also showed a 67,000 decrease on the month in March, the sharpest fall since November 2020, while vacancies extended their downtrend with a 13,000 decrease to 916,000.
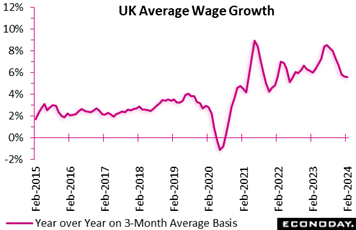
Wage developments, however, were more mixed. At a 5.6 percent rate, annual growth in the three months to February was only unchanged, the first time it has not fallen since the three months to July last year and a little firmer than forecast. By contrast, on the same basis, regular earnings dipped a tick to 6.0 percent, their softest reading since the third quarter of 2022. That said, both measures are still uncomfortably high.
In sum, the new report shows some further loosening in overall labour market conditions and a further but very limited easing in wage pressures. Still, in line with last month's results, the labour market remains very tight and earnings too high to accommodate the two percent inflation target without a marked improvement in productivity.
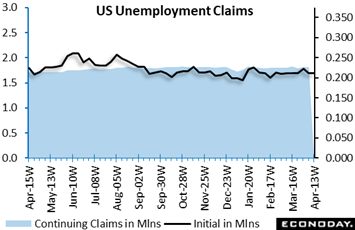 For a fifth time in the last six weeks, initial US jobless claims came in at a seasonally adjusted 212,000; the four-week average held at 214,500 for a third straight week. Continuing claims were little changed at 1.812 million in lagging data for the April 6 week, up a slight 2,000 from the previous week. The insured rate of unemployment (for those covered by unemployment insurance) remained steady at 1.2 percent, where it has been for over a year! The steadiness of these results focuses attention on the apparent accuracy of the Department of Labor’s seasonal adjustments but more materially are pointing to yet another month of outstanding growth in nonfarm payrolls. For a fifth time in the last six weeks, initial US jobless claims came in at a seasonally adjusted 212,000; the four-week average held at 214,500 for a third straight week. Continuing claims were little changed at 1.812 million in lagging data for the April 6 week, up a slight 2,000 from the previous week. The insured rate of unemployment (for those covered by unemployment insurance) remained steady at 1.2 percent, where it has been for over a year! The steadiness of these results focuses attention on the apparent accuracy of the Department of Labor’s seasonal adjustments but more materially are pointing to yet another month of outstanding growth in nonfarm payrolls.
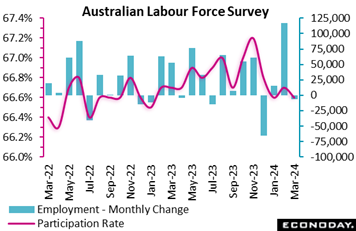 Labour market conditions in Australia weakened moderately in March, with employment falling after two consecutive increases, the unemployment rate picking up slightly, and the participation rate falling slightly. Nevertheless, labour market conditions remain relatively tight and March's data will likely do little to shift the focus of the Reserve Bank of Australia from the inflation outlook or strengthen the case for any easing in policy in the near-term. Labour market conditions in Australia weakened moderately in March, with employment falling after two consecutive increases, the unemployment rate picking up slightly, and the participation rate falling slightly. Nevertheless, labour market conditions remain relatively tight and March's data will likely do little to shift the focus of the Reserve Bank of Australia from the inflation outlook or strengthen the case for any easing in policy in the near-term.
The number of employed persons in Australia fell by 6,600 in March after jumping by 116,500 in February. Econoday’s consensus forecast was for an increase of 5,000. Full-time employment increased by 27,900 after a previous increase of 78,200, but this was offset by a fall in part-time employment of 34,500 after a previous increase of 38,300. Hours worked increased 0.9 percent on the month after surging 2.8 percent previously.
The unemployment rate rose from 3.7 percent in February to 3.8 percent in March. The participation rate fell slightly from 66.7 percent to 66.6 percent, remaining close to record highs.
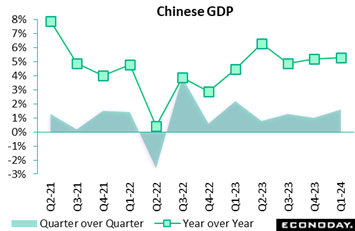 China's GDP rose 1.6 percent on the quarter in the three months to March, strengthening from growth of 1.0 percent in the three months to December, with year-over-year growth picking up slightly from 5.2 percent to 5.3 percent. This was stronger than the consensus forecast for quarter-over-quarter growth of 1.5 percent and year-over-year growth of 4.9 percent. Officials characterized GDP along with monthly data for March which were more mixed as showing that "the national economy continued the good momentum of rebound" and indicated that they see the current policy stance as appropriate. Yet officials also warned that "the external environment is becoming more complex, severe and uncertain, and the foundation for stable and sound economic growth is not solid yet". China's GDP rose 1.6 percent on the quarter in the three months to March, strengthening from growth of 1.0 percent in the three months to December, with year-over-year growth picking up slightly from 5.2 percent to 5.3 percent. This was stronger than the consensus forecast for quarter-over-quarter growth of 1.5 percent and year-over-year growth of 4.9 percent. Officials characterized GDP along with monthly data for March which were more mixed as showing that "the national economy continued the good momentum of rebound" and indicated that they see the current policy stance as appropriate. Yet officials also warned that "the external environment is becoming more complex, severe and uncertain, and the foundation for stable and sound economic growth is not solid yet".
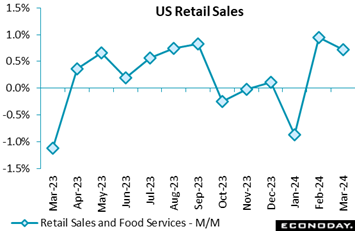 US retail and food services sales rose 0.7 percent in March after a sizeable upward revision to a 0.9 percent gain in February. The increase was well above the consensus of up 0.4 percent in the Econoday survey. Although there was some drag from a 0.7 percent decline in motor vehicle sales, there were more than enough gains elsewhere to make for a strong report. US retail and food services sales rose 0.7 percent in March after a sizeable upward revision to a 0.9 percent gain in February. The increase was well above the consensus of up 0.4 percent in the Econoday survey. Although there was some drag from a 0.7 percent decline in motor vehicle sales, there were more than enough gains elsewhere to make for a strong report.
Excluding motor vehicles, sales jumped 1.1 percent and followed a higher revised 0.6 percent gain in February. March’s increase was more than double the 0.5 percent consensus. Sales excluding motor vehicles and gasoline rose 1.0 percent versus a higher revised 0.5 percent gain in February. Sales at gasoline stations rose 2.1 percent in March and likely reflect both higher prices and higher volumes during a busy travel period with spring break at schools and the Easter observance.
While sales declined 0.9 percent in January, the substantial upward revisions in February and solid overall performance in March suggest that personal consumption expenditures for first quarter GDP will maintain the momentum that has kept US economic growth above expectations for more than a year.
In addition to the hefty increase in gasoline sales which accounted for 7.7 percent of the dollar value of retail, there was a gain of 2.7 percent in nonstore retailers which accounted for 17.3 percent of all retail spending in March. Sales at general merchandise stores rose 1.1 percent and had a 10.6 percent share of the total. Spending at restaurants and bars was up 0.4 percent and accounted for 13.2 percent of March sales.
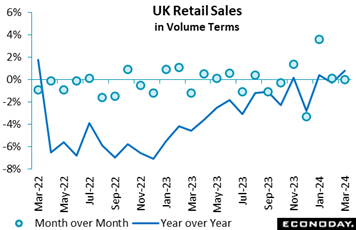 UK retail sales were on the soft side of expectations at quarter-end. Although February's monthly change was revised up a tick, March saw only a flat performance that undershot Econoday’s consensus by 0.3 percentage points. This was the first month in 2024 that volumes have not risen. Even so, the latest outturn was still firm enough to boost annual growth from minus 0.3 percent to 0.8 percent, its highest reading since March 2022. UK retail sales were on the soft side of expectations at quarter-end. Although February's monthly change was revised up a tick, March saw only a flat performance that undershot Econoday’s consensus by 0.3 percentage points. This was the first month in 2024 that volumes have not risen. Even so, the latest outturn was still firm enough to boost annual growth from minus 0.3 percent to 0.8 percent, its highest reading since March 2022.
Excluding auto fuel, the picture was rather weaker with purchases down 0.3 percent versus February and up 0.4 percent on the year.
The stable overall monthly performance was attributable to a 0.7 percent fall in food offset by gains in both non-food, ex-auto demand (0.5 percent) and auto fuel (3.2 percent). Household goods (2.4 percent) and the other stores category (1.8 percent) enjoyed a very strong month but non-specialised stores (minus 3.8 percent) were particularly weak alongside non-store retailing (minus 1.5 percent). In line with February, very wet weather may have had a negative impact.
March's update puts first-quarter total volume sales fully 1.9 percent above their fourth quarter level (ex-auto fuel up 1.6 percent) ensuring a tidy positive contribution from the sector to GDP growth. The resilience of household spending should leave investors anticipating no cut in Bank Rate until much later in the year.
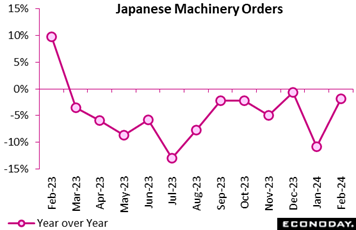 Japanese core machinery orders jumped 7.7 percent on the month in February to a 13-month high of ¥886.8 billion on continued solid demand for computers, recovering from January's 1.7 percent slump that was partly caused by suspended vehicle output over a safety test scandal. The latest figure was much stronger than the median economist forecast of a 0.7 percent rise and was also the highest growth rate since 8.1 percent in January 2023. Orders from manufacturers rose 9.4 percent on the month after a 13.2 percent plunge in January and a 6.0 percent rise in December while those from non-manufacturers posted a second straight increase, up 9.1 percent after a 6.5 percent rise. Japanese core machinery orders jumped 7.7 percent on the month in February to a 13-month high of ¥886.8 billion on continued solid demand for computers, recovering from January's 1.7 percent slump that was partly caused by suspended vehicle output over a safety test scandal. The latest figure was much stronger than the median economist forecast of a 0.7 percent rise and was also the highest growth rate since 8.1 percent in January 2023. Orders from manufacturers rose 9.4 percent on the month after a 13.2 percent plunge in January and a 6.0 percent rise in December while those from non-manufacturers posted a second straight increase, up 9.1 percent after a 6.5 percent rise.
On the year as tracked in the accompanying graph, orders marked their 12th straight decline, down 1.8 percent (consensus was a deeper 5.8 percent drop), following a 10.9 percent slump in the prior month.
The Cabinet Office maintained its assessment after downgrading it for the first time in more than a year last month, saying, "Machinery orders have weakened recently." Previously, orders had been "stalling."
The monthly increase in orders was led by higher demand for computers from electric equipment makers, cranes and conveyors from information and communications equipment makers, communications equipment from telecom firms, and excavators, cranes and tractors from construction firm.
Core orders are predicted by the Cabinet Office to rise 4.9 percent on quarter in the January-March period for the first increase in four quarters, led by a sharp gain in orders from the manufacturing sector and a modest rise from non-manufacturers. After February's data, core orders would still have to rise 4.6 percent on the month in March to hit the forecast, which is uncertain. The forecast for the January-March quarter is based on the Cabinet Office survey concluded by Dec. 25, which means the effects of the powerful New Year's Day earthquake and suspension of all domestic production by Toyota Motor group firm Daihatsu over a safety scandal from late December until mid-February are not reflected in the outlook provided by firms.
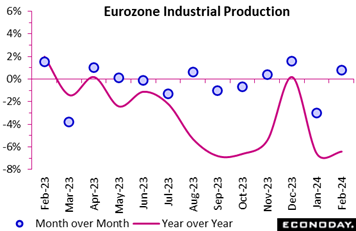 Eurozone industrial production rebounded in February but by slightly less than expected and was nowhere close to reversing January's slump. Output was up 0.8 percent on the month, a tick less than Econoday’s consensus and following a marginally shallower revised 3.0 percent drop at the start of the year. Annual workday adjusted growth was minus 6.4 percent, only a modest improvement on January's minus 6.6 percent decline. Eurozone industrial production rebounded in February but by slightly less than expected and was nowhere close to reversing January's slump. Output was up 0.8 percent on the month, a tick less than Econoday’s consensus and following a marginally shallower revised 3.0 percent drop at the start of the year. Annual workday adjusted growth was minus 6.4 percent, only a modest improvement on January's minus 6.6 percent decline.
February's partial recovery reflected monthly gains in intermediates (0.5 percent), capital goods (1.2 percent) and durable consumer goods (1.4 percent). Non-durables (minus 0.9 percent) and energy (minus 3.0 percent) both lost ground.
Regionally, the larger four member states all posted increases with France up 0.2 percent, Germany 1.1 percent, Italy 0.1 percent and Spain 1.3 percent. Most other countries similarly recorded gains.
However, despite its February advance, Eurozone industrial production remains on course to subtract from first quarter GDP growth. Absent any revisions, March will need a monthly jump of fully 4.0 percent just to keep the quarter flat. There are some tentatively promising signals in the latest data – notably the first back-to-back increase in intermediates in a year – but the underlying picture of the region's manufacturing sector remains soft.
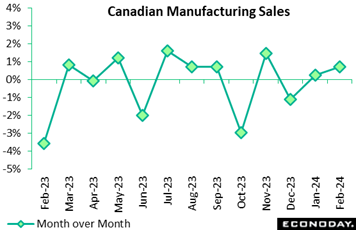 Manufacturing sales in Canada rose 0.7 percent in February, as expected, for a 12-month increase of 0.1 percent. Much of the expansion was price related as volumes edged up just 0.1 percent from the previous month. Excluding motor vehicles and parts, sales were up 0.8 percent on the month. Manufacturing sales in Canada rose 0.7 percent in February, as expected, for a 12-month increase of 0.1 percent. Much of the expansion was price related as volumes edged up just 0.1 percent from the previous month. Excluding motor vehicles and parts, sales were up 0.8 percent on the month.
Forward-looking indicators point to further increases for manufacturing sales, as new orders rose 1.9 percent and unfilled orders 0.8 percent on the month. Inventories contracted 0.7 percent from January, bringing the inventory-to-sales ratio to 1.68 from 1.71, the leanest level since September 2023.
Higher sales were accompanied by an increase in the capacity utilization rate to 78.1 percent from 77.0 percent, with both durable and non-durable industries up 1.1 percentage point.
The value of sales increased in 13 of 21 subsectors in February, driven by a 4.3 percent advance in petroleum and coal and a 12.6 percent gain in electrical equipment. Yet machinery, an indicator of investment activity, contracted 0.4 percent. The chemical subsector recorded the largest drop of 5.5 percent.
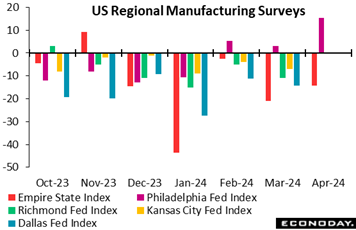 The general business conditions index in the Philadelphia Fed’s manufacturing survey rose to 15.5 in April after 3.2 in the prior month. The April readings was well above the consensus of 0.0 (zero) in Econoday’s survey of forecasters and the highest since 16.9 in April 2022. In fact, Philly’s April score is the highest of any of the five regional manufacturing indexes since the same April 2022. The general business conditions index in the Philadelphia Fed’s manufacturing survey rose to 15.5 in April after 3.2 in the prior month. The April readings was well above the consensus of 0.0 (zero) in Econoday’s survey of forecasters and the highest since 16.9 in April 2022. In fact, Philly’s April score is the highest of any of the five regional manufacturing indexes since the same April 2022.
Philly’s index rarely had a positive reading from June 2022 through January 2024, but seems to have exited the long period of nearly universal contraction. The future business conditions index is slightly lower at 34.3 in April after 38.6 in March. However, these are two consecutive strong numbers at levels not seen since mid-2021. The region appears to be experiencing an uptick in current activity and anticipating solid growth in the near future.
The detail indexes point to a jump in new orders as the main factor for the improvement in general sentiment. New orders rose to 12.2 in April after 5.4 in March for the highest reading since 13.5 in May 2022. Order backlogs were little changed but positive at 0.8 in April after 1.0 in March. This is the first time that either of these indexes have seen back-to-back expansion since April-May 2022.
Not confirming Philly’s strength, however, was the Empire State report from the New York Fed which did improve but remained in negative ground at minus 14.3 in April. The underlying trend for current conditions in this index appears to remain one of moderate contraction. The outlook for six months from now has softened a bit with the future conditions index at 16.7 in April after 21.6 in March. Although the future index anticipates a return to growth, it expects it to be modest.
New orders index firmed slightly but remained noticeably negative at minus 16.2 in April after minus 17.2 in March. The unfilled orders index was essentially the same at minus 10.1 in April after minus 10.9 in March.
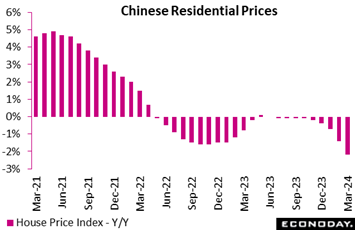 China's residential property prices fell 2.2 percent on the year in March after dropping 1.4 percent in February. China's property market has been very weak for nearly two years, representing a major drag on investment and consumer spending. Officials have taken steps in recent months to support the market, but March’s data again indicate that sentiment and conditions remain very weak for now and pose a contrast to the country’s favorable first-quarter GDP report. China's residential property prices fell 2.2 percent on the year in March after dropping 1.4 percent in February. China's property market has been very weak for nearly two years, representing a major drag on investment and consumer spending. Officials have taken steps in recent months to support the market, but March’s data again indicate that sentiment and conditions remain very weak for now and pose a contrast to the country’s favorable first-quarter GDP report.
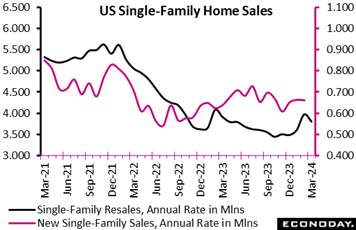 Sales of existing US homes dipped 4.3 percent to a 4.19 million unit seasonally adjusted annual rate in March after 4.38 million in March. Sales were down 3.7 percent from March 2023. The softening in the pace of sales closed in March reflects higher mortgage rates and higher prices. Sales of existing US homes dipped 4.3 percent to a 4.19 million unit seasonally adjusted annual rate in March after 4.38 million in March. Sales were down 3.7 percent from March 2023. The softening in the pace of sales closed in March reflects higher mortgage rates and higher prices.
Potential homebuyers remain sensitive to even small changes in interest rates. Sales that closed in March were for contracts taken out mostly in January and February. The monthly average for a Freddie Mac 30-year fixed rate mortgage was 6.64 percent in January, 6.81 percent in February, and 6.82 percent in March.
The median price for an existing home rose 2.5 percent to $393,500 after $383,800 in February and was up 4.8 percent from a year ago. The average number of days a home was on the market fell to 33 after 38 days in February, but slightly above the 29 days in March 2023. The share of first time buyers rose to 32 percent in March after falling to 26 percent in February, and above the 28 percent in March 2023.
Resales of single-family homes fell 4.3 percent in March to 3.80 million units from 3.97 million units in February and were down 2.8 percent from 3.91 million units in March 2023 (March sales of new single-family homes will be posted in the coming week, see Looking Ahead for details). Resales of condos and co-ops fell 4.9 percent to 390,000 units in March after 410,000 units in February and were down 11.4 percent from 440,000 in March 2023.
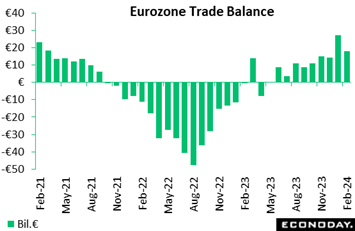 The seasonally adjusted merchandise trade balance was in a €17.9 billion surplus in February, down from €27.1 billion at the start of the year. The deterioration reflected a 4.2 percent monthly rise in imports combined with a 0.2 percent dip in exports. February’s report leaves a still declining trend for imports (down 8.4 percent on the year) and a broadly flat trend for exports (up 0.3 percent). Overseas demand continues to provide only limited help to Eurozone GDP. Both sides of the balance sheet remain impacted by the war in Ukraine. Hence, for the EU as a whole, exports to Russia were down 22.0 percent on the year while imports were off 41.0 percent. The seasonally adjusted merchandise trade balance was in a €17.9 billion surplus in February, down from €27.1 billion at the start of the year. The deterioration reflected a 4.2 percent monthly rise in imports combined with a 0.2 percent dip in exports. February’s report leaves a still declining trend for imports (down 8.4 percent on the year) and a broadly flat trend for exports (up 0.3 percent). Overseas demand continues to provide only limited help to Eurozone GDP. Both sides of the balance sheet remain impacted by the war in Ukraine. Hence, for the EU as a whole, exports to Russia were down 22.0 percent on the year while imports were off 41.0 percent.
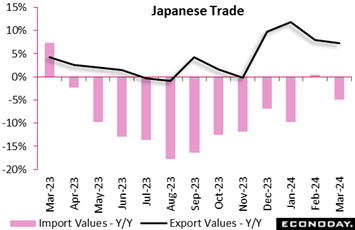 Japanese export values rose 7.3 percent on year in March for the fourth straight increase, led by solid global demand for automobiles and Asian purchases of semiconductors. The pace of increase was faster than the consensus forecast of a 5.8 percent gain but was slightly slower than the 7.8 percent rise in February. Japanese export values rose 7.3 percent on year in March for the fourth straight increase, led by solid global demand for automobiles and Asian purchases of semiconductors. The pace of increase was faster than the consensus forecast of a 5.8 percent gain but was slightly slower than the 7.8 percent rise in February.
Import values dipped 4.9 percent (consensus was a 7.2 percent drop) after posting the first year-over-year increase in 11 months with a slight 0.5 percent rise in February. The decrease was led by coal and liquefied natural gas due to their soft prices as well as lower demand for non-ferrous metals where prices have risen in recent months.
The trade balance recorded a ¥366.5 billion surplus after a deficit of ¥377.8 billion in February. This was the first positive figure since a ¥58.9 billion surplus seen in December.
Shipments to China, one of the key export markets for Japanese goods, posted their fourth straight increase after a year-long decline through November last year. Japanese exports to the European Union also posted a fourth consecutive gain.
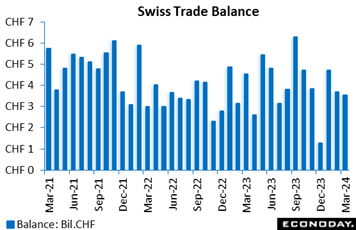 Switzerland’s merchandise trade balance was in a CHF3.54 billion surplus in March, down from CHF3.68 billion in February and CHF4.56 billion a year ago. The decrease in the black ink reflected a 16.6 percent yearly drop in imports that was more than offset by a 17.6 percent slide in exports. Switzerland’s merchandise trade balance was in a CHF3.54 billion surplus in March, down from CHF3.68 billion in February and CHF4.56 billion a year ago. The decrease in the black ink reflected a 16.6 percent yearly drop in imports that was more than offset by a 17.6 percent slide in exports.
Seasonally adjusted, the surplus stood at CHF2.85 billion, up from February's CHF2.34 billion and a 5-month high. Even so, exports fell 0.6 percent on the month leaving the improvement wholly attributable to a 3.3 percent drop in imports.
Still, the March data make for a modest increase in the real trade balance last quarter as export volumes rose 0.6 percent and their import counterpart decreased 0.2 percent. As such, net foreign merchandise trade will have provided a small boost to real GDP growth.
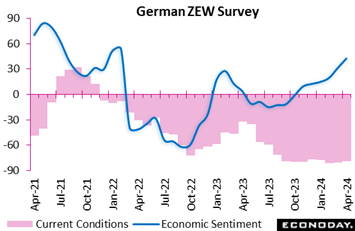 ZEW's April survey again found analysts becoming more confident about the state of the German economy with both the current conditions index and its expectations counterpart posting fresh gains. That said, versus Econoday’s consensus the results were slightly mixed. ZEW's April survey again found analysts becoming more confident about the state of the German economy with both the current conditions index and its expectations counterpart posting fresh gains. That said, versus Econoday’s consensus the results were slightly mixed.
The current conditions gauge rose a further 1.3 points to minus 79.2, its second successive increase and a 3-month high but just short of the market forecast. It is also still well down on its pre-Covid mark (minus 15.7). However, the recovery in economic sentiment (expectations) continued apace with the measure climbing 11.2 points to a surprisingly firm 42.9. This is its ninth consecutive increase and its strongest print since February 2022.
Analysts are clearly seeing light at the end of the tunnel for the German economy. Even so, the current position is still weak and first-quarter GDP growth will be very sluggish at best.
Having consistently surprised on the upside over the last four weeks or so, global economic activity in the week was weaker than forecast. That said, at minus 11 and minus 5 respectively, both the Relative Performance Index and the index less prices (RPI-P) only point to a very limited degree of underperformance. Moreover, regional trends continue to argue in favor of a prospective divergence in central bank policies that should widen interest rate differentials in favor of the dollar.
In the US, the shift in market sentiment towards higher-for-longer Federal Reserve interest rates remains underpinned by unexpectedly strong economic activity. At 12, neither the RPI nor the RPI-P are deep in positive surprise territory but the overall picture is robust enough to suggest that pressure on the central bank to ease has diminished significantly in recent weeks.
In Canada, a mixed bag of data was on balance weak enough versus expectations to nudge the RPI (minus 2) just back below zero. Taken together with a small positive reading on the RPI-P (6), the message is that overall economic activity is essentially performing as anticipated and leaving in question whether the Bank of Canada will continue to hold steady or perhaps cut rates in June.
In the Eurozone, the RPI-P (minus 15) joined the RPI (minus 25) in negative surprise territory showing that the real economy is also now struggling to keep up with expectations. The slide below zero follows a decent run of unexpectedly firm data and will only strengthen the current market conviction that the European Central Bank will be lowering key interest rates in June.
In the UK, unexpectedly firm inflation and wage growth saw the RPI end the week at 14 and the RPI-P at 12. While not far above zero, both readings show enough overall economic outperformance to strengthen the case for no cut in Bank Rate until much later in the year.
In Switzerland there were no surprises in the week leaving the RPI (minus 20) and RPI-P (minus 6) still indicating disappointingly soft economic activity. Another rate cut by the Swiss National Bank this quarter remains a real possibility.
In Japan, surprisingly strong news on manufacturing orders and the trade balance contrasted with unexpectedly soft inflation and lifted the RPI to 15 and the RPI-P to 33. The mixed economic picture and weak yen complicate the job of Japan’s policymakers and should increase the chances that the Bank of Japan will make no further change to interest rates in the coming week.
In China, March’s string of positive RPI prints was reflected in surprisingly firm first quarter growth. However, at now minus 34 and minus 27 respectively, both the RPI and RPI-P show economic activity underperforming in March which might presage a more subdued second quarter.
**Contributing to this article were Jeremy Hawkins, Brian Jackson, Mace News, Max Sato, and Theresa Sheehan
The week is expected to open with no further cuts in China’s loan prime rates on Monday. The Bank of Japan on Friday isn’t expected to further raise rates though this is the expectation for subsequent meetings.
Key inflation data aren’t expected to show much if any moderation, whether Austrialian consumer prices on Wednesday or the US PCE price indexes on Friday. Yet there is an expected exception and that’s Tokyo consumer prices on Friday where underlying rates are expected to cool.
The first estimate for first-quarter US GDP on Thursday is expected at 2.3 percent annualized growth, down from the fourth quarter but still more than respectable. April’s run of PMI flashes are expected to improve but only slightly with services generally above 50 but manufacturing generally below this breakeven level.
China Loan Prime Rates (Mon 0915 CST; Mon 0115 GMT; Sun 2115 EDT)
Consensus Change: 1-Year Rate: 0 basis points
Consensus Level: 3.45%
Consensus Change: 5-Year Rate: 0 basis points
Consensus Level: 3.95%
As in March, the People's Bank of China is expected to hold rates unchanged in April: at 3.45 percent for the 1-year rate and the 3.95 percent for the 5-year.
Eurozone: EC Consumer Confidence Flash for April (Mon 1600 CEST; Mon 1400 GMT; Mon 1100 EDT)
Consensus Forecast: -14.3
Consumer confidence in April is expected to improve to minus 14.3 versus March’s minus 14.9 which was 6 tenths better than February but once again well short of the minus 11.7 long-run average.
Singapore CPI for March (Tue 1300 SGT; Tue 0500 GMT; Tue 0100 EDT)
Consensus Forecast, Year over Year: 3.1%
Consumer prices in March, which in February came in at 3.4 percent versus expectations for 3.0 percent, are expected to slow to 3.1 percent.
German PMI Flashes for April (Tue 0930 CEST; Tue 0730 GMT; Tue 0330 EDT)
Consensus Forecast, Composite: 48.6
Consensus Forecast, Manufacturing: 43.0
Consensus Forecast, Services: 50.5
Manufacturing sank into even deeper contraction in March, to 41.9 from February’s 42.5. Only slight improvement to 43.0 is expected for April. Services, which in March rebounded nearly 2 points to 50.1, are seen rising further to 50.5. Consensus for April’s composite is 48.6 following March’s 47.7.
Eurozone PMI Flashes for April (Tue 1000 CEST; Tue 0800 GMT; Tue 0400 EDT)
Consensus Forecast, Composite: 50.8
Consensus Forecast, Manufacturing: 46.5
Consensus Forecast, Services: 51.8
The composite is expected to rise to 50.8 in April versus 50.3 in March and 49.2 in February. Manufacturing is expected to edge higher to 46.5 versus March’s lower-than-expected 46.1 with services also expected to edge higher to 51.8 from March’s higher-than-expected 51.5.
UK PMI Flashes for April (Tue 0930 BST; Tue 0830 GMT; Tue 0430 EDT)
Consensus Forecast, Composite: 53.0
Consensus Forecast, Manufacturing: 50.0
Consensus Forecast, Services: 53.3
Manufacturing unexpectedly jumped nearly 3 points to 50.3 in March for its best showing since July 2022. April’s consensus is 50.0. Services growth slowed 7 tenths in March to 53.1 with April expected at 53.3. The composite is expected to rise to 53.0 from March’s 52.8.
Australian March and Quarterly CPI (Wed 1130 AEST; Wed 0130 GMT; Tue 2130 EDT)
Consensus Forecast Monthly, Year over Year: 3.5%
Consensus Forecast Quarterly, Quarter over Quarter: 0.8%
Consensus Forecast Quarterly, Year over Year: 3.5%
Consumer prices in March are expected to rise to 3.5 percent year-over-year versus 3.4 percent in both January and February. First-quarter consumer prices are expected to increase 0.8 percent on the quarter and 3.5 percent on the year. These would would compare with fourth-quarter rates of 0.6 and 4.1 percent.
German Ifo for April (Wed 1000 CEST; Wed 0900 GMT; Wed 0400 EDT)
Consensus Forecast, Business Climate: 89.0
Consensus Forecast, Current Conditions: 89.0
Consensus Forecast, Business Expectations: 88.9
March’s business climate of 87.8 was well beyond the consensus and up solidly from 85.5 in February. April’s consensus is a further gain to 89.0.
US Durable Goods Orders for March (Wed 0830 EDT; Wed 1230 GMT)
Consensus Forecast: Month over Month: 2.3%
Consensus Forecast: Ex-Transportation - M/M: 0.3%
Consensus Forecast: Core Capital Goods Orders - M/M: 0.2%
Forecasters see durable goods orders rising 2.3 percent in March on top of a 1.3 percent rise in February that saw wide gains. Ex-transportation orders are seen up 0.3 percent in March with core capital goods, which jumped 0.7 percent in February, expected to rise 0.2 percent.
Canadian Retail Sales for February (Wed 0830 EDT; Wed 1230 GMT)
Consensus Forecast, Month over Month: 0.1%
Retail sales in February are expected to rise 0.1 percent on the month after falling 0.3 percent in January.
Korean First-Quarter GDP, First Estimate (Thu 0800 KST; Wed 2300 GMT; Wed 1900 EDT)
Consensus Forecast, Quarter over Quarter: 0.6%
Consensus Forecast, Year over Year: 2.4%
First-quarter GDP is expected to rise a quarterly 0.6 percent and rise 2.4 percent on the year. These would compare respectively with growth of 0.6 and 2.2 percent in the fourth quarter and 0.6 and 1.4 percent in the third quarter.
Germany: GfK Consumer Climate for May (Thu 0800 CEST; Thu 0600 GMT; Thu 0200 EDT)
Consensus Forecast: -25.8
Consumer climate is expected to rise to minus 25.8 in May’s report after a preliminary minus 27.4 in April. This index has been improving but remains historically weak.
US First-Quarter GDP, First Estimate (Thu 0830 EDT, Thu 1230 GMT)
Consensus Forecast, Annualized Rate: 2.3%
US Real Personal Consumption Expenditures
Consensus Forecast: 2.8%
First-quarter GDP is expected to slow to 2.3 percent annualized growth versus fourth-quarter growth of 3.4 percent. Personal consumption expenditures, after the fourth quarter's 3.3 percent rate, are expected to rise at a 2.8 percent pace.
US International Trade in Goods (Advance) for February (Thu 0830 EDT; Thu 1230 GMT)
Consensus Forecast, Balance: -$91.0 billion
The US goods deficit (Census basis) is expected to deepen by $0.7 billion to $91.0 billion in March after narrowing by $0.3 billion in February to $90.3 billion.
Tokyo Consumer Price Index for April (Fri 0830 JST; Thu 2330 GMT; Thu 1930 EDT)
Consensus Forecast, Year over Year: 2.6%
Ex-Fresh Food, Consensus Forecast: 2.2%
Ex-Fresh Food & Energy, Consensus Forecast: 2.7%
Overall inflation in Tokyo is expected to hold unchanged in April at 2.6 percent. Yet underlying rates are expected to further cool, from 2.4 to 2.2 percent excluding fresh food and from 2.9 to 2.7 percent excluding fresh food and energy.
Bank of Japan Announcement (Expected sometime between 11:30 and 12:00 JST on Friday, April 26)
Consensus Forecast, Change: 0 basis points
Consensus Forecast, Level: 0.0 to 0.1%
After tightening policy at its March meeting by ending its yield-curve control policy and lifting its overnight rate target to zero to 0.1 percent, the Bank of Japan is expected to keep policy steady at its April meeting. Yet should more evidence of wage pressures emerge in the coming months, a second rate hike is expected at subsequent meetings.
Singapore Industrial Production for March (Fri 1300 SGT; Fri 0500 GMT; Fri 0100 EDT)
Consensus Forecast, Month over Month: -8.8%
Consensus Forecast, Year over Year: -1.5%
After February’s 14.2 percent lunar-year surge, industrial production is expected to fall 8.8 percent in March. The year-over-year rate is seen falling 1.5 percent versus February’s growth of 3.8 percent.
Eurozone M3 Money Supply for March (Fri 1000 CEST; Fri 0800 GMT; Fri 0400 EST)
Consensus Forecast, Year-over-Year: 0.6%
The 3-month moving average is expected to increase 0.6 percent in March following February’s as-expected 0.2 percent rise that followed easing contraction in prior months to hint that the effects of earlier ECB tightening are beginning to diminish.
US Personal Income for March (Fri 0830 EDT; Fri 1230 GMT)
Consensus Forecast, Month over Month: 0.5%
US Consumption Expenditures
Consensus Forecast, Month over Month: 0.6%
US PCE Price Index
Consensus Forecast, Month over Month: 0.3%
Consensus Forecast, Year over Year: 2.6%
US Core PCE Price Index
Consensus Forecast, Month over Month: 0.3%
Consensus Forecast, Year over Year: 2.7%
Personal income is expected to rise 0.5 percent in March with consumption expenditures expected to increase 0.6 percent. These would compare with February’s 0.3 percent increase in income and 0.8 percent increase in consumption. Inflation readings for March are expected at monthly increases of 0.3 percent both overall and for the core (versus 0.3 percent for both in February). Annual rates are expected at 2.6 percent overall and 2.7 percent for the core (versus February’s 2.5 and 2.8 percent).
|

