|
The U.S. economy on average continues to improve. However, overseas events—especially Ukraine—continue to create uncertainty for investors.
Stocks improved for the week despite overseas events. Economic news continued to be sidelined by Ukraine, Gaza, and Iraq. Ukraine, however, got the most attention.
 Equities gained Monday as traders saw tensions easing between Ukraine and Russia. Talks mediated by Egypt between Israeli and Palestinian negotiators were seen as positive. Stocks dipped Tuesday as energy equities declined. Also weighing on stocks was an eighth consecutive monthly drop in German consumer confidence, an alleged humanitarian mission moving from Russia to eastern Ukraine which some saw as a potential military mission, lack of progress on Gaza, and leadership transition issues in Iraq. Equities gained Monday as traders saw tensions easing between Ukraine and Russia. Talks mediated by Egypt between Israeli and Palestinian negotiators were seen as positive. Stocks dipped Tuesday as energy equities declined. Also weighing on stocks was an eighth consecutive monthly drop in German consumer confidence, an alleged humanitarian mission moving from Russia to eastern Ukraine which some saw as a potential military mission, lack of progress on Gaza, and leadership transition issues in Iraq.
At mid-week, stocks advanced notably despite a disappointing report on retail sales. It was a "bad news is good news" day as traders saw the report as holding off the Fed's first rate increase during next year. Geopolitical issues were seen as quieter on the day.
 Stock index improvement continued Thursday even as news from overseas was not good. Numbers for second quarter GDP for France, Germany, and the EU fell below expectations—including a negative number for German GDP, largely damped by Ukraine concern. It was more current news that lifted stocks after President Vladimir Putin said Russia will work to stop the conflict in eastern Ukraine. Equities were mixed Friday on a report that Ukraine government forces attacked an armed convoy from Russia—allegedly carrying humanitarian aid. Stock index improvement continued Thursday even as news from overseas was not good. Numbers for second quarter GDP for France, Germany, and the EU fell below expectations—including a negative number for German GDP, largely damped by Ukraine concern. It was more current news that lifted stocks after President Vladimir Putin said Russia will work to stop the conflict in eastern Ukraine. Equities were mixed Friday on a report that Ukraine government forces attacked an armed convoy from Russia—allegedly carrying humanitarian aid.
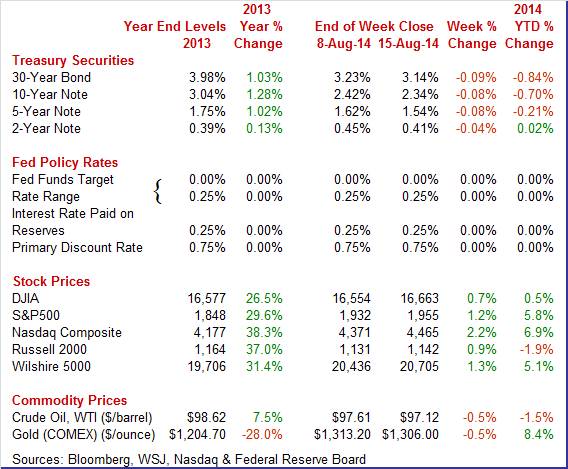
Equities were up this past week. The Dow was up 0.7 percent; the S&P 500, up 1.2 percent; the Nasdaq, up 2.2 percent; the Russell 2000, up 0.9 percent; and the Wilshire 5000, up 1.3 percent.
For the year-to-date, major indexes are up as follows: the Dow, up 0.5 percent; the S&P 500, up 5.8 percent; the Nasdaq, up 6.9 percent; and the Wilshire 5000, up 5.1 percent. The Russell 2000 is down 1.9 percent.
Weekly percent change column reflects percent changes for all components except interest rates. Interest rate changes are reflected in simple differences.
 Treasury yields declined moderately this past week. The story is mostly about flight to safety over Ukraine and Gaza. Additionally, weak retail sales on Wednesday and soft weekly numbers for jobless claims on Thursday weighed on rates. Yields fell Friday on flight to safety, offsetting a strong number for industrial production. Views are mixed but most traders see the Fed as not being in a rush to raise rates next year. We will see the next Fed forecasts on policy decisions with the September FOMC statement. Treasury yields declined moderately this past week. The story is mostly about flight to safety over Ukraine and Gaza. Additionally, weak retail sales on Wednesday and soft weekly numbers for jobless claims on Thursday weighed on rates. Yields fell Friday on flight to safety, offsetting a strong number for industrial production. Views are mixed but most traders see the Fed as not being in a rush to raise rates next year. We will see the next Fed forecasts on policy decisions with the September FOMC statement.
For this past week Treasury rates were down as follows: the 2-year note, down 4 basis points; the 5-year note, down 8 basis points; the 7-year note, down 9 basis points; the 10-year note, down basis 8 points; and the 30-year bond, down 9 basis points. The 3-month T-bill firmed 1 basis point.
 The spot price of West Texas Intermediate was essentially unchanged for the week. The two big daily moves were Thursday and Friday. On Thursday, crude declined about $2 per barrel on news of weak growth in Europe. Friday saw a rebound of about $1-1/2 per barrel on news of an attack by Ukraine troops on a Russian convoy headed to eastern Ukraine. The spot price of West Texas Intermediate was essentially unchanged for the week. The two big daily moves were Thursday and Friday. On Thursday, crude declined about $2 per barrel on news of weak growth in Europe. Friday saw a rebound of about $1-1/2 per barrel on news of an attack by Ukraine troops on a Russian convoy headed to eastern Ukraine.
Net for the week, the spot price for West Texas Intermediate nudged down 49 cents per barrel to settle at $97.12.
The economy was mixed this past week. While manufacturing showed renewed vigor, the consumer sector disappointed on the soft side.
 On a bright note, manufacturing was leading the economy in July and was stronger than earlier believed in June. Industrial production increased a robust 0.4 percent in July, equaling the revised June pace (originally up 0.2 percent). Expectations were for a 0.3 percent boost for July. The manufacturing component surged 1.0 percent in July, following a 0.3 percent increase in June. Mining advanced 0.3 percent after jumping 1.3 percent in June. Utilities dropped 3.4 percent, following a 0.7 percent dip in June. On a bright note, manufacturing was leading the economy in July and was stronger than earlier believed in June. Industrial production increased a robust 0.4 percent in July, equaling the revised June pace (originally up 0.2 percent). Expectations were for a 0.3 percent boost for July. The manufacturing component surged 1.0 percent in July, following a 0.3 percent increase in June. Mining advanced 0.3 percent after jumping 1.3 percent in June. Utilities dropped 3.4 percent, following a 0.7 percent dip in June.
 Within manufacturing, the production of durable goods increased 1.7 percent in July and was 8.2 percent higher than its year-earlier level. The production of nondurables increased 0.3 percent in July and has moved up 2.1 percent over the past 12 months. Within manufacturing, the production of durable goods increased 1.7 percent in July and was 8.2 percent higher than its year-earlier level. The production of nondurables increased 0.3 percent in July and has moved up 2.1 percent over the past 12 months.
Motor vehicle assemblies were very strong, posting at a 12.85 million unit annual pace, compared to 11.36 million in June. The July number was the highest since July 2002's pace of 12.95 million.
The overall capacity utilization rate in July firmed to 79.2 percent from 79.1 percent the month before.
The manufacturing sector appears to be healthier than even recent manufacturing surveys have suggested. The recovery seems to have greater strength than believed with domestic demand being the driving force-literally with auto assemblies up. Also, the latest regional manufacturing survey points to good growth in August.
 Manufacturing growth cannot be above average every month. But it can continue to be healthy as appears to be the case for Empire State in August. Manufacturing growth cannot be above average every month. But it can continue to be healthy as appears to be the case for Empire State in August.
Acceleration in the New York manufacturing sector slowed in August but remained very solid, at 14.69 versus 25.60 in July. New orders were still strong, at 14.14 versus 18.77, while shipments actually accelerated slightly, to a very strong 24.59 from 23.64.
The early numbers on August manufacturing point to solid growth for the month. The question, however, is how to reconcile the strength in manufacturing with slowing in consumer spending.
It is a quandary. Manufacturing is notably healthy—and not due to overseas demand. But retail sales in the U.S. have grown at a slower pace.
 Retail sales disappointed for a second month in a row. Retail sales were flat in July, following a 0.2 percent gain the month before (originally up 0.2 percent). Retail sales disappointed for a second month in a row. Retail sales were flat in July, following a 0.2 percent gain the month before (originally up 0.2 percent).
Motor vehicles slipped 0.2 percent, following a decrease of 0.3 percent in June. Excluding motor vehicles, sales edged up 0.1 percent, following an increase of 0.4 percent in June. Excluding motor vehicles and gasoline, sales nudged up 0.1 percent in July after jumping 0.6 percent the prior month.
Outside of the core, weakness was led by a 0.5 percent decline in general merchandise with modest decreases also seen in furniture & home furnishings; electronics & appliance stores; and nonstore retailers.
Strength in July was led by miscellaneous store retailers, up 0.9 percent in July. Clothing & accessories and health & personal care both were up 0.4 percent. Modest increases were in food & beverage stores; sporting goods, hobby, book & music stores; and food services & drinking places.
While consumer spending was healthy in the second quarter, that does not appear to be the case for the third quarter based on July data. Third quarter GDP estimates are likely to be nudged down. Also, there will need to be improvement in retail sales to help sustain manufacturing. A key question is whether manufacturers' optimism is justified for demand in the second half.
The consumer remains wary about the economy and prospects for second half growth this year. But the mood motivations are uncertain.
 Consumer sentiment fell 2.6 points in early August to a lower-than-expected 79.2. The expectations component fell 5.6 points to 66.2 which is the lowest reading since the government shutdown of October. Given the improvement in the labor market, not to mention the decline in gas prices, the reason for the decline here is unclear. Consumer sentiment fell 2.6 points in early August to a lower-than-expected 79.2. The expectations component fell 5.6 points to 66.2 which is the lowest reading since the government shutdown of October. Given the improvement in the labor market, not to mention the decline in gas prices, the reason for the decline here is unclear.
A clear positive in the report was a 2.2 point gain in current conditions to a recovery high of 99.6 which offers an early hint of monthly strength for consumer activity compared to July.
 Producer price inflation eased in July. The PPI for total final demand slowed to a 0.1 percent gain after rebounding 0.4 percent in June. Total final demand excluding food & energy rose 0.2 percent in both July and June and equaled the consensus forecast. Total final demand excluding food, energy, and trade services increased 0.2 percent in July, matching the June pace. Producer price inflation eased in July. The PPI for total final demand slowed to a 0.1 percent gain after rebounding 0.4 percent in June. Total final demand excluding food & energy rose 0.2 percent in both July and June and equaled the consensus forecast. Total final demand excluding food, energy, and trade services increased 0.2 percent in July, matching the June pace.
 Prices for final demand goods were flat after jumping 0.5 percent in June. Energy goods declined in the latest month while food rebounded notably. Prices for final demand services slowed to a 0.1 percent gain after rebounding 0.3 percent in June. Prices for final demand goods were flat after jumping 0.5 percent in June. Energy goods declined in the latest month while food rebounded notably. Prices for final demand services slowed to a 0.1 percent gain after rebounding 0.3 percent in June.
On a seasonally adjusted year-ago basis, PPI final demand was up 1.7 percent in July versus 1.9 percent in June. Excluding food & energy, PPI final demand was up 1.6 percent compared to 1.7 percent in June.
The latest PPI report points to a soft CPI report for July. The doves at the Fed will likely interpret the PPI numbers to suggest no early boost in policy rates. But a number of factors need to be considered—including recently strong manufacturing.
The economy is moving forward but unevenly. Manufacturing is strong and may suggest some optimism within this sector—which almost certainly is based on domestic demand expectations rather than demand from overseas. The average consumer appears to be wary with mood numbers oscillating monthly. With overseas events continuing to weigh on the global economy, the U.S. appears to be the place to park or invest money.
This week offers a variety of indicators on the economy. Housing has been a tough read lately and there are three key updates—NAHB housing market index, housing starts, and existing home sales. As with this past week's robust industrial production report, manufacturing has regained momentum significantly. Updates will be seen in surveys on manufacturing from Markit Economics and from the Philly Fed. The July CPI number has potential to rattle or calm the bond markets and affect views on the timing of rate increases by the Fed.
The NAHB housing market index jumped 4 points to 53 in July, its best level since January. Components showed special strength for sales expectations, at 64 for a 6 point gain, and importantly a 4 point gain to 57 for current sales. Continuing to lag way behind, however, was traffic which improved 3 points but remained well below the breakeven 50 level at 39. This reflects weakness in first-time home buyers.
NAHB housing market index Consensus Forecast for August 14: 53.0
Range: 50.0 to 55.0
The consumer price index posted a 0.3 percent rise for the headline figure for June. Though this was down 1 tenth from May's 0.4 percent jump, the year-on-year rate remained just above the key 2 percent level at 2.1 percent. But there was an easing in the monthly core reading which excludes food and energy, inching up only 0.1 percent higher versus May's outsized 0.3 percent gain. But here too, the year-on-year rate was unchanged, pressing right at the Fed's goal of 2 percent at 1.9 percent. Gasoline led the headline number, jumping 3.3 percent in the month though the year-on-year rate actually slipped 3 tenths to plus 2.0 percent. Food prices, which had been on the rise, edged only 0.1 percent higher as fruits, dairy and cereals contracted. Helping to ease the core rate was a slowing in growth in shelter costs—which posted a relatively high increase in May.
CPI Consensus Forecast for July 14 +0.1 percent
Range: +0.1 to +0.2 percent
CPI ex food & energy Consensus Forecast for July 14: +0.2 percent
Range: +0.1 to +0.3 percent
Housing starts in June disappointed sharply, declining another monthly 9.3 percent after decreasing 7.3 percent in May. June starts came in at 0.893 million units annualized, up 7.5 percent on a year-ago basis. The fall in the latest month was led by the multifamily component but was closely followed by the single-family component. Multifamily family starts dropped 9.9 percent after falling 14.7 percent in May. The single-family component declined 9.0 percent in June, following a 2.6 percent dip the prior month. Building permits also lost ground. Permits declined 4.2 percent after decreasing 5.1 percent in May. June's 0.963 million units annualized was up 2.7 percent on a year-ago basis.
Housing starts Consensus Forecast for July 14: 0.963 million-unit rate
Range: 0.950 million to 1.025 million-unit rate
The Minutes of the July 29-30 FOMC meeting are scheduled for release at 2:00 p.m. ET. Market focus will likely be on hints of when the first increase in policy rates will occur next year. Fed taper remains "measured" and on schedule—no surprises expected on this issue.
Initial jobless claims rose 21,000 in the August 9 week to 311,000 which was the highest level since late June. But the 4-week average, though rising 2,000 to 295,750, was still nearly 15,000 below a month ago in a comparison that hints at improvement for the monthly employment report. Continuing claims data, which lag by a week, rose 25,000 in the August 2 week to 2.544 million with the 4-week average up 9,000 to 2.528 million. But here too, the month-ago comparison is favorable showing a decrease of more than 30,000.
Jobless Claims Consensus Forecast for 8/16/14: 300,000
Range: 300,000 to 315,000
The Markit PMI manufacturing index (final) was still very strong in the final July reading where the composite index remained well above 50, at 55.8 versus 56.3 in the flash July reading and versus 57.3 in June which was a multi-year high. Details are provided only to subscribers but the report does note that, despite the slowing in the composite, production remained very strong. It said new orders held strong and steady though exports orders slowed to a six-month low.
No consensus numbers are available for this month's report
The general business conditions index of the Philadelphia Fed's Business Outlook Survey in July jumped 6.1 points to 23.9 for the highest reading since March 2011. New orders were a standout highlight, soaring 17.4 points to 34.2. Shipments were also at 34.2, up 18.7 points. Unfilled orders are piling up, at 9.1 following an 11.5 rise in June.
Philadelphia Fed survey Consensus Forecast for August 14: 20.0
Range: 17.0 to 21.0
Existing home sales rose 2.6 percent in June to a higher-than-expected annual rate of 5.04 million. The gain comes against difficult comparisons, an upwardly revised 5.4 percent jump in May and a 1.5 percent gain in April. Sales contracted in each of the first three months of the year. The gain in June was very well balanced with single-family sales up 2.5 percent to a 4.43 million rate and with condo sales up 3.4 percent to a 610,000 rate. All regions showed gains in the month led by the Midwest at 6.2 percent.
Existing home sales Consensus Forecast for July 14: 5.00 million-unit rate
Range: 4.90 to 5.15 million-unit rate
The Conference Board's index of leading indicators rose a lower-than-expected 0.3 percent in June. Otherwise, the report was mostly positive with 7 of 10 components posting gains led by the yield spread, which reflects the Fed's stimulative monetary policy, and including the credit component which points to an increase in lending. The stock market was also a positive as were new orders in the manufacturing sector. Other readings include a tepid 0.2 percent rise in the coincident index, which follows gains of only 0.3 percent and 0.2 percent in the two prior months.
Leading indicators Consensus Forecast for July 14: +0.6 percent
Range: +0.4 to +0.8 percent
R. Mark Rogers is the author of The Complete Idiot's Guide to Economic Indicators, Penguin Books.
He can also be found on a weekly broadcast talking about the U.S. economy, the easiest way to find him is by going to iTunes and searching for "Simply Economics."
Econoday Senior Writer Mark Pender contributed to this article.
|
