|
It was a very good week for U.S. equities due to a combination of easing tensions in Ukraine, positive developments in Iraq, better-than-expected economic data, and a Fed mostly still reluctant to rush rate hikes. However, a vocal minority within the Fed is suggesting earlier increases.
 Key indices hit record highs on Thursday and only slipped marginally at week's end. Throughout the week, traders anticipated Fed Chair Janet Yellen's comments on Friday at Kansas City Fed's symposium at Jackson Hole, Wyoming. Key indices hit record highs on Thursday and only slipped marginally at week's end. Throughout the week, traders anticipated Fed Chair Janet Yellen's comments on Friday at Kansas City Fed's symposium at Jackson Hole, Wyoming.
Stocks advanced Monday due to increasing homebuilder confidence (reflected in the NAHB housing market index hitting its highest level in seven months) and hopes for receding tensions between Russia and Ukraine. Ukrainian Foreign Minister Pavlo Klimkin met his Russian counterpart Sergei Lavrov for more than five hours of talks in Berlin. Klimkin indicated that progress had been made. Traders viewed as a positive that Iraqi and Kurdish forces retook control of the Mosul Dam from Islamist militants. Merger activity also lifted stocks as Dollar General offered to buy Family Dollar Stores.
 Stocks gained Tuesday on a surge in housing starts and strong earnings from Home Depot that overshadowed lingering concerns about Ukraine and the Middle East. At mid-week, stocks rallied after the minutes of the most recent FOMC meeting indicated the Fed will continue to support the economy amid uneven gains in the labor market. Stocks gained Tuesday on a surge in housing starts and strong earnings from Home Depot that overshadowed lingering concerns about Ukraine and the Middle East. At mid-week, stocks rallied after the minutes of the most recent FOMC meeting indicated the Fed will continue to support the economy amid uneven gains in the labor market.
Thursday, positive economic news led stocks up, included a jump in July existing home sales to a 10-month high and a sharp drop in initial jobless claims, pointing to an economy that is slowly gaining strength. Markit's "flash" manufacturing purchasing managers' index rose to the highest level since April 2010 while Philadelphia Fed manufacturers' index for this month registered its highest reading since March 2011. The S&P 500 hit a record close.
Stocks generally edged down Friday as Fed Chair Janet Yellen's comments were largely as expected but Ukraine came to the forefront. Reports indicated that NATO was concerned about the Russian buildup of forces on the border with eastern Ukraine.
Equities were up notably this past week. The Dow was up 2.0 percent; the S&P 500, up 1.7 percent; the Nasdaq, up 1.6 percent; the Russell 2000, up 1.6 percent; and the Wilshire 5000, up 1.7 percent.
For the year-to-date, major indexes mostly are up as follows: the Dow, up 2.6 percent; the S&P 500, up 7.6 percent; the Nasdaq, up 8.7 percent; and the Wilshire 5000, up 6.8 percent. However, the Russell 2000 is down 0.3 percent.
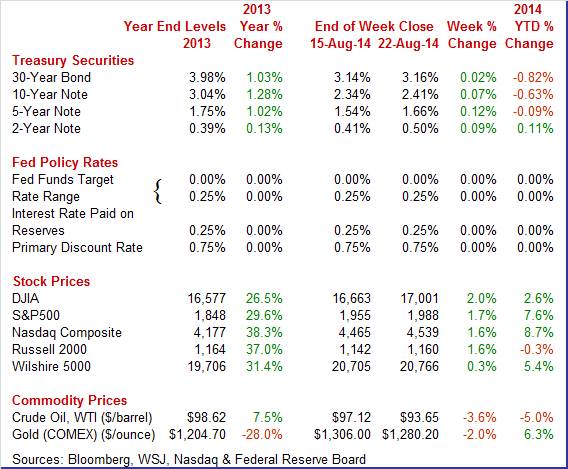
Weekly percent change column reflects percent changes for all components except interest rates. Interest rate changes are reflected in simple differences.
 Treasury yields rose moderately this past week. Only two days somewhat stood out in terms of daily movement—Monday and Wednesday. Rates gained somewhat Monday on reversal of flight to safety on easing of tensions over eastern Ukraine. Also, higher confidence in homebuilders supported yields. Treasury yields rose moderately this past week. Only two days somewhat stood out in terms of daily movement—Monday and Wednesday. Rates gained somewhat Monday on reversal of flight to safety on easing of tensions over eastern Ukraine. Also, higher confidence in homebuilders supported yields.
Wednesday, rates firmed as bond traders saw the FOMC minutes as suggesting that Fed nudging up policy rates could happen sooner than earlier believed.
Thursday, yields eased very slightly on belief that Janet Yellen would make dovish comments about the labor market during her Friday presentation at Jackson Hole. But on the news Friday, Yellen was still dovish but not quite as much as expected and mid-maturity rates nudged up.
For this past week Treasury rates mostly were up as follows: the 2-year note, up 9 basis points; the 5-year note, up 12 basis points; the 7-year note, up 10 basis points; the 10-year note, up 7 basis points; and the 30-year bond, up 2 basis points. The 3-month T-bill rate eased 2 basis points.
 The spot price of West Texas Intermediate fell notably this past week despite better-than-expected economic news. The spot price of West Texas Intermediate fell notably this past week despite better-than-expected economic news.
Prices slipped Monday after Iraqi and Kurdish forces retook a dam at Mosul. But the biggest move of the week was Tuesday with more than a $2 decline for the day to hit a seven month low. It was largely technical. Investors sold September crude futures before expiration and purchased cheaper contracts for future delivery. This also impacted spot.
Net for the week, the spot price for West Texas Intermediate dropped $3.47 per barrel to settle at $93.65.
Economic news is slowly growing more positive. However, the Fed is still in a debating mood on timing of rate changes.
The latest Fed minutes indicated that the economy is moving closer to Fed goals of unemployment and inflation. However, markets showed little reaction. While the unemployment rate has come down, many FOMC participants still see labor market slack as suggested by sluggish wage rates. Policy rate tightening is still seen as data dependent. Most participants see inflation moving closer to goal of 2 percent PCE price inflation. If the economy improves faster than projected, the FOMC sees sooner increases in policy rates. But this is still data dependent and the minutes highlighted sluggishness in the labor market.
Regarding unwinding the Fed balance sheet, the technical discussion has grown. Most participants see interest paid on excess reserves (IOER) and the reverse repo rate as key tools for controlling unwinding the balance sheet. There will likely be a 25 basis point band with IOER at the top and the reverse repo rate at the bottom. Reductions in the balance sheet are planned to be predictable.
FedSpeak last week was mixed with Chair Janet Yellen's comments at Jackson Hole being the highlights. Her talk was on the labor market—which is important because one of the Fed's dual objectives is healthy employment growth.
Chair Janet Yellen emphasized the importance of an array of employment statistics, not just the employment rate which has been falling faster than expected. And though inflation is moving toward the Fed's 2 percent threshold, she warned that an early rate rise could limit the employment recovery. Still seeing weakness in the labor market, she described the decline in the unemployment rate, now at 6.2 percent, as surprising and rapid, but warned that the labor market has yet to fully recover. Apart from the unemployment rate, Yellen stressed the need for a "nuanced" assessment of the labor market given what she said is "considerable uncertainty" over the level of employment and what she believes is the Fed's limited understanding of labor market developments and their potential impact on inflation."
She said that there's no "preset path" for monetary policy. Should economic improvement prove disappointing, she said "the future path of interest rates likely would be more accommodative than we currently anticipate." But she also noted that more rapid-than-expected improvement in the labor market or rise in inflation would move forward the expected increase in the federal funds target and trigger more rapid increases thereafter.
Probably her most important comment was that "underutilization of labor resources still remains significant." This points to no urgency to raise policy rates. Yet, other views within the Fed are mixed.
In an interview, Fed Bank of St. Louis President James Bullard said the Fed may begin tightening monetary policy earlier than previously expected. Kansas City Fed's President Esther George this past week agreed that rate increases should come sooner. In contrast, Atlanta Fed President Dennis Lockhart took a more dovish tone, urging more patience for ensuring a strengthening recovery.
The bottom line is that most FOMC participants remain on track to keep policy rates low for a considerable period of time but some are calling for earlier increases. Regardless of the timing of the first rate hike, it is still likely that increases will be gradual.
 The housing sector may be making a comeback and adding to economic growth overall. The labor market improving and awareness that the Fed is cutting back on mortgage-backed securities-meaning a pending rise in mortgage rates. And both factors may be lifting housing activity. The housing sector may be making a comeback and adding to economic growth overall. The labor market improving and awareness that the Fed is cutting back on mortgage-backed securities-meaning a pending rise in mortgage rates. And both factors may be lifting housing activity.
Housing starts for July jumped to an annualized pace of 1.093 million units-up from 0.945 million units the prior month. The latest number well topped expectations for 0.963 million units. July was up a sharp 15.7 percent (monthly), after dipping 4.0 percent in June. July's pace was the highest level since November 2013.
Strength was led by the multifamily component which surged 28.9 percent after a 3.1 percent decline in June. But the single-family component showed health with an 8.3 percent rebound after falling 4.4 percent in June.
 According to building permits, momentum is building-but largely for the multifamily component. Permits jumped a monthly 8.1 percent to an annualized pace of 1.052 million units. For July, the multifamily component gained 21.5 percent while the single-family component edged up 0.9 percent. According to building permits, momentum is building-but largely for the multifamily component. Permits jumped a monthly 8.1 percent to an annualized pace of 1.052 million units. For July, the multifamily component gained 21.5 percent while the single-family component edged up 0.9 percent.
Housing is improving but it is becoming apparent that the market has changed. Single-family housing is not as attractive financially as in the past and multifamily housing is the current trend. But at least it is on an uptrend.
 Existing home sales in July advanced 2.4 percent to an annualized pace of 5.15 million units, topping expectations for 5.00 million. June rose a revised 2.4 percent to a marginally downwardly revised 5.03 million. July sales were down 4.3 percent on a year-ago basis. Existing home sales in July advanced 2.4 percent to an annualized pace of 5.15 million units, topping expectations for 5.00 million. June rose a revised 2.4 percent to a marginally downwardly revised 5.03 million. July sales were down 4.3 percent on a year-ago basis.
July's figure puts existing home sales back at the pace last seen in October 2013 before atypically adverse winter weather undercut sales.
For the latest month, strength was in the single-family component which gained 2.7 percent to 4.55 million annualized. Condos were unchanged at 0.60 million.
Supply on the market actually rose faster than sales-up 3.5 percent in July to 2.37 million units. Months' supply, however, was steady at 5.5 months.
The median price rose 0.4 percent in July to $222,900 (up 4.9 percent year-ago) while the average price increased 0.2 percent to $268,700 (up 3.7 percent year-ago).
The latest report is encouraging for the housing market. Homebuilders probably are happy to see the rise in demand for existing home sales but they want to see it move to new homes.
Early data on manufacturing for August was positive.
Strong growth in employment led a very strong PMI manufacturing report where the composite index, at 58.0 for the August flash reading, was up a sharp 2.2 points from final July's 55.8 and up 1.7 points from the July flash of 56.3.
Details are only provided to Markit subscribers, but the report did note that all five components of the composite contributed to the month's growth led by employment which, now showing its strongest reading since March last year, had been soft in July's report.
The report cites acceleration for output and new orders and a 3-year high for export orders, another reading that had been lagging in prior months.
The latest Philly Fed report on manufacturing was mixed with detail somewhat contradicting strength in the headline number.
 Details do not confirm what at the headline level, at 28.0 versus July's 23.9, was exceptional acceleration this month in the Philly Fed's manufacturing sector. Details do not confirm what at the headline level, at 28.0 versus July's 23.9, was exceptional acceleration this month in the Philly Fed's manufacturing sector.
In contrast, the new orders index slowed very sharply to 14.7 versus July's 34.2, while shipments were at 16.5, likewise well down from another 34.2 in July.
Unfilled orders are contracting and delivery times are improving, again both pointing to slowing activity. Employment growth is down as are price pressures.
The headline index for this report, unlike many other reports, is not a composite of components but is based on a single subjective question of month-to-month business activity. A possible reconciliation of the headline with details is that manufacturers are optimistic about future activity.
 The latest report on consumer price inflation gives the Fed more to debate. Consumer price inflation in July was modest but it still appears to be creeping upward. The trend is fuel for hawks within the Fed. The latest report on consumer price inflation gives the Fed more to debate. Consumer price inflation in July was modest but it still appears to be creeping upward. The trend is fuel for hawks within the Fed.
Overall consumer prices rose 0.1 percent in July after a strong 0.3 percent boost the month before. Excluding food and energy, the CPI gained only 0.1 percent-the same as in June and coming slightly below forecasts for 0.2 percent.
 Energy dipped 0.3 percent in July after jumping 1.6 percent in June. Food was on the hot side with a 0.4 percent jump, following a 0.1 percent increase in June. Energy dipped 0.3 percent in July after jumping 1.6 percent in June. Food was on the hot side with a 0.4 percent jump, following a 0.1 percent increase in June.
Within the core, gains were seen in shelter, medical care, new vehicles, personal care, and apparel. Indexes for airline fares, recreation, used cars and trucks, for household furnishings and operations, and for tobacco declined in July.
Despite modest overall numbers for July, the trend is upward. On a seasonally adjusted basis, the headline CPI was up 2.0 percent in July versus 2.1 percent the month before. Excluding food and energy, the year-ago pace was 1.9 percent in the latest two months. These rates are bumping against the Fed goal of 2 percent PCE price inflation. The shelter rate has been a key factor, rising from minus territory in 2010 to 3 percent currently.
 The recovery appears to be gaining momentum, according to the latest index of leading indicators. The index of leading economic indicators is taking off, up 0.9 percent in July versus a sharply upward revised 0.6 percent gain in June (plus 0.3 percent prior). May's gain was also revised and was also at 0.6 percent (plus 0.7 percent prior). The recovery appears to be gaining momentum, according to the latest index of leading indicators. The index of leading economic indicators is taking off, up 0.9 percent in July versus a sharply upward revised 0.6 percent gain in June (plus 0.3 percent prior). May's gain was also revised and was also at 0.6 percent (plus 0.7 percent prior).
The drop underway in unemployment claims is a leading and very convincing factor for the strength in July. The yield spread, as usual, is the month's strongest factor reflecting the Federal Reserve's stimulative monetary policy. Building permits are also especially strong but come off a very low base in June. Strength in the manufacturing sector is another factor behind the month's gain, specifically the ISM's new orders index. The report's credit component is also strong pointing to rising demand and access to loans.
Both housing and manufacturing now appear to be picking up, although at uneven rates. Markets are still expecting to keep policy rates low for a considerable period of time. Both factors should be favorable for equities.
This week's focus is on manufacturing and housing. Manufacturing has regained momentum and the week's eye popper might be headline durables orders as Boeing orders posted a huge gain for the month. Watch the excluding transportation data. Regional Fed surveys have mostly been improving. This week's updates come from Dallas, Richmond, and Kansas City. On the housing front, the latest numbers showed notable gains for housing starts and existing home sales. But new home sales have been soft and that is a key update this week. Home price appreciation has shown decelerating growth in recent reports and new numbers will hit the wires for FHFA and Case-Shiller this week.
The Chicago Fed National Activity Index slowed slightly in June but remained above the historical average, still above zero at plus 0.12 vs plus a revised 0.16 in May. The three-month average was also above zero, at plus 0.13 but down from a noticeably more solid and upwardly revised plus 0.28 in May. The slowing in June was centered entirely in the production-related component which came in at zero versus plus 0.14 in May, directly reflecting a meager 0.2 percent rise in industrial production vs May's 0.5 percent gain.
Chicago Fed National Activity Index Consensus Forecast for July 14: 0.20
Range: 0.05 to 0.20
The Markit PMI services index for final July indicated continued strong growth in general activity, posting well above breakeven 50 at 60.8 versus 61.0 in both the mid-month July reading and the final reading for June. Markit does not provide details to the public but does note other readings are strong though less strong than recent months including new business volumes and the 12-month outlook.
Markit PMI services index (flash) Consensus Forecast for August 14: 62.0
Range: 60.8 to 62.0
New home sales came in at a paltry annual rate of 406,000 in June while the May reading, which was extraordinarily strong, was revised 62,000 lower to 442,000. June's 8.1 percent drop was the biggest percent decline in almost a year and followed an 8.3 percent boost the month before. All regions showed declines in June with the most important region, the South because of its overwhelming size in this report, posting a 9.5 percent drop. The drop in sales raised supply relative to sales, to 5.8 months versus May's 5.2 months.
New home sales Consensus Forecast for July 14: 430 thousand-unit annual rate
Range: 415 thousand to 455 thousand-unit annual rate
The Dallas Fed general business activity index edged up in July from 11.4 to 12.7, pushing to its highest level in 10 months. The company outlook index rose 3 points to 11.3. Texas factory activity increased again in July, according to business executives responding to the Texas Manufacturing Outlook Survey. The production index, a key measure of state manufacturing conditions, rose from 15.5 to 19.1, indicating output grew at a faster pace than in June. Other measures of current manufacturing activity reflected significantly stronger growth in July. The new orders index doubled from 6.5 to 13. Expectations regarding future business conditions remained optimistic in July. The index of future general business activity inched up to 19.8, while the index of future company outlook fell to 24.4 after reaching a multi-year high of 33.8 in June.
Dallas Fed general business activity index Consensus Forecast for August 14: 13.5
Range: 8.0 to 16.0
Durable goods orders in June rebounded 1.7 percent, following a decline of 0.9 percent in May. Excluding transportation, orders advanced 1.9 percent in June, following a dip of 0.1 percent in May. Transportation partially rebounded 1.3 percent after falling 2.6 percent in May. The latest boost was from defense aircraft and nondefense aircraft. Motor vehicles declined. Outside of transportation, gains were posted in primary metals, machinery, computers & electronics, and "other." Declines were in fabricated metals and electrical equipment. Manufacturing continues on a recent uptrend, retaining its role as a key engine of growth. Durables orders have been up in four of the last five months. For July, the high end of analysts' forecasts has been jacked up by a surge in orders for Boeing aircraft. Recent numbers reflect revisions from the more recent total factory orders report.
New orders for durable goods Consensus Forecast for July 14: +5.1 percent
Range: -1.0 percent to +24.5 percent
New orders for durable goods, ex-trans., Consensus Forecast for July 14: +0.4 percent
Range: -0.5 percent to +1.3 percent
The FHFA purchase only house price index rose a respectable 0.4 percent in May, but the year-on-year rate slowed by 6 tenths to plus 5.5 percent from a revised 6.1 percent. This rate had been in the 7.0 percent range earlier in the year. The regional breakdown shows special monthly weakness in East South Central and East North Central with gains in the West South Central and Middle Atlantic.
FHFA purchase only house price index Consensus Forecast for June 14: +0.3 percent
Range: +0.2 to +0.5 percent
The S&P/Case-Shiller 20-city home price index (SA) unexpectedly declined in May at a seasonally adjusted minus 0.3 percent and followed a 0.1 percent rise the month before. May's dip was the first negative reading since January 2012. Year-on-year, both adjusted and unadjusted, home prices were at plus 9.3 percent, down substantially from 10.8 percent and 12.4 percent in the two prior months. Unadjusted data showed deceptive strength, at a monthly plus 1.1 percent. But this reflected seasonal strength in the spring months for housing and was not a sign of pricing power.
The S&P/Case-Shiller 20-city HPI (SA, m/m) Consensus Forecast for June 14: +0.1 percent
Range: -0.5 to +0.2 percent
The S&P/Case-Shiller 20-city HPI (NSA, y/y) Consensus Forecast for June 14: +8.4 percent
Range: +7.8 to +9.0 percent
The Conference Board's consumer confidence index was by far at its best level of the recovery, at a much higher-than-expected 90.9 in July versus an already very strong and upwardly revised 86.4 in June. July's level was the highest since December 2007 while the June reading was the second highest since January 2008. July's gain was led by the expectations component which was up a very sharp 6.3 points to 92.7 for the highest reading since February 2011. The present situation component was up 2.0 points to 88.3 for the highest reading since March 2008.
Consumer confidence Consensus Forecast for August 14: 89.5
Range: 85.0 to 94.0
The Richmond Fed manufacturing index rose 3 points to 7 in July for a fourth straight gain that followed two prior months of winter-related contraction. New orders were steady and solid, unchanged at 5. In a very important plus, the strong growth in orders is giving manufacturers in the region the confidence to hire with the employment index up a very strong 9 points to 13.
Richmond Fed manufacturing index Consensus Forecast for August 14: 8.0
Range: 4.0 to 12.0
GDP growth in the second quarter rebounded more than expected from the adverse weather impacted first quarter. While there were a number of strong components, the rebound was led by inventory growth. The advance estimate for the second quarter posted at a healthy 4.0 percent annualized, following an upwardly revised decline of 2.1 percent in the first quarter (previously down 2.9 percent). Final sales of domestic product rebounded 2.3 percent after dipping 1.0 percent in the first quarter. Final sales to domestic purchasers gained 2.8 percent in the second quarter, compared to 0.7 percent in the first quarter. On the price front, the chain-weighted price index firmed to a 2.0 percent increase, up from 1.3 percent in the first quarter. The core chain index increased 1.8 percent in the second quarter from 1.2 percent in the prior quarter.
Real GDP Consensus Forecast for second estimate Q2 14: +4.0 percent annual rate
Range: +3.7 to +4.1 percent annual rate
GDP price index Consensus Forecast for second estimate Q2 14: +2.0 percent annual rate
Range: +2.0 to +2.1 percent annual rate
Initial jobless claims continue to trend lower, falling 14,000 to a better-than-expected level of 298,000 in the August 16 week, a week that is also the sample week for the monthly employment report. A comparison with the July sample week shows a 5,000 improvement. The 4-week average, at 300,750, was up 4,750 from the prior week but was down 8,500 from the July sample week.
Jobless Claims Consensus Forecast for 8/23/14: 300,000
Range: 295,000 to 303,000
The pending home sales index for existing home sales came in at a solid 102.7 in June, healthy but down a bit from a revised 103.8 in May. The monthly percentage change, at minus 1.1 percent, followed a monthly 6.0 percent spike in May. The regional breakdown showed a dip in the South but a gain for the Midwest and a fractional gain for the West.
Pending home sales Consensus Forecast for July 14: +0.5 percent
Range: -1.5 to +2.5 percent
The Kansas City Fed manufacturing index edged higher in July, posting at 9 and up from 6 in June but slightly lower than 10 in May. The composite index is an average of the production, new orders, employment, supplier delivery time, and raw materials inventory indexes. The growth in manufacturing activity occurred mostly at durable goods-producing plants, particularly machinery products, while nondurable goods-producers reported fairly flat activity.
Kansas City Fed manufacturing index Consensus Forecast for August 14: 9
Range: 7 to 11
Personal income rose 0.4 percent in June, matching the pace the month before. The important wages & salaries component increased 0.4 percent in both of the most two recent months. This suggests ample fuel for consumer spending in the near term. Personal consumption improved to a 0.4 percent boost in June after rising 0.3 percent the month before. For June, spending strength was in durables (up 0.4 percent) and nondurables (up 0.3 percent). Services edged up only 0.1 percent in June. July inflation numbers likely kept the Fed happy. PCE inflation eased to a monthly 0.2 percent in June from 0.3 percent in May. Core PCE inflation softened to a 0.1 percent rise after a 0.2 percent gain in May. On a year-ago basis, headline PCE inflation posted at 1.6 percent versus 1.7 percent in June. Year-ago core inflation was 1.5 percent in both June and May.
Personal income Consensus Forecast for July 14: +0.3 percent
Range: +0.1 to +0.5 percent
Personal consumption expenditures Consensus Forecast for July 14: +0.2 percent
Range: 0.0 to +0.3 percent
PCE price index Consensus Forecast for July 14: +0.1 percent
Range: 0.0 to +0.2 percent
Core PCE price index Consensus Forecast for July 14: +0.1 percent
Range: +0.1 to +0.2 percent
The Chicago PMI showed its not too uncommon volatility in the July, plunging 10.0 points to a 52.6 level that was only slightly above 50 and points to no more than modest monthly growth for the area's monthly economy. This is the largest decline since October 2008. Exact details are not provided but the report says new orders, backlog orders, and production all declined. The report also cited geo-political concerns as a negative for the month.
Chicago PMI Consensus Forecast for August 14: 56.4
Range: 54.0 to 60.0
The Reuter's/University of Michigan's consumer sentiment index for early August slipped 2.6 points to 79.2. The expectations component fell 5.6 points to 66.2 which was the lowest reading since the government shutdown of October. Given the improvement in the labor market, not to mention the decline in gas prices, the reason for the decline was unclear. A clear positive in the report was a 2.2 point gain in current conditions to a recovery high of 99.6 which offers an early hint of monthly strength for consumer activity compared to July.
Consumer sentiment Consensus Forecast for final August 14: 80.5
Range: 79.6 to 82.0
R. Mark Rogers is the author of The Complete Idiot's Guide to Economic Indicators, Penguin Books.
He can also be found on a weekly broadcast talking about the U.S. economy, the easiest way to find him is by going to iTunes and searching for "Simply Economics."
Econoday Senior Writer Mark Pender contributed to this article.
|
