|
Equities were mixed this past week. The Fed policy decision came in much as expected. At the end of the week, markets were relieved that the vote on Scottish independence was "no" but still eased.
 Stock traders were nervous this past week—awaiting the Fed policy decision then the outcome of the Scottish independence vote. Stock traders were nervous this past week—awaiting the Fed policy decision then the outcome of the Scottish independence vote.
At the start of the week, stocks were mostly down on unexpected weakness in industrial production due to the auto sector. Equities rebounded Tuesday on expectations that the Fed's policy decision on Wednesday might be less hawkish than earlier believed. Also, rising oil prices boosted the energy sector.
 At mid-week, stocks advanced with investors reassured after the Federal Reserve maintained the words "considerable time" in its policy statement regarding keeping rates low after the end of taper. Also, equity traders saw as favorable the Fed's comments that the economy is expanding at a moderate pace and inflation is below its goal. Thursday, both the Dow Jones industrials and S&P closed at new record highs due to continued momentum from the Fed decision and a sharp decline in initial jobless claims. Friday, stocks ended mixed after initially showing notable gains after the "no" vote on Scottish independence. Helping support stocks was a very favorable IPO by Alibaba while downdraft came from the energy sector. At mid-week, stocks advanced with investors reassured after the Federal Reserve maintained the words "considerable time" in its policy statement regarding keeping rates low after the end of taper. Also, equity traders saw as favorable the Fed's comments that the economy is expanding at a moderate pace and inflation is below its goal. Thursday, both the Dow Jones industrials and S&P closed at new record highs due to continued momentum from the Fed decision and a sharp decline in initial jobless claims. Friday, stocks ended mixed after initially showing notable gains after the "no" vote on Scottish independence. Helping support stocks was a very favorable IPO by Alibaba while downdraft came from the energy sector.
Equities were mixed this past week. The Dow was up 1.7 percent; the S&P 500, up 1.3 percent; the Nasdaq, up 0.3 percent; the Russell 2000, down 1.2 percent; and the Wilshire 5000, up 0.8 percent.
For the year-to-date, major indexes are mostly up as follows: the Dow, up 4.2 percent; the S&P 500, up 8.8 percent; the Nasdaq, up 9.7 percent; and the Wilshire 5000, up 7.7 percent. The Russell 2000 is down 1.4 percent.
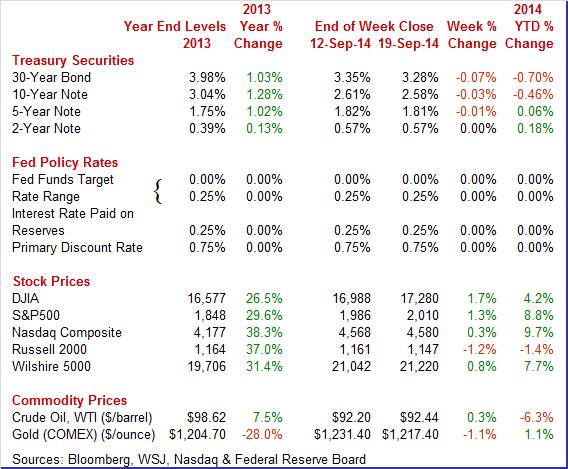
Weekly percent change column reflects percent changes for all components except interest rates. Interest rate changes are reflected in simple differences.
 Treasury yields were unchanged to down modestly with only two notable daily swings. Rates firmed Wednesday after the Fed's statement and forecasts. Bond traders noted the Fed bumped up its estimate of the target rate for overnight loans between banks for 2015. Rates eased Friday on news that Scotland voted against independence. Treasury yields were unchanged to down modestly with only two notable daily swings. Rates firmed Wednesday after the Fed's statement and forecasts. Bond traders noted the Fed bumped up its estimate of the target rate for overnight loans between banks for 2015. Rates eased Friday on news that Scotland voted against independence.
For this past week Treasury rates were flat to down as follows: 3-month T-bill, unchanged; the 2-year note, unchanged; the 5-year note, down 1 basis point; the 7-year note, unchanged; the 10-year note, down 3 basis points; and the 30-year bond, down 7 basis points.
 The spot price of West Texas Intermediate essentially was unchanged for the week. There were two notable daily swings. Crude rose almost two dollars a barrel Tuesday after OPEC's secretary general said the group may cut output targets next year. On Thursday, WTI declined a little over a dollar a barrel on a stronger dollar. The spot price of West Texas Intermediate essentially was unchanged for the week. There were two notable daily swings. Crude rose almost two dollars a barrel Tuesday after OPEC's secretary general said the group may cut output targets next year. On Thursday, WTI declined a little over a dollar a barrel on a stronger dollar.
Net for the week, the spot price for West Texas Intermediate nudged up 24 cents per barrel to settle at $92.44.
This past week, the Fed held steady on policy while news was mixed on housing and manufacturing.
Again, policy rates are unchanged. Also, taper remains on schedule to end with the October FOMC meeting. From this meeting, bond purchases were reduced by another $10 billion, starting in October, leaving just $15 billion per month. Guidance retained "considerable time" language for when the first rate increase follows the end of taper.
The FOMC released principles for a return to normalized monetary policy. The key point is that changes will be gradual. The Fed plans to raise policy rates when conditions warrant. Reinvestment of assets likely will end after the first rate increase and the impact should be gradual.
Fourteen participants see the first rate hike as appropriate in 2015 versus 12 at the June FOMC meeting.
The economy is described as "expanding at a moderate pace." The statement noted that there still is significant underutilization of the labor market and that inflation has been running below the Fed's long-term objective.
There were two dissenting votes, by Richard W. Fisher and Charles I. Plosser.
"President Fisher believed that the continued strengthening of the real economy, improved outlook for labor utilization and for general price stability, and continued signs of financial market excess, will likely warrant an earlier reduction in monetary accommodation than is suggested by the Committee's stated forward guidance. President Plosser objected to the guidance indicating that it likely will be appropriate to maintain the current target range for the federal funds rate for "a considerable time after the asset purchase program ends," because such language is time dependent and does not reflect the considerable economic progress that has been made toward the Committee's goals."
Overall, the statement was a little more dovish than the prior statement.
From Chair Janet Yellen's press conference she emphasized that the Fed remains data dependent and did not want to be tied down to a specific time frame. She also remained focused on the labor market — it has yet to fully recover. But she sees the fed funds rate closer to normal by the end of 2017.
 Housing continues to be volatile in recent months. Homebuilders are being cautious as both starts and permits disappointed for August. But August is coming off a strong July. Housing continues to be volatile in recent months. Homebuilders are being cautious as both starts and permits disappointed for August. But August is coming off a strong July.
Housing starts for August fell 14.4 percent, following a boost of 22.9 percent the month before. August's pace of 0.956 million units was short of market expectations for 1.038 million units and was up 8.0 percent on a year-ago basis.
The multifamily component declined a monthly 31.7 after jumping 44.9 percent in July. The single-family component edged down 2.4 percent, following an 11.1 percent surge in July.
Building permits are oscillating, too. Permits decreased 5.6 percent in August, following an 8.6 percent boost in July. Monthly swings have largely been in the multifamily component. The single-family component has been in a modest downturn in recent months.
There has been a lot of volatility in housing data in recent months and the latest starts data likely will lead to some trimming of forecasts for third quarter GDP growth. The trend continues that housing strength is in the multifamily component.
 Industrial production slipped 0.1 percent in August after a gain of 0.2 percent the month before. Analysts expected a 0.3 percent boost for the month. The decline may be deceiving, tied to auto assemblies and retooling schedules. Industrial production slipped 0.1 percent in August after a gain of 0.2 percent the month before. Analysts expected a 0.3 percent boost for the month. The decline may be deceiving, tied to auto assemblies and retooling schedules.
Manufacturing production fell 0.4 percent after a 0.7 percent increase in July. Weakness was led by motor vehicles which dropped a monthly 7.6 percent. In contrast, motor vehicle sales have been healthy, indicating that this is just a retooling timing issue. Manufacturing excluding motor vehicles rose 0.1 percent after a matching rise in July.
Auto assemblies (autos and light trucks) fell to an annualized pace of 11.36 million units from 12.91 million in July.
For other industries, mining rebounded 0.5 percent after slipping 0.3 percent in July. Utilities made a partial comeback of 1.0 percent, following a drop of 2.7 percent the month before.
Capacity utilization eased to 78.8 percent from 79.1 percent in July.
Overall, manufacturing is still a positive for the economy although the strength oscillates.
 Early regional reports on manufacturing are pointing to healthy growth in September. Early regional reports on manufacturing are pointing to healthy growth in September.
Perceptions of strength are building in New York's manufacturing sector as the Empire State general conditions index was up nearly 12 points this month to 27.54. New orders were up slightly to 16.86 versus August's 14.14. Shipments showed strength, at 27.08 versus 24.59.
And there is one unusual positive in the September report, a sudden surge in the 6-month outlook for prices received which is up more than 12 points to 32.61. A rise in expectations for price traction points to rising expectations for demand. The 6-month outlook for general conditions remains a big plus in this report, at 46.72 vs 46.76 in August and compared against a less optimistic 28.47 in July.
But this report is closely read as the first indicator on month-to-month manufacturing activity, not future activity, and the report, on net, is more flat than it is strong, and that's centered in employment where lack of strength belies expectations for rising demand.
Turning to the Philly Fed report, a dip in Philly Fed's current activity index, from an outsized 28.0 in August to a still very strong 22.5 in September, was not supported by details of the report which actually show greater strength than August. Shipments are accelerating further this month, to 21.6 from August's 16.5, as are new orders, at 15.5 versus 14.7, and especially employment at 21.2 versus 9.1 in what is an unusually strong gain.
Overall, the manufacturing sector may be oscillating upward in September.
 Inflation took at least a temporary break in August for the consumer. Both the headline CPI and core number came in lower than expected-giving Fed doves room to stay loose on policy (released early Wednesday before the Wednesday FOMC vote). Inflation took at least a temporary break in August for the consumer. Both the headline CPI and core number came in lower than expected-giving Fed doves room to stay loose on policy (released early Wednesday before the Wednesday FOMC vote).
Overall consumer prices fell 0.2 percent in August after rising 0.1 percent in July. Excluding food and energy, the CPI was unchanged after gaining only 0.1 percent the month before.
Energy dropped a monthly 2.6 percent, following a dip of 0.3 percent in July. Gasoline prices fell a sharp 4.1 percent, following a 0.3 percent decrease in July. Food price inflation decelerated to a 0.2 percent gain after jumping 0.4 percent in July.
The index for all items less food and energy was unchanged in August; this was the first month since October 2010 that the index did not increase. While the shelter index increased and the indexes for new vehicles and for alcoholic beverages also rose, these advances were offset by declines in several indexes, including airline fares, recreation, household furnishings and operations, apparel, and used cars and trucks.
On a seasonally adjusted basis, the headline CPI was up year-ago 1.7 percent in August-down from 2.0 percent in July. Excluding food and energy, the year-ago pace was 1.7 percent also, easing from 1.9 percent in July.
Overall, the latest CPI report suggests modest price pressure. This adds to the odds that Fed rates will not go up in early 2015. But the counter argument is that the consumer sector is showing signs of improvement-notably with retail sales.
 Food and energy softened producer prices in August. The PPI for total final demand was unchanged after a 0.1 percent gain in July. Analysts expected no change for August. Total final demand excluding food & energy eased to 0.1 percent in August after rising 0.2 percent the month before. Total final demand excluding food, energy, and trade services increased 0.2 percent in August, matching the July rate. Food and energy softened producer prices in August. The PPI for total final demand was unchanged after a 0.1 percent gain in July. Analysts expected no change for August. Total final demand excluding food & energy eased to 0.1 percent in August after rising 0.2 percent the month before. Total final demand excluding food, energy, and trade services increased 0.2 percent in August, matching the July rate.
 The final demand services index climbed 0.3 percent in August after inching up 0.1 percent in July. Eighty percent of the August advance can be traced to a 0.3-percent rise in prices for final demand services less trade, transportation, and warehousing. The index for final demand transportation and warehousing services also increased 0.3 percent. The final demand services index climbed 0.3 percent in August after inching up 0.1 percent in July. Eighty percent of the August advance can be traced to a 0.3-percent rise in prices for final demand services less trade, transportation, and warehousing. The index for final demand transportation and warehousing services also increased 0.3 percent.
The index for final demand goods moved down 0.3 percent in August, the largest decrease since a 0.7-percent drop in April 2013. Over 80 percent of the August decline is attributable to prices for final demand energy, which fell 1.5 percent. The index for final demand foods decreased 0.5 percent.
On a seasonally adjusted year-ago basis, PPI final demand was up 1.8 percent in August versus 1.7 percent in July. Excluding food & energy, PPI final demand was up 1.6 percent, matching the July pace.
 One cannot expect a huge surge in the leading index every month. August eased off a very robust July. On average, the leading index suggests moderately economic growth ahead. One cannot expect a huge surge in the leading index every month. August eased off a very robust July. On average, the leading index suggests moderately economic growth ahead.
The index of leading economic indicators edged only 0.2 percent higher in August following, however, an upwardly revised and very sharp gain of 1.1 percent in July. Looking at the trend, the index is likely pointing to only moderate economic growth through the remainder of the year.
Weakness in building permits has been dragging on the LEI all year. Permits dropped 5.6 percent in August and make for the month's biggest negative. August's rise in unemployment claims (since reversing this month) is the second biggest negative. The biggest positive is the yield spread, which reflects the Fed's still stimulative policy, followed by the ISM's very strong new orders index posted earlier this month. A third positive is the report's credit component that continues to point to a rise in lending.
The report's coincident index, like the leading index, is also showing no more than moderate growth, at plus 0.2 percent in August following gains of only 0.1 and 0.3 percent in the two prior months. This report is a reminder that housing remains, as it has been all year, a rough spot for economy.
With a modest recovery, the monthly data have been volatile. Still, the trend is modest to moderate positive growth. Inflation has oscillated from energy swings and core inflation has swung on special factors. Still, the argument can be made that inflation is nudging upward although it is still below Fed goal.
This week's focus is on housing and manufacturing. Last week's housing starts report notably disappointed and existing and new home sales will garner attention. Also, home price appreciation has softened and the FHFA home price report will add detail on strength in housing demand. Recent manufacturing data have been mixed with August industrial production soft but Empire State and Philly Fed for September somewhat positive. This week's durables report may add clarity regarding momentum at the national level.
The Chicago Fed National Activity Index rose to plus 0.39 in July versus a revised plus 0.21 in June. The 3-month average, at plus 0.25 versus June's revised plus 0.16, was over breakeven zero for a fifth month in a row. Three of four components were in the plus column for July led by production-related indicators that reflected strength in manufacturing. Employment-related indicators were next as a dip in jobless claims helped offset an uptick in the unemployment rate. Sales/orders/inventories contributed fractionally to the July index while consumption & housing remained the weak component, subtracting slightly from July's index.
Chicago Fed National Activity Index Consensus Forecast for August 14: 0.35
Range: 0.35 to 0.42
Existing home sales in July advanced 2.4 percent to an annualized pace of 5.15 million units. June rose a revised 2.4 percent to a marginally downwardly revised 5.03 million. July sales were down 4.3 percent on a year-ago basis. July's figure puts existing home sales back at the pace last seen in October 2013 before atypically adverse winter weather undercut sales. For the latest month, strength was in the single-family component which gained 2.7 percent to 4.55 million annualized. Condos were unchanged at 0.60 million. Supply on the market actually rose faster than sales-up 3.5 percent in July to 2.37 million units. Months' supply, however, was steady at 5.5 months.
Existing home sales Consensus Forecast for August 14: 5.18 million-unit rate
Range: 5.00 to 5.27 million-unit rate
The FHFA purchase only house price index improved in June with a rise of 0.4 percent, compared to 0.2 percent in May. But the year-ago rate slowed to 5.1 percent from 5.3 percent in May. Regionally, nine Census regions showed gains in June; two declined; and one was unchanged. Overall, home prices are sputtering.
FHFA purchase only house price index Consensus Forecast for July 14: +0.4 percent
Range: +0.3 to +0.6 percent
The Markit PMI manufacturing index (final) accelerated in August, to a final 57.9 versus a mid-month reading of 58.0 and a final July reading to 55.8. The report noted strength for new orders, especially a pickup for export orders, as well as strength for production and employment.
Markit PMI manufacturing flash index Consensus Forecast for September 14: 58.1
Range: 56.2 to 59.0
The Richmond Fed manufacturing index for August was up a solid 5 points to 12. Order data led the report with the new orders index up a very strong 8 points to 13 and backlog orders also up, to 15 versus July's reading of zero. Most details were also positive. Shipments were up, capacity utilization was up, and the workweek was up.
Richmond Fed manufacturing index Consensus Forecast for September 14: 12
Range: 8 to 15
New home sales for July posted at a lower-than-expected 412,000 annual sales rate. But the two prior months were revised higher by a total of 28,000. July's gain was centered entirely in the South which rose 8.1 percent in the month. The South is by far the largest region for new home sales, outdistancing all other regions combined. Lack of new homes on the market had been constraining sales but increasingly less so. Supply on the market rose to 205,000 versus 197,000 in June, pulling up the monthly supply to 6.0 months at the current sales rate vs 5.6 in June.
New home sales Consensus Forecast for August 14: 430 thousand-unit annual rate
Range: 407 thousand to 465 thousand-unit annual rate
Durable goods orders soared in July due to aircraft orders but otherwise came off a moderately strong core number in June. New factory orders for durables soared a monthly 22.6 percent in July, following a 2.7 percent boost in June. Excluding transportation, durables orders slipped 0.7 percent, following a 3.0 boost in June. Transportation spiked a monthly 74.1 percent after rising 2.2 percent in June. Nondefense aircraft (Boeing) surged 317.3 percent (that is not a typo) after gaining 11.2 percent in June. Another but more moderate positive was motor vehicle orders which gained 7.3 percent, following a 0.9 percent rise in June. Defense aircraft fell 29.1 percent in July, following a rise of 9.5 percent the month before. Outside of transportation, gains were limited.
New orders for durable goods Consensus Forecast for August 14: -17.1 percent
Range: -20.0 percent to +3.5 percent
New orders for durable goods, ex-trans., Consensus Forecast for August 14: +0.8 percent
Range: 0.2 percent to 2.0 percent
Initial jobless claims fell a very steep 36,000 to a much lower-than-expected level of 280,000 in the September 13 week, which is the same week as the government's sample period for the September employment report. This is the second lowest level of the recovery. The 4-week average fell 4,750 to 299,500 which is among the lowest levels of the recovery and was down 1,500 from the 4-week average in the August sample week. In a confirmation of improvement, continuing claims also continued to move lower.
Jobless Claims Consensus Forecast for 9/20/14: 300,000
Range: 295,000 to 310,000
The Markit PMI services index finished August at 59.5, up 1.0 point from the mid-month flash but down 1.3 points from July. Details of the report are not offered to the public but the general description was upbeat, citing strength in business activity and employment. The report also noted that cost inflation increased in August from a 15-month low in July.
Markit PMI services index (flash) Consensus Forecast for September 14: 61.0
Range: 60.0 to 61.0
The Kansas City Fed manufacturing index was 3 in August, down from 9 in July and 6 in June. The overall slowing in manufacturing activity occurred at nondurable goods producers, while durable goods production increased somewhat. Most month-over-month indexes fell compared to July's readings. The production index fell from 11 to 4, and the shipments and new orders indexes also declined but remained above zero. Future factory indexes were mixed in August. The future composite index edged up from 15 to 17, and the future production, new orders, and order backlog indexes also rose.
Kansas City Fed manufacturing index Consensus Forecast for September 14: 8
Range: 4 to 10
GDP growth for the second quarter was higher than expected. The second estimate for second quarter GDP growth came in at 4.2 percent annualized versus a 4.0 percent forecast and coming off a 2.1 percent weather related drop in the first quarter. With this second estimate for the second quarter, the general picture of economic growth remained the same; the increase in nonresidential fixed investment was larger than previously estimated, while the increase in private inventory investment was smaller than previously estimated. Real final sales of domestic product-GDP less change in private inventories-increased 2.8 percent in the second quarter, in contrast to a decrease of 1.0 percent in the first. Real final sales to domestic purchasers gained 3.1 percent versus 0.7 in the first quarter. Chain-weighted prices gained 2.1 percent annualized, compared to the consensus for 2.0 percent and the first quarter number of 1.3 percent.
Real GDP Consensus Forecast for third estimate Q2 14: +4.6 percent annual rate
Range: +4.3 to +5.0 percent annual rate
GDP price index Consensus Forecast for third estimate Q2 14: +2.1 percent annual rate
Range: +2.1 to +2.2 percent annual rate
The Reuters/University of Michigan's consumer sentiment index in early September climbed to 84.6 versus a final August reading of 82.5 and a mid-month August reading of 79.2. The gain, however, was centered in the expectations component, not the current conditions component which slipped to 98.5 vs 99.8 in final August and 99.6 in mid-month August. But the gain in expectations, to 75.6 versus 71.3 in final August and well up from 66.2 in mid-month August, does point to long-term confidence in the jobs and income outlooks.
Consumer sentiment index Consensus Forecast for final September 14: 84.6
Range: 83.0 to 86.5
R. Mark Rogers is the author of The Complete Idiot's Guide to Economic Indicators, Penguin Books.
He can also be found on a weekly broadcast talking about the U.S. economy, the easiest way to find him is by going to iTunes and searching for "Simply Economics."
Econoday Senior Writer Mark Pender contributed to this article.
|
