|
Indications of slowing growth in Europe and Asia continue to build and with them talk of easier monetary policy. GDP in the Eurozone slowed to a 5-year low in the fourth quarter with Italy falling into technical recession and France being pulled down by street demonstrations. The prior week saw a long-term low for Chinese growth with the latest week showing a slowdown in Japanese production and retail sales. On Thursday, Bank of Japan Deputy Governor Masayoshi Amamiya warned that lack of strength in consumer prices may wear on even longer than expected despite the bank's sustained stimulus.
Geopolitical headlines were heavy at midweek following a new set of Brexit votes, the significance of which is unclear, and what may have been a constructive round of trade dialogue between the U.S. and China. Late in the week U.S. economic news dominated the markets as the Federal Reserve changed guidance and stepped back from new rate hikes, at least for now, and the Labor Department reported unusual and unexpected job growth – and growth without accelerating wage inflation. Strength in the U.S. is standing in greater and greater contrast to weakness in Europe and Asia.
| |
|
2018 |
2019 |
% Change |
|
Index |
End 2018 |
Jan 25 |
Feb 1 |
Week |
Jan |
2019 |
| Asia/Pacific |
|
|
|
|
|
|
|
| Australia |
All Ordinaries |
5709.4 |
5971.1 |
5935.3 |
-0.6% |
4.0% |
4.0% |
| Japan |
Nikkei 225 |
20014.8 |
20773.6 |
20788.4 |
0.1% |
3.8% |
3.9% |
|
Topix |
1494.09 |
1566.10 |
1564.6 |
-0.1% |
4.9% |
4.7% |
| Hong Kong |
Hang Seng |
25845.7 |
27569.2 |
27930.7 |
1.3% |
8.1% |
8.1% |
| S. Korea |
Kospi |
2041.0 |
2177.7 |
2203.5 |
1.2% |
8.0% |
8.0% |
| Singapore |
STI |
3068.8 |
3202.3 |
3188.7 |
-0.4% |
4.0% |
3.9% |
| China |
Shanghai Composite* |
2493.9 |
2601.7 |
2618.2 |
0.6% |
3.6% |
5.0% |
|
|
|
|
|
|
|
|
| India |
Sensex 30 |
36068.3 |
36025.54 |
36469.4 |
1.2% |
0.5% |
1.1% |
| Indonesia |
Jakarta Composite |
6194.5 |
6482.8 |
6538.6 |
0.9% |
5.5% |
5.6% |
| Malaysia |
KLCI |
1690.6 |
1701.0 |
1683.5 |
-1.0% |
-0.4% |
-0.4% |
| Philippines |
PSEi |
7466.0 |
8053.2 |
8144.2 |
1.1% |
7.3% |
9.1% |
| Taiwan |
Taiex |
9727.4 |
9969.6 |
9932.3 |
-0.4% |
2.1% |
2.1% |
| Thailand |
SET |
1563.9 |
1623.6 |
1651.4 |
1.7% |
5.0% |
5.6% |
|
|
|
|
|
|
|
|
| Europe |
|
|
|
|
|
|
|
| UK |
FTSE 100 |
6728.1 |
6809.2 |
7020.2 |
3.1% |
3.6% |
4.3% |
| France |
CAC |
4730.7 |
4925.8 |
5019.3 |
1.9% |
5.5% |
6.1% |
| Germany |
XETRA DAX |
10559.0 |
11281.8 |
11180.7 |
-0.9% |
5.8% |
5.9% |
| Italy |
FTSE MIB |
18324.0 |
19810.5 |
19576.8 |
-1.2% |
7.7% |
6.8% |
| Spain |
IBEX 35 |
8539.9 |
9185.2 |
9019.4 |
-1.8% |
6.1% |
5.6% |
| Sweden |
OMX Stockholm 30 |
1408.7 |
1501.1 |
1525.7 |
1.6% |
7.6% |
8.3% |
| Switzerland |
SMI |
8429.3 |
8922.5 |
8996.4 |
0.8% |
6.4% |
6.7% |
|
|
|
|
|
|
|
|
| North America |
|
|
|
|
|
|
|
| United States |
Dow |
23327.5 |
24737.2 |
25063.9 |
1.3% |
7.2% |
7.4% |
|
NASDAQ |
6635.3 |
7164.9 |
7263.9 |
1.4% |
9.7% |
9.5% |
|
S&P 500 |
2506.9 |
2664.8 |
2706.5 |
1.6% |
7.9% |
8.0% |
| Canada |
S&P/TSX Comp. |
14322.9 |
15366.1 |
15506.3 |
0.9% |
8.5% |
8.3% |
| Mexico |
Bolsa |
41640.3 |
43638.6 |
43788.8 |
0.3% |
5.6% |
5.2% |
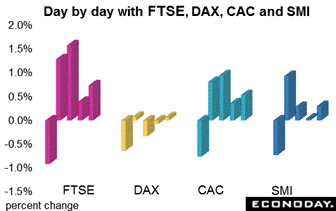 Weak GDP data for the fourth quarter followed by weak PMI data for January did not hold back European equities, at least for the most part. After opening the week lower amid the talk of trouble for chipmakers and industrials, European shares rallied at midweek and got a lift late in the Thursday session on the Fed's downshift to neutral, a dovish move seems to dovetail with emerging talk for possible easing by the European Central Bank. At its meeting late last month, the ECB acknowledged downside risks to its projections. Weak GDP data for the fourth quarter followed by weak PMI data for January did not hold back European equities, at least for the most part. After opening the week lower amid the talk of trouble for chipmakers and industrials, European shares rallied at midweek and got a lift late in the Thursday session on the Fed's downshift to neutral, a dovish move seems to dovetail with emerging talk for possible easing by the European Central Bank. At its meeting late last month, the ECB acknowledged downside risks to its projections.
There were a lot of headlines out of the UK but no apparent progress for Brexit. Parliament voted to keep the March 29 deadline in place but also voted in favor of changing the Irish backstop plan to prevent a hard border between Northern Ireland and the Republic of Ireland. Yet the European Union is adamant that it will not reopen negotiations, a stance echoed at midweek by French President Emmanuel Macron. Though UK Prime Minister Theresa May is certain to push hard for new talks in the coming days and weeks, the risk of a hard Brexit appears to be building with each passing day. Industry groups in both the UK and the continent, not to mention the governments themselves, say they are accelerating their no-deal contingencies.
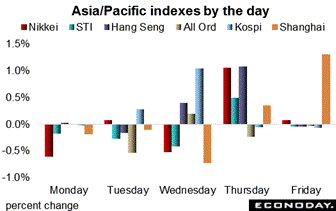 Asian shares were flat early in the week, showing little reaction to the reopening of the U.S. government and pressured, as elsewhere, by concerns over industrial profits. Trade optimism began to emerge at mid-week after Apple CEO Tim Cook said U.S.-Chinese tensions were easing in what foreshadowed the subsequent reports of trade progress. But it was the Fed's decision that set shares moving as they mostly rallied on Thursday. However subdued economic growth may be, Asian shares have gotten out to a fast 2019 start led by the Hang Seng and Kospi with respective year-to-date gains of 8.1 and 8.0 percent. Note that Asia's markets did not have the chance to react to Friday's U.S. employment report. Asian shares were flat early in the week, showing little reaction to the reopening of the U.S. government and pressured, as elsewhere, by concerns over industrial profits. Trade optimism began to emerge at mid-week after Apple CEO Tim Cook said U.S.-Chinese tensions were easing in what foreshadowed the subsequent reports of trade progress. But it was the Fed's decision that set shares moving as they mostly rallied on Thursday. However subdued economic growth may be, Asian shares have gotten out to a fast 2019 start led by the Hang Seng and Kospi with respective year-to-date gains of 8.1 and 8.0 percent. Note that Asia's markets did not have the chance to react to Friday's U.S. employment report.
The outlook for a trade agreement between the U.S. and China brightened noticeably in the week. Both sides said talks on Wednesday and Thursday went well though structural changes in China, including reduced subsidies to industry and greater protection for intellectual property, appear to be sticking points. Later this month, and against a March 2 deadline imposed by the U.S., the two sides are expected to begin more detailed negotiations ahead of an expected meeting between Presidents Donald Trump and Xi Jinping .
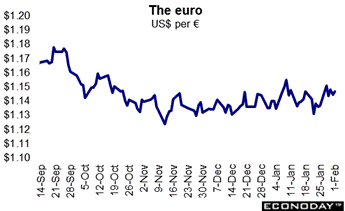 The euro got a lift in the week, rising 0.5 percent to $1.1459 and helped by the Federal Reserve's policy shift to neutral. Yet talk that accommodation may be the next move from the European Central Bank may act to limit the euro's rally against the dollar. Pound sterling fell 0.9 percent against the dollar in week to $1,2740 but here issues of comparative interest rates with other currencies is taking a back seat to Brexit and whether the UK can secure a new arrangement with the European Union before the March 29 deadline. Commodity currencies including the Australian, New Zealand, and Canadian dollars all had a strong week in line with gains for commodities that included not only gold but also oil which rose solidly as Brent, at US$58.50 has extended its year-to-date rally to nearly $10. The euro got a lift in the week, rising 0.5 percent to $1.1459 and helped by the Federal Reserve's policy shift to neutral. Yet talk that accommodation may be the next move from the European Central Bank may act to limit the euro's rally against the dollar. Pound sterling fell 0.9 percent against the dollar in week to $1,2740 but here issues of comparative interest rates with other currencies is taking a back seat to Brexit and whether the UK can secure a new arrangement with the European Union before the March 29 deadline. Commodity currencies including the Australian, New Zealand, and Canadian dollars all had a strong week in line with gains for commodities that included not only gold but also oil which rose solidly as Brent, at US$58.50 has extended its year-to-date rally to nearly $10.
|
|
2018 |
2019 |
% Change |
|
|
31-Dec |
Jan 25 |
Feb 1 |
Week |
Year |
| U.S. $ per currency |
|
|
|
|
|
|
| Australia |
A$ |
0.704 |
0.718 |
0.7261 |
1.1% |
3.2% |
| New Zealand |
NZ$ |
0.682 |
0.684 |
0.6898 |
0.8% |
1.2% |
| Canada |
C$ |
0.737 |
0.756 |
0.7639 |
1.0% |
3.6% |
| Eurozone |
euro (€) |
1.145 |
1.141 |
1.1459 |
0.4% |
0.1% |
| UK |
pound sterling £) |
1.274 |
1.320 |
1.3080 |
-0.9% |
2.7% |
|
|
|
|
|
|
|
| Currency per U.S. $ |
|
|
|
|
|
|
| China |
yuan |
6.879 |
6.748 |
6.7422 |
0.1% |
2.0% |
| Hong Kong |
HK$* |
7.830 |
7.845 |
7.8473 |
0.0% |
-0.2% |
| India |
rupee |
69.435 |
71.170 |
71.2550 |
-0.1% |
-2.6% |
| Japan |
yen |
109.940 |
109.470 |
109.5100 |
0.0% |
0.4% |
| Malaysia |
ringgit |
4.134 |
4.126 |
4.0953 |
0.7% |
0.9% |
| Singapore |
Singapore $ |
1.362 |
1.353 |
1.3507 |
0.2% |
0.8% |
| South Korea |
won |
1113.900 |
1121.250 |
1119.0100 |
0.2% |
-0.5% |
| Taiwan |
Taiwan $ |
30.572 |
30.817 |
30.7360 |
0.3% |
-0.5% |
| Thailand |
baht |
32.366 |
31.521 |
31.2990 |
0.7% |
3.4% |
| Switzerland |
Swiss franc |
0.979 |
0.993 |
0.9950 |
-0.2% |
-1.7% |
| *Pegged to U.S. dollar |
|
|
|
|
|
|
| Source: Bloomberg |
|
|
|
|
|
|
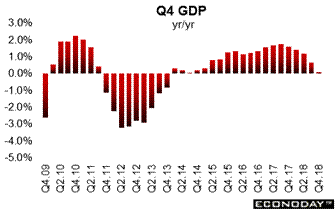
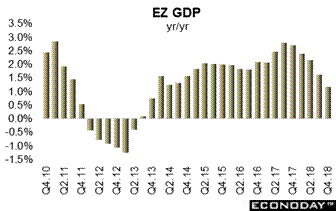 Flash GDP expanded just 0.2 percent versus the third quarter, in line with both that period's unrevised outturn and market expectations. Annual growth declined from 1.6 percent to only 1.2 percent, its weakest result since fourth-quarter 2013. Calendar year 2018 growth was 1.8 percent. Details are scant in flash reports but the indications are clear and confirm a subdued 2018 climax for Eurozone economic activity that underscores the ECB's decision to acknowledge downside risks to its own economic projections. Flash GDP expanded just 0.2 percent versus the third quarter, in line with both that period's unrevised outturn and market expectations. Annual growth declined from 1.6 percent to only 1.2 percent, its weakest result since fourth-quarter 2013. Calendar year 2018 growth was 1.8 percent. Details are scant in flash reports but the indications are clear and confirm a subdued 2018 climax for Eurozone economic activity that underscores the ECB's decision to acknowledge downside risks to its own economic projections.
 Fourth-quarter GDP beat expectations but still proved soft due partly to Paris protests as well as new rules on vehicle emissions. The economy expanded at a 0.3 percent quarterly rate at the end of 2018 matching the increase in the prior quarter reduced annual growth from 1.3 percent to just 0.9 percent, equaling its weakest result since second-quarter 2014. Calendar year growth was just 1.5 percent after 2.3 percent in 2017. Household consumption fell to zero from 0.4 percent in the third quarter and similarly, gross fixed investment fell from 1.0 to 0.2 percent. Within the latter, residential investment fell a further 0.4 percent while business spending was down 1.4 percentage points to 0.3 percent. The economy would have struggled .more but for a 0.2 percentage point boost from net foreign trade reflecting a 2.4 percent bounce in exports. Fourth-quarter GDP beat expectations but still proved soft due partly to Paris protests as well as new rules on vehicle emissions. The economy expanded at a 0.3 percent quarterly rate at the end of 2018 matching the increase in the prior quarter reduced annual growth from 1.3 percent to just 0.9 percent, equaling its weakest result since second-quarter 2014. Calendar year growth was just 1.5 percent after 2.3 percent in 2017. Household consumption fell to zero from 0.4 percent in the third quarter and similarly, gross fixed investment fell from 1.0 to 0.2 percent. Within the latter, residential investment fell a further 0.4 percent while business spending was down 1.4 percentage points to 0.3 percent. The economy would have struggled .more but for a 0.2 percentage point boost from net foreign trade reflecting a 2.4 percent bounce in exports.
 Italy fell back into technical recession last quarter. Total output provisionally fell a slightly steeper than expected 0.2 percent versus the July-September period when it contracted an unrevised 0.1 percent. As a result, annual workday adjusted growth only just kept its head above water at a minimal 0.1 percent, down from 0.6 percent last time. There are no GDP expenditure details available in the flash report but Istat did indicate that domestic demand made a negative contribution. From the output side, there were falls in industrial production and agriculture, forestry and fishing while services were essentially flat. Italy fell back into technical recession last quarter. Total output provisionally fell a slightly steeper than expected 0.2 percent versus the July-September period when it contracted an unrevised 0.1 percent. As a result, annual workday adjusted growth only just kept its head above water at a minimal 0.1 percent, down from 0.6 percent last time. There are no GDP expenditure details available in the flash report but Istat did indicate that domestic demand made a negative contribution. From the output side, there were falls in industrial production and agriculture, forestry and fishing while services were essentially flat.
 Retail sales in Japan increased 1.3 percent on the year in December, down slightly from 1.4 percent in November but above the consensus for 0.9 percent. This is the weakest year-on-year growth since May 2018. Seasonally-adjusted retail sales rose 0.9 percent on the month after falling 1.1 percent previously. The drop in headline retail sales was broad-based with weaker growth recorded in most major categories of spending. Motor vehicles sales increased 3.7 percent on the year in December, down from 5.1 percent in November, while the year-on-year increase in fuel sales slowed from 8.4 percent to 4.2 percent. Growth in food and beverage sales also moderated from 0.8 percent to 0.2 percent. Retail sales in Japan increased 1.3 percent on the year in December, down slightly from 1.4 percent in November but above the consensus for 0.9 percent. This is the weakest year-on-year growth since May 2018. Seasonally-adjusted retail sales rose 0.9 percent on the month after falling 1.1 percent previously. The drop in headline retail sales was broad-based with weaker growth recorded in most major categories of spending. Motor vehicles sales increased 3.7 percent on the year in December, down from 5.1 percent in November, while the year-on-year increase in fuel sales slowed from 8.4 percent to 4.2 percent. Growth in food and beverage sales also moderated from 0.8 percent to 0.2 percent.
 Japan's industrial production index fell a preliminary 0.1 percent in December (seasonally adjusted) after falling 1.0 percent in November. In year-on-year terms, the original industrial production index dropped 1.9 percent on the year in December, weakening from an increase of 1.5 percent previously. Weaker headline industrial production reflected declines in the output of production machinery, chemicals, and electronic parts and devices. This was partly offset by increases in the output of general purpose and business oriented machinery, motor vehicles, and electrical machinery. The month-on-month drop in the industrial production index in December contrasts with the forecast officials made last month that output would increase by 2.2 percent. Japan's industrial production index fell a preliminary 0.1 percent in December (seasonally adjusted) after falling 1.0 percent in November. In year-on-year terms, the original industrial production index dropped 1.9 percent on the year in December, weakening from an increase of 1.5 percent previously. Weaker headline industrial production reflected declines in the output of production machinery, chemicals, and electronic parts and devices. This was partly offset by increases in the output of general purpose and business oriented machinery, motor vehicles, and electrical machinery. The month-on-month drop in the industrial production index in December contrasts with the forecast officials made last month that output would increase by 2.2 percent.
 The CPI rose 1.8 percent on the year in the three months to December, down slightly from 1.9 percent in the three months to September and further below the Reserve Bank of Australia's target range of 2.0 to 3.0 percent. Quarterly, the CPI rose 0.5 percent after increasing 0.4 percent previously. Reflecting lower oil prices, transport costs slowed to 2.8 percent on the year in the three months to December after increasing 6.0 percent in the prior quarter. Prices were relatively steady for other major categories including food, housing and communication. Given the monthly pull lower from oil, December's data will likely have limited impact on officials' assessment of the inflation outlook which they see at about 2.25 percent for both this year and next. The CPI rose 1.8 percent on the year in the three months to December, down slightly from 1.9 percent in the three months to September and further below the Reserve Bank of Australia's target range of 2.0 to 3.0 percent. Quarterly, the CPI rose 0.5 percent after increasing 0.4 percent previously. Reflecting lower oil prices, transport costs slowed to 2.8 percent on the year in the three months to December after increasing 6.0 percent in the prior quarter. Prices were relatively steady for other major categories including food, housing and communication. Given the monthly pull lower from oil, December's data will likely have limited impact on officials' assessment of the inflation outlook which they see at about 2.25 percent for both this year and next.
 A 0.1 percent November fall in total output was the second in the last three months and reduced annual economic growth from 2.2 percent to 1.7 percent, its weakest reading since November 2016. The monthly fall was wholly attributable to goods producing industries where output was down 0.3 percent. However, services were only flat, the first time that they have not expanded since August 2017. Manufacturing (minus 0.5 percent) had a poor month and this was compounded by weakness in both energy (minus 0.6 percent) and wholesale trade (minus 1.1 percent). The November setback leaves quarterly GDP growth on course for something around the 0.5 percent mark. A 0.1 percent November fall in total output was the second in the last three months and reduced annual economic growth from 2.2 percent to 1.7 percent, its weakest reading since November 2016. The monthly fall was wholly attributable to goods producing industries where output was down 0.3 percent. However, services were only flat, the first time that they have not expanded since August 2017. Manufacturing (minus 0.5 percent) had a poor month and this was compounded by weakness in both energy (minus 0.6 percent) and wholesale trade (minus 1.1 percent). The November setback leaves quarterly GDP growth on course for something around the 0.5 percent mark.
The week was more eventful than the action in the markets would indicate. The slowing in European economic indicators is clear and is moving across the Atlantic and making the Federal Reserve cautious on possible contagion effects for the U.S. economy. One special risk, a possible all out trade war between the U.S.-China trade, seems to be fading but another, Brexit, just seems to be building.
Policy announcements are on tap for the Reserve Bank of Australia and the Bank of England, on Monday and Thursday of the coming week, respectively. Thursday will also see industrial production from Germany, which has been week, with industrial production from France and Italy both out on Friday.
| Central Bank activities |
|
| Feb 4 |
Australia |
Reserve Bank of Australia Monetary Policy Announcement |
| Feb 7 |
UK |
Bank of England Monetary Policy Announcement & Minutes |
| |
|
|
| The following indicators will be released this week... |
| Europe |
|
|
| Feb 4 |
Italy |
Consumer Price Index (January) |
| Feb 5 |
Eurozone |
Retail Sales (December) |
| |
UK |
CIPS/PMI Services Index (January) |
| Feb 6 |
Germany |
Manufacturers' Orders (December) |
| Feb 7 |
France |
Merchandise Trade (December) |
| |
Germany |
Industrial Production (December) |
| |
Italy |
Retail Sales (December) |
| Feb 8 |
France |
Industrial Production (December) |
| |
Germany |
Merchandise Trade (December) |
| |
Italy |
Industrial Production (December) |
| |
|
|
| Asia Pacific |
|
|
| Feb 4 |
Australia |
Merchandise Trade (December) |
| |
Australia |
Retail Sales (December) |
| |
|
|
| Americas |
|
|
| Feb 5 |
Canada |
Merchandise Trade (December) |
| Feb 8 |
Canada |
Housing Starts (January) |
| |
Canada |
Labor Force Survey (January) |
|
