|
The popular step right now is to lean to the dovish side, led by the Fed's winding down of quantitative tightening and followed in the latest week by yet another rate cut from the Bank of India and acknowledgement by the Reserve Bank of Australia that downside risks are on the rise. Stock markets have been rallying strongly so far this year, not on the strength of economic data, what strength there has been, but on prospects that central bank policy, unlike last year, will remain cautious and won't be impeding growth. Unexpected weakness or unexpected strength are risks that could upset this balance, the balance between economic pace and expectations for monetary policy. Assessment and reassessment, day-to-day, is this year's theme and this week's twists and turns include a solid but mixed U.S. employment report, up-and-down data on retail, an extending slide for global manufacturing, and an outright jump in inventories.
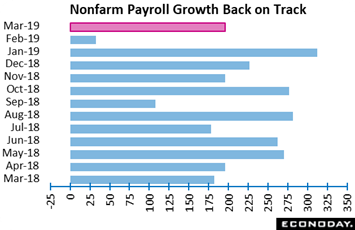 It's back to normal as nonfarm payroll bounced back to trend, up a higher-than-expected 196,000 in March vs Econoday's consensus for 170,000 and near the top of the consensus range. The data are favorable but not uniformly strong. February, which rattled the outlook with a paltry 20,000 gain, was revised higher but only slightly, now at 33,000. The payroll breakdown is mixed and highlighted once again by professional & business services, up 37,000 following February's standout 54,000 increase, a gain by the way that saved that month from payroll contraction. Increases here suggest businesses, facing strong demand, are turning to contractors to keep output going. On the less positive side, retail payrolls continue to contract, down 12,000 and 20,000 the last two months, and manufacturing, where less favorable indications have been piling up, fell 6,000 after a very thin 1,000 increase in February. It's back to normal as nonfarm payroll bounced back to trend, up a higher-than-expected 196,000 in March vs Econoday's consensus for 170,000 and near the top of the consensus range. The data are favorable but not uniformly strong. February, which rattled the outlook with a paltry 20,000 gain, was revised higher but only slightly, now at 33,000. The payroll breakdown is mixed and highlighted once again by professional & business services, up 37,000 following February's standout 54,000 increase, a gain by the way that saved that month from payroll contraction. Increases here suggest businesses, facing strong demand, are turning to contractors to keep output going. On the less positive side, retail payrolls continue to contract, down 12,000 and 20,000 the last two months, and manufacturing, where less favorable indications have been piling up, fell 6,000 after a very thin 1,000 increase in February.
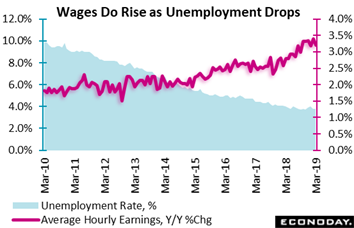 A strong positive is the unemployment rate which remains very low, unchanged at an as-expected 3.8 percent with the pool of available workers lean and drawn down only slightly to 11.4 million. Yet wage indications are favorable at least if you're on the FOMC, up a non-inflationary 0.1 percent in the month in a gain that will encourage a dovish tilt. The year-on-year rate fell 2 tenths to 3.2 percent yet, neverthless, continues to trend higher as unemployment has been coming down. As shown in the graph, the law of supply and demand has not been repealed, that the price of labor goes up when the availablity of labor goes down. For monetary policy, wage pressure may be on the rise but the pace can fairly be described as modest-to-moderate. And how much of a risk this is for general prices isn't so clear, underscored by Jerome Powell at last month's press conference who positively embraced what he described as "a significant move up" in wages the past several years. And, speaking for himself, added that the risk of rising wages feeding into overall inflation is not a concern for him. For now, wages have room to move higher. A strong positive is the unemployment rate which remains very low, unchanged at an as-expected 3.8 percent with the pool of available workers lean and drawn down only slightly to 11.4 million. Yet wage indications are favorable at least if you're on the FOMC, up a non-inflationary 0.1 percent in the month in a gain that will encourage a dovish tilt. The year-on-year rate fell 2 tenths to 3.2 percent yet, neverthless, continues to trend higher as unemployment has been coming down. As shown in the graph, the law of supply and demand has not been repealed, that the price of labor goes up when the availablity of labor goes down. For monetary policy, wage pressure may be on the rise but the pace can fairly be described as modest-to-moderate. And how much of a risk this is for general prices isn't so clear, underscored by Jerome Powell at last month's press conference who positively embraced what he described as "a significant move up" in wages the past several years. And, speaking for himself, added that the risk of rising wages feeding into overall inflation is not a concern for him. For now, wages have room to move higher.
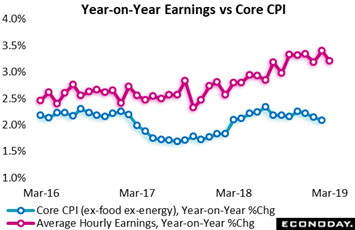 Average hourly earnings are the first definitive inflation indication in any one month. The coming week will be filled with inflation data led by consumer prices on Wednesday with expectations for all the reports steady and moderate. But moderate may be generous when describing core prices recently including (in data released in the prior week) only a 0.1 percent January increase in the core PCE index and a 2 tenths pull back in the year-on-year rate to 1.8 percent which is under the Fed's 2 percent target. The graph tracks average hourly earnings in red and the core CPI in blue which is also slumping in the 2 percent area. Expectations for the March core in the coming week are 2.1 percent which would be unchanged from February. Average hourly earnings are the first definitive inflation indication in any one month. The coming week will be filled with inflation data led by consumer prices on Wednesday with expectations for all the reports steady and moderate. But moderate may be generous when describing core prices recently including (in data released in the prior week) only a 0.1 percent January increase in the core PCE index and a 2 tenths pull back in the year-on-year rate to 1.8 percent which is under the Fed's 2 percent target. The graph tracks average hourly earnings in red and the core CPI in blue which is also slumping in the 2 percent area. Expectations for the March core in the coming week are 2.1 percent which would be unchanged from February.
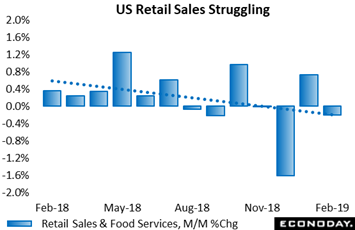 One of the weak spots of the March employment report, as it has been for many of the monthly reports, are payroll levels for retailers which have actually declined 0.9 percent from their peak in January 2017, down 142,000 payroll jobs over this period to 15.8 million in the latest data. This loss is generally attributed to the long suffering demise of brick-and-mortar stores but some of this is also likely due to the general weakness of retail sales. Retail sales have been down in two of the last three months including December's still shocking 1.6 percent plunge, a pattern that we'll see is echoed in European data. Retail sales in the U.S., after a bump higher in January, slipped 0.2 percent in February and gains, aside from autos and gasoline, are hard to find. Nonstore retailers (e-commerce) did rise a strong 0.9 percent while restaurants, at 0.1 percent, posted their first monthly gain, however marginal, since way back in October. This last detail is a reminder of just how much U.S. retailers, perhaps in slight contrast to their European counterparts, have been rattled in recent months. One of the weak spots of the March employment report, as it has been for many of the monthly reports, are payroll levels for retailers which have actually declined 0.9 percent from their peak in January 2017, down 142,000 payroll jobs over this period to 15.8 million in the latest data. This loss is generally attributed to the long suffering demise of brick-and-mortar stores but some of this is also likely due to the general weakness of retail sales. Retail sales have been down in two of the last three months including December's still shocking 1.6 percent plunge, a pattern that we'll see is echoed in European data. Retail sales in the U.S., after a bump higher in January, slipped 0.2 percent in February and gains, aside from autos and gasoline, are hard to find. Nonstore retailers (e-commerce) did rise a strong 0.9 percent while restaurants, at 0.1 percent, posted their first monthly gain, however marginal, since way back in October. This last detail is a reminder of just how much U.S. retailers, perhaps in slight contrast to their European counterparts, have been rattled in recent months.
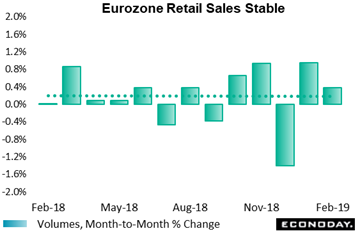 Retail sales in Europe have showed a similar pattern, marked by December's collapse followed by a rebound in January but, in contrast, a further gain for February. Up 0.4 percent, retail sales were a little stronger than expected in the month (measured here in volumes). February strength was broad based and centered in clothing and pharmaceuticals. Regionally, there were solid monthly performances by Germany (0.9 percent) and Spain (0.7 percent) but France (minus 0.1 percent) remained subdued. Retail sales in February and January are tracking above their fourth-quarter pace and barring a very sharp decline in March should be giving a boost to Eurozone GDP in the first quarter. February is really the difference between the Eurozone and U.S. reports, rising firmly in the former and sinking slightly in latter. Retail sales in Europe have showed a similar pattern, marked by December's collapse followed by a rebound in January but, in contrast, a further gain for February. Up 0.4 percent, retail sales were a little stronger than expected in the month (measured here in volumes). February strength was broad based and centered in clothing and pharmaceuticals. Regionally, there were solid monthly performances by Germany (0.9 percent) and Spain (0.7 percent) but France (minus 0.1 percent) remained subdued. Retail sales in February and January are tracking above their fourth-quarter pace and barring a very sharp decline in March should be giving a boost to Eurozone GDP in the first quarter. February is really the difference between the Eurozone and U.S. reports, rising firmly in the former and sinking slightly in latter.
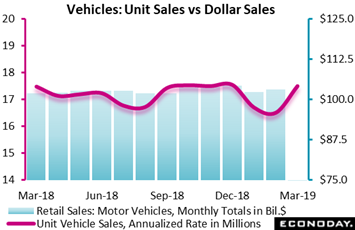 But the U.S. outlook for first-quarter consumer spending, boosted by January's rebound, is still positive and is made more positive by unit vehicle sales in March. Sales jumped very sharply in the month, to a 17.5 million annual rate vs 16.5 million in February. Though unit sales are clouded by unseparated sales to businesses, the results nevertheless point squarely to a strong vehicle contribution for the March retail sales report. Unit vehicle sales opened up the year very softly but March's results do hint at a bounce back in consumer strength. But the U.S. outlook for first-quarter consumer spending, boosted by January's rebound, is still positive and is made more positive by unit vehicle sales in March. Sales jumped very sharply in the month, to a 17.5 million annual rate vs 16.5 million in February. Though unit sales are clouded by unseparated sales to businesses, the results nevertheless point squarely to a strong vehicle contribution for the March retail sales report. Unit vehicle sales opened up the year very softly but March's results do hint at a bounce back in consumer strength.
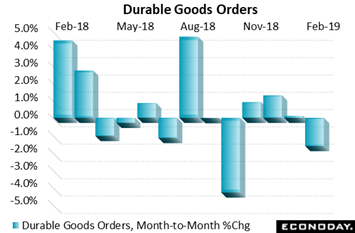 Unlike the retail sector, signals from manufacturing are more uniformly unfavorable. Durable goods orders fell 1.6 percent in February with ex-transportation, a reading that excludes aircraft, at a very thin 0.1 percent gain. Orders for core capital goods slipped 0.1 percent with unfilled core orders down 0.3 percent for a third straight month. Weakness in core capital goods data will limit expectations for first-quarter business investment. Turning to total unfilled orders, they also fell 0.3 percent and continue to trend just underwater. The lack of backlogs is definitely one factor behind the downward turn for manufacturing payrolls in the employment report. Unlike the retail sector, signals from manufacturing are more uniformly unfavorable. Durable goods orders fell 1.6 percent in February with ex-transportation, a reading that excludes aircraft, at a very thin 0.1 percent gain. Orders for core capital goods slipped 0.1 percent with unfilled core orders down 0.3 percent for a third straight month. Weakness in core capital goods data will limit expectations for first-quarter business investment. Turning to total unfilled orders, they also fell 0.3 percent and continue to trend just underwater. The lack of backlogs is definitely one factor behind the downward turn for manufacturing payrolls in the employment report.
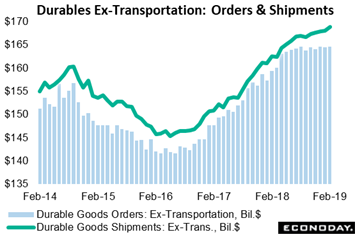 This drawdown effect is evident in the accompanying graph. The green line tacking ex-transportation shipments has been on the climb, up 0.2 percent in February to a monthly $168.8 billion while related orders have been flat, at $164.5 billion in the latest month. The difference that keeps shipments going is unfilled orders which are being worked down and keeping production busy. But the flattening of orders over the past half year is definitely a negative signal, and a signficant one for factory employment. This drawdown effect is evident in the accompanying graph. The green line tacking ex-transportation shipments has been on the climb, up 0.2 percent in February to a monthly $168.8 billion while related orders have been flat, at $164.5 billion in the latest month. The difference that keeps shipments going is unfilled orders which are being worked down and keeping production busy. But the flattening of orders over the past half year is definitely a negative signal, and a signficant one for factory employment.
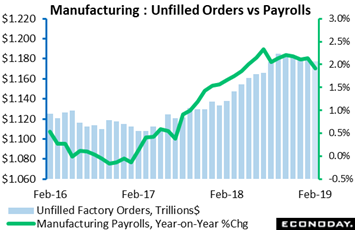 This graph compares the two, unfilled orders in the blue columns and the green line of year-on-year change in manufacturing payrolls. Unfilled orders, in contrast to new orders, have been on the decline, falling to a total $1.178 trillion in February from a peak of $1.185 trillion in September for a 3.1 percent dip. Manufacturing payrolls haven't done much better, still growing but leveling at 12.8 million in recent months and at a 1.9 percent year-on-year pace vs a mid-year 2018 peak of 2.4 percent. Whatever the outlook for total 2019 payroll growth, it doesn't look like manufacturing will be pulling its own weight. This graph compares the two, unfilled orders in the blue columns and the green line of year-on-year change in manufacturing payrolls. Unfilled orders, in contrast to new orders, have been on the decline, falling to a total $1.178 trillion in February from a peak of $1.185 trillion in September for a 3.1 percent dip. Manufacturing payrolls haven't done much better, still growing but leveling at 12.8 million in recent months and at a 1.9 percent year-on-year pace vs a mid-year 2018 peak of 2.4 percent. Whatever the outlook for total 2019 payroll growth, it doesn't look like manufacturing will be pulling its own weight.
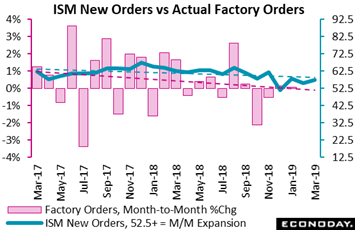 But not all of the week's manufacturing indications were unfavorable. The ISM index opened the week with a surprise, coming in at the high end of expectations at 55.3 in March but with employment up sharply in what, as it turned out, was a false signal for factory payrolls in the March employment report. New orders in the ISM report (blue line) rose solidly to 57.4 and well above the 52.5 monthly expansion line as defined by the Bureau of Economic Analysis. Yet this reading has been above the line all along, this while actual factory orders (red bars) have fallen into monthly decline nearly as much as they've climbed. Perhaps trends are what we should look at when comparing these two series but here message is hazy with ISM orders still rising though at a slowing pace while actual growth in orders has faded to the flat line. The strength of ISM's sample may be the last hold out for a manufacturing sector where growth in orders is becoming scarce, and in Germany very scarce indeed. But not all of the week's manufacturing indications were unfavorable. The ISM index opened the week with a surprise, coming in at the high end of expectations at 55.3 in March but with employment up sharply in what, as it turned out, was a false signal for factory payrolls in the March employment report. New orders in the ISM report (blue line) rose solidly to 57.4 and well above the 52.5 monthly expansion line as defined by the Bureau of Economic Analysis. Yet this reading has been above the line all along, this while actual factory orders (red bars) have fallen into monthly decline nearly as much as they've climbed. Perhaps trends are what we should look at when comparing these two series but here message is hazy with ISM orders still rising though at a slowing pace while actual growth in orders has faded to the flat line. The strength of ISM's sample may be the last hold out for a manufacturing sector where growth in orders is becoming scarce, and in Germany very scarce indeed.
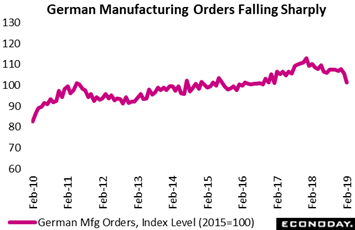 Prospects for Germany's factory sector deteriorated still further in February. Following a 2.1 percent monthly drop in January, manufacturing orders fell another 4.2 percent for the third drop in the last four months and the weakest performance since January 2017. Annual growth slumped from minus 3.6 percent to minus 7.3 percent, its ninth successive month under water and easily its worst reading over the period. The latest monthly fall was led by capital goods, which nosedived 6.0 percent with both intermediates (minus 0.9 percent) and consumer goods (minus 3.5 percent) similarly losing further ground. The main area of weakness was overseas where the market contracted some 6.0 percent (with Eurozone at minus 2.9 percent) and with domestic demand also decreasing, down 1.6 percent having already shrunk 1.4 percent in January. The drop in German manufacturing orders is one of the most striking of any economic graph right now and offers firm evidence that global cross-border trade is on the defensive. Prospects for Germany's factory sector deteriorated still further in February. Following a 2.1 percent monthly drop in January, manufacturing orders fell another 4.2 percent for the third drop in the last four months and the weakest performance since January 2017. Annual growth slumped from minus 3.6 percent to minus 7.3 percent, its ninth successive month under water and easily its worst reading over the period. The latest monthly fall was led by capital goods, which nosedived 6.0 percent with both intermediates (minus 0.9 percent) and consumer goods (minus 3.5 percent) similarly losing further ground. The main area of weakness was overseas where the market contracted some 6.0 percent (with Eurozone at minus 2.9 percent) and with domestic demand also decreasing, down 1.6 percent having already shrunk 1.4 percent in January. The drop in German manufacturing orders is one of the most striking of any economic graph right now and offers firm evidence that global cross-border trade is on the defensive.
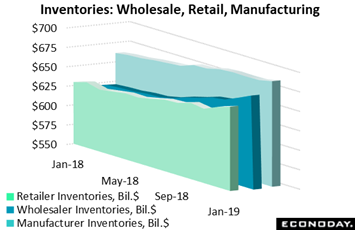 We end the economic rundown on another downbeat note and one that's a sleeper, the often overlooked business inventories report. U.S. inventories are rising at a much faster pace than sales which may very well be an emerging red flag for the economy as a whole. Business inventories jumped 0.8 percent in January to far exceed expectations while, in constrast, underlying sales rose only 0.3 percent after falling 0.9 percent in December. And in a rare inversion not consistent with lean management, growth in year-on-year inventories is ahead of sales, at 5.3 percent vs 2.8 percent. Wholesalers have been dealing with the biggest inventory build, rising 1.2 and 1.1 percent the last two reports. But goods are also stacking up on the shelves of retailers with gains of 0.8 and 1.1 percent. And manufacturers are not immune with their inventories up the last two months as well. Given that consumer trends are slowing and business spending is flat, there's every indication to suspect that the inventory build underway is not wanted and that, in turn, slowing for production and employment growth may be rising risks for the economy. We end the economic rundown on another downbeat note and one that's a sleeper, the often overlooked business inventories report. U.S. inventories are rising at a much faster pace than sales which may very well be an emerging red flag for the economy as a whole. Business inventories jumped 0.8 percent in January to far exceed expectations while, in constrast, underlying sales rose only 0.3 percent after falling 0.9 percent in December. And in a rare inversion not consistent with lean management, growth in year-on-year inventories is ahead of sales, at 5.3 percent vs 2.8 percent. Wholesalers have been dealing with the biggest inventory build, rising 1.2 and 1.1 percent the last two reports. But goods are also stacking up on the shelves of retailers with gains of 0.8 and 1.1 percent. And manufacturers are not immune with their inventories up the last two months as well. Given that consumer trends are slowing and business spending is flat, there's every indication to suspect that the inventory build underway is not wanted and that, in turn, slowing for production and employment growth may be rising risks for the economy.
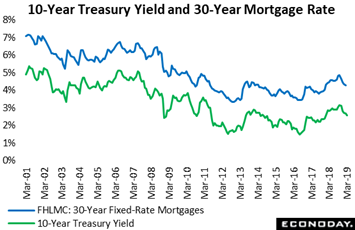 The very visible effect of economic slowing and the downward shift in monetary policy is the recent drop in long-term bond rates. Both the 10-year Treasury as tracked in the green line and mortgage rates as tracked in blue have entered a steep decline. Lower mortgage rates made for an enormous and very rare 39 percent surge, just in the latest week, in refinancing applications as tracked by the Mortgage Bankers Association. Applications for home purchases have also been on the climb. However much the consumer sector is uneven or the manufacturing sector is flattening, the downturn for the housing sector, which is entering the Spring selling season on supercharged fuel, may be a thing of the past. Treasury yields did, however, back up in the latest week which may or may not cool immediate demand for mortgages. The 10-year yield rose 8 basis points in the week to 2.49 percent as bonds were sold to buy stocks where gains have been robust. The Dow rose 1.9 percent on the week for a year-to-date 13.3 percent gain and in no surprise the Nasdaq is way out ahead, up 2.7 percent in the week and 19.6 percent on the year. The very visible effect of economic slowing and the downward shift in monetary policy is the recent drop in long-term bond rates. Both the 10-year Treasury as tracked in the green line and mortgage rates as tracked in blue have entered a steep decline. Lower mortgage rates made for an enormous and very rare 39 percent surge, just in the latest week, in refinancing applications as tracked by the Mortgage Bankers Association. Applications for home purchases have also been on the climb. However much the consumer sector is uneven or the manufacturing sector is flattening, the downturn for the housing sector, which is entering the Spring selling season on supercharged fuel, may be a thing of the past. Treasury yields did, however, back up in the latest week which may or may not cool immediate demand for mortgages. The 10-year yield rose 8 basis points in the week to 2.49 percent as bonds were sold to buy stocks where gains have been robust. The Dow rose 1.9 percent on the week for a year-to-date 13.3 percent gain and in no surprise the Nasdaq is way out ahead, up 2.7 percent in the week and 19.6 percent on the year.
| Markets at a Glance |
Year-End |
Week Ended |
Week Ended |
Year-To-Date |
Weekly |
|
2018 |
29-Mar-19 |
5-Apr-19 |
Change |
Change |
| DJIA |
23,327.46 |
25,928.68 |
26,424.99 |
13.3% |
1.9% |
| S&P 500 |
2,506.85 |
2,834.40 |
2,892.74 |
15.4% |
2.1% |
| Nasdaq Composite |
6,635.28 |
7,729.32 |
7,938.69 |
19.6% |
2.7% |
|
|
|
|
|
|
| Crude Oil, WTI ($/barrel) |
$45.84 |
$60.17 |
$63.29 |
38.1% |
5.2% |
| Gold (COMEX) ($/ounce) |
$1,284.70 |
$1,296.90 |
$1,295.80 |
0.9% |
-0.1% |
|
|
|
|
|
|
| Fed Funds Target |
2.25 to 2.50% |
2.25 to 2.50% |
2.25 to 2.50% |
0 bp |
0 bp |
| 2-Year Treasury Yield |
2.50% |
2.27% |
2.34% |
−16 bp |
7 bp |
| 10-Year Treasury Yield |
2.68% |
2.41% |
2.49% |
−19 bp |
8 bp |
| Dollar Index |
96.11 |
96.83 |
97.00 |
0.9% |
0.2% |
"Data-driven" is our slogan for 2019 with negative forces and positive ones appearing to be holding right now in a delicate equilibrium. The strength of the labor market is the fundamental underpinning for the whole outlook though stalling in global trade, as illustrated in German orders data, appears to be an increasing negative for the global manufacturing sector and the U.S. sector along with it. For central bank policy, including Fed policy, it's wait-and-see with hikes not even a possibliity and with further stimulus not needed, at least for now.
*Jeremy Hawkins contributed to this article
What is expected to be a very soft factory orders report opens the week on Monday for a sector where few indications are pointing to much strength at all. JOLTS follows on Tuesday and continuing gains in job openings should send further signals of labor market strength following March's recovery in payroll growth. A host of inflation reports will be posted in the week starting with consumer prices on Wednesday, producer prices on Thursday, and import & export prices on Friday all of which are expected to show modest-to-moderate pressures in line with the Federal Reserve's 2 percent target. FOMC minutes will be out Wednesday afternoon from a March meeting that saw the Fed step back from any rate hikes this year and announce exit plans from quantitative tightening, the latter tripping a major run into the bond market that continues to be felt. The monthly Treasury Budget will also be released Wednesday and another swollen deficit is the call. A wild card on Wednesday as well as Thursday and Friday will be Jerome Powell's attendance at a 3-day Democratic caucus retreat in Virginia where he is expected to speak about the economy. Retail sales for March will be the following week's highlight with the current week capped off on Friday by what is expected to be another solid showing for consumer sentiment. Global events also look to highlight the week including German merchandise trade on Monday, where signs of export weakening will be watched for, followed on Wednesday by the European Central Bank meeting where no changes are expected. Chinese merchandise trade will be posted late in the week and could affect Friday's markets.
Factory Orders for February
Consensus Forecast, Month-to-Month Change: -0.5%
Consensus Range: -1.6% to 0.2%
The advance headline of the durables side of the February factory orders report fell 1.6 percent while ex-transportation orders managed a 0.1 percent increase with core capital goods orders, however, down 0.1 percent. Forecasters see factory orders in February, which will include initial data on non-durable goods, falling 0.5 percent.
Small Business Optimism Index for March
Consensus Forecast: 102.0
Consensus Range: 100.8 to 105.0
After a lower-than-expected February, forecasters see the small business optimism index coming in March at 102.0 in what would be a small 0.3 point gain. Employment plans have fallen the last two reports though the economic outlook did bounce back in February.
JOLTS: Job Openings for February
Consensus Forecast: 7.565 million
Consensus Range: 7.100 to 7.581 million
Payroll growth proved solid in March and points to continued strength for February's job openings in the JOLTS report, at a consensus 7.565 million vs 7.581 million in January that easily beat expectations.
Consumer Price Index for March
Consensus Forecast, Month-to-Month Change: 0.3%
Consensus Range: 0.2% to 0.5%
Consumer Price Index
Consensus Forecast, Year-on-Year Change: 1.8%
Consensus Range: 1.7% to 2.1%
CPI Core, Less Food & Energy
Consensus Forecast, Month-to-Month Change: 0.2%
Consensus Range: 0.2% to 0.2%
CPI Core, Less Food & Energy
Consensus Forecast, Year-on-Year Change: 2.1%
Consensus Range: 2.1% to 2.2%
The expectation for March is more life for the core CPI at a consensus 0.2 percent gain after unexpectedly slowing in February to only a 0.1 percent increase as medical costs shifted into reverse. The year-on-year core is seen unchanged at 2.1 percent while the overall CPI is expected to rise a monthly 0.3 percent with this year-on-year rate seen at 1.8 percent.
FOMC Minutes
Released for the March 19 & 20 meeting
The March FOMC and the announcement of a tapered end to quantitative tightening triggered a rush into the bond market. The meeting also saw the Fed pull back any intention of raising rates any further this year. Details on these topics as well as their economic debate, including the degree of domestic and global slowing expected, will also be watched.
Treasury Budget for March
Consensus Forecast: -$195.9 billion
Consensus Range: -$220.0 billion to -$145.0 billion
Five months into fiscal year 2019 the government's year-to-date deficit in February was $544.2 billion and 39 percent deeper than the prior year. The Treasury budget for March is expected to show a deficit of $195.9 billion vs a deficit of $208.7 billion in March last year.
Initial Jobless Claims for April 6 week
Consensus Forecast: 211,000
Consensus Range: 210,000 to 215,000
Only a modest move higher is the call for initial jobless claims which have stepped lower the past three reports and back to their historic lows early in fourth-quarter last year. Initial claims for the April 6 week are expected to rise 9,000 to 211,000.
PPI-FD for March
Consensus Forecast, Month-to-Month Change: 0.3%
Consensus Range: 0.2% to 0.5%
PPI-FD
Consensus Forecast, Year-on-Year Change: 1.9%
Consensus Range: 1.9% to 2.1%
PPI-FD Less Food & Energy
Consensus Forecast, Month-to-Month Change: 0.2%
Consensus Range: 0.1% to 0.3%
PPI-FD Less Food & Energy
Consensus Forecast, Year-on-Year Change: 2.5%
Consensus Range: 2.0% to 2.7%
PPI-FD Less Food, Energy, & Trade Services
Consensus Forecast, Month-to-Month Change: 0.2%
Consensus Range: 0.2% to 0.2%
Producer prices have been flat but modest pressure is the expectation for March, at a consensus increase of 0.3 percent vs a marginal 0.1 percent rise in February. Less food & energy is seen rising 0.2 percent with the consensus for less food, energy and trade services at 0.2 percent. The overall year-on-year rate and less food & energy rate are expected at 1.9 and 2.5 percent.
Import Prices for March
Consensus Forecast, Month-to-Month Change: 0.4%
Consensus Range: 0.3% to 0.6%
Import Prices
Consensus Forecast, Year-on-Year Change: -0.6%
Consensus Range: -1.0% to -0.4%
Export Prices
Consensus Forecast, Month-to-Month Change: 0.3%
Consensus Range: 0.1% to 0.3%
Forecasters see March import prices rising 0.4 percent after showing some lift in February that was isolated, however, to petroleum-related categories. Export prices are expected to rise 0.3 percent in March.
Consumer Sentiment Index, Preliminary April
Consensus Forecast: 98.2
Consensus Range: 96.0 to 99.5
Forecasters see no further bounce for consumer sentiment calling for a preliminary April reading of 98.2 that would compare with March's strong rise to 98.4.
|
