|
The big news came at week's end as Chinese trade data surprised to the upside, easing concerns that ongoing disputes have been biting into global growth and in turn triggering rallies in the global stock markets. But as is often the case, a closer look doesn't always confirm immediate assumptions. However much trade or exports or industrial production appear to be improving, weaknesses persist evident not only in the details within and surrounding the data but also by inflation which, as yet anyway, is not confirming much of a bounce underway in global demand.
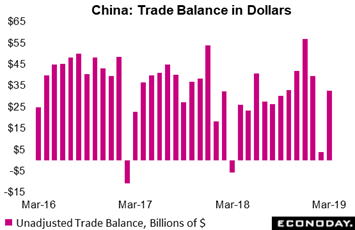 China's trade surplus in US dollar terms widened from $4.1 billion in February to $32.6 billion in March, well above the consensus forecast for a surplus of $11.3 billion. Exports rose 14.2 percent on the year in March, rebounding from a fall of 20.7 percent in February and above the consensus forecast for an increase of 8.4 percent. Imports helped the balance, falling 7.6 percent after falling 5.2 percent previously. Yet however much the results, especially the growth in exports, boosted economic confidence and Friday's stock markets, they likely reflected the impact of the timing of lunar new year holidays. Yes, these holidays took place in February in both 2019 and 2018, but they were around 10 days earlier in the month this year, suggesting that less of the usual pre-holiday surge in activity would have taken place in February this year relative to last year. Looking at year-to-date data removes the impact of lunar new year holidays and showed that the average trade surplus for the two months was a less impressive $21.6 billion. Exports for January and February combined fell 4.6 percent compared with the same period in 2018, while imports fell 3.1 percent. China's trade surplus in US dollar terms widened from $4.1 billion in February to $32.6 billion in March, well above the consensus forecast for a surplus of $11.3 billion. Exports rose 14.2 percent on the year in March, rebounding from a fall of 20.7 percent in February and above the consensus forecast for an increase of 8.4 percent. Imports helped the balance, falling 7.6 percent after falling 5.2 percent previously. Yet however much the results, especially the growth in exports, boosted economic confidence and Friday's stock markets, they likely reflected the impact of the timing of lunar new year holidays. Yes, these holidays took place in February in both 2019 and 2018, but they were around 10 days earlier in the month this year, suggesting that less of the usual pre-holiday surge in activity would have taken place in February this year relative to last year. Looking at year-to-date data removes the impact of lunar new year holidays and showed that the average trade surplus for the two months was a less impressive $21.6 billion. Exports for January and February combined fell 4.6 percent compared with the same period in 2018, while imports fell 3.1 percent.
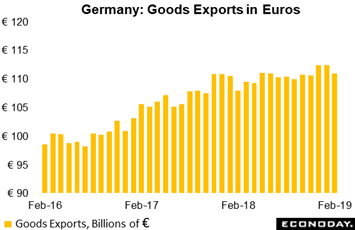 Trade data out of Germany was similarly impressive at the headline level but perhaps less so in the details. The seasonally adjusted balance was in an €18.7 billion surplus in February, marginally larger than an upwardly revised €18.6 billion in January and matching the second strongest showing since last June. But exports were not positive, falling 1.3 percent in the month to €110 billion as tracked in the graph. Domestic demand was also soft as imports fell an even steeper 1.6 percent and, like exports, their first decrease in three months. The slowdown in world business activity has seen the German trade surplus shrink by almost a fifth from the highs recorded in late 2017 and has contributed in no small way to the deceleration in German GDP. Nevertheless, total net foreign trade had a neutral impact on economic growth in the fourth quarter and the January and February data provide at least some hope for no, or little, drag in the quarter just ended. Trade data out of Germany was similarly impressive at the headline level but perhaps less so in the details. The seasonally adjusted balance was in an €18.7 billion surplus in February, marginally larger than an upwardly revised €18.6 billion in January and matching the second strongest showing since last June. But exports were not positive, falling 1.3 percent in the month to €110 billion as tracked in the graph. Domestic demand was also soft as imports fell an even steeper 1.6 percent and, like exports, their first decrease in three months. The slowdown in world business activity has seen the German trade surplus shrink by almost a fifth from the highs recorded in late 2017 and has contributed in no small way to the deceleration in German GDP. Nevertheless, total net foreign trade had a neutral impact on economic growth in the fourth quarter and the January and February data provide at least some hope for no, or little, drag in the quarter just ended.
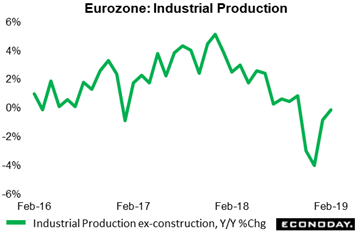 More good news, or at least more good news than bad news, comes from Eurozone industrial production which was significantly less weak than expected in February. Output excluding construction fell only 0.2 percent on the month and this following a markedly upward revised 1.9 percent bounce in January. As a result, yearly growth climbed from minus 0.7 percent to minus 0.3 percent which, while hardly robust, is nevertheless the strongest result since last October. In fact, February's monthly drop was not as bad as it looks as energy dropped a steep 2.2 percent. That said, capital goods and durable consumer goods both declined 0.4 percent while intermediates dipped 0.1 percent. Regionally the monthly headline was hit by a 0.4 percent decline in Germany and a 1.1 percent slide in Spain but boosted by rises in France (0.4 percent) and Italy (0.8 percent). Elsewhere, the picture was mixed but still generally soft. February's report puts average Eurozone industrial production in the first two months of the first quarter 0.8 percent above its mean level in the fourth quarter. Without any revisions, March would need a monthly contraction in excess of 2 percent to prevent the sector from making a positive contribution to first quarter GDP growth. Goods producing industries fell into technical recession at the end of 2018 but at least the downturn seems to have been short-lived. Even so, shrinking order books and weak business confidence warn that the current quarter is unlikely to be anything to write home about. More good news, or at least more good news than bad news, comes from Eurozone industrial production which was significantly less weak than expected in February. Output excluding construction fell only 0.2 percent on the month and this following a markedly upward revised 1.9 percent bounce in January. As a result, yearly growth climbed from minus 0.7 percent to minus 0.3 percent which, while hardly robust, is nevertheless the strongest result since last October. In fact, February's monthly drop was not as bad as it looks as energy dropped a steep 2.2 percent. That said, capital goods and durable consumer goods both declined 0.4 percent while intermediates dipped 0.1 percent. Regionally the monthly headline was hit by a 0.4 percent decline in Germany and a 1.1 percent slide in Spain but boosted by rises in France (0.4 percent) and Italy (0.8 percent). Elsewhere, the picture was mixed but still generally soft. February's report puts average Eurozone industrial production in the first two months of the first quarter 0.8 percent above its mean level in the fourth quarter. Without any revisions, March would need a monthly contraction in excess of 2 percent to prevent the sector from making a positive contribution to first quarter GDP growth. Goods producing industries fell into technical recession at the end of 2018 but at least the downturn seems to have been short-lived. Even so, shrinking order books and weak business confidence warn that the current quarter is unlikely to be anything to write home about.
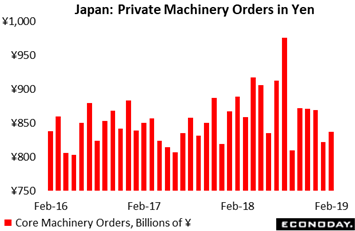 And business investment, despite the general scarcity of skilled labor, has also been less than spectacular. Japan's private sector machinery orders (excluding volatile items) rose 1.8 percent on the month in February, short of expectations for a 2.5 percent gain and failing to reverse by a long shot January's 5.4 percent drop. In original terms, machinery orders (excluding volatile items) fell 5.5 percent on the year in February, weakening further from a decline of 2.9 percent in January. In actual yen terms, as tracked in the graph, February's orders came to ¥837 billion and were well below the ¥910 billion monthly average from April to August last year. Yet February did show a gain led by a 3.5 percent rebound in manufacturing orders after falling 1.9 percent in January. And contraction in non-manufacturing eased, down 0.8 percent after falling 8.0 percent in January. But year-on-year data do show weakness with manufacturing orders down 9.1 percent after dropping 7.5 percent in January, while year-on-year growth in non-manufacturing orders weakened from an increase of 1.0 percent to a fall of 2.0 percent. Officials expect private sector machinery orders to fall 0.9 percent on the quarter in the three months to March, unchanged from their previous estimate. This series, which excludes orders for ships and those from electric power companies, is considered a proxy for capital expenditures And business investment, despite the general scarcity of skilled labor, has also been less than spectacular. Japan's private sector machinery orders (excluding volatile items) rose 1.8 percent on the month in February, short of expectations for a 2.5 percent gain and failing to reverse by a long shot January's 5.4 percent drop. In original terms, machinery orders (excluding volatile items) fell 5.5 percent on the year in February, weakening further from a decline of 2.9 percent in January. In actual yen terms, as tracked in the graph, February's orders came to ¥837 billion and were well below the ¥910 billion monthly average from April to August last year. Yet February did show a gain led by a 3.5 percent rebound in manufacturing orders after falling 1.9 percent in January. And contraction in non-manufacturing eased, down 0.8 percent after falling 8.0 percent in January. But year-on-year data do show weakness with manufacturing orders down 9.1 percent after dropping 7.5 percent in January, while year-on-year growth in non-manufacturing orders weakened from an increase of 1.0 percent to a fall of 2.0 percent. Officials expect private sector machinery orders to fall 0.9 percent on the quarter in the three months to March, unchanged from their previous estimate. This series, which excludes orders for ships and those from electric power companies, is considered a proxy for capital expenditures
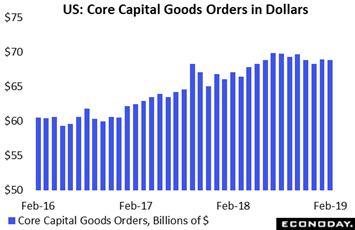 The key measure of capital expenditures in the U.S. is nondefense core capital goods excluding aircraft, and they slipped 0.1 percent for both February orders and February shipments. Dollar levels, at $69 billion in the latest month's orders, have clearly flattened, retreating much as they have in Japan, in this case from a $70 billion peak back in July. Further dimming the outlook for U.S. capital goods are three straight months of declines in related unfilled orders suggesting that manufacturers, notwithstanding sagging sales, are keeping production lines as busy as they can. The U.S. factory sector started to stumble late last year and judging by capital goods has yet to find its footing so far in 2019. Business investment is not likely to be a highlight of first-quarter GDP in the U.S. The key measure of capital expenditures in the U.S. is nondefense core capital goods excluding aircraft, and they slipped 0.1 percent for both February orders and February shipments. Dollar levels, at $69 billion in the latest month's orders, have clearly flattened, retreating much as they have in Japan, in this case from a $70 billion peak back in July. Further dimming the outlook for U.S. capital goods are three straight months of declines in related unfilled orders suggesting that manufacturers, notwithstanding sagging sales, are keeping production lines as busy as they can. The U.S. factory sector started to stumble late last year and judging by capital goods has yet to find its footing so far in 2019. Business investment is not likely to be a highlight of first-quarter GDP in the U.S.
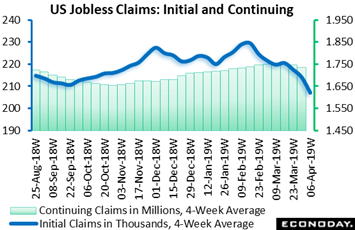 What is puzzling about softening demand for capital goods is how difficult it appears to be for employers, especially in the U.S., to find who they need. A lack of skilled hands, not to mention their cost, increases the attraction of machinery. Employment data out of the U.S. have been very uneven so far this year though the prior week's 196,000 rebound in March nonfarm growth has gone a long way to ease the jitters. And offering an indication of unusual demand for labor is the sinking slope of jobless claims. Initial claims fell for a fourth straight week, down 8,000 in the April 6 week to 196,000 which was much better-than-expected and the lowest showing since late 1969 when the labor force was half the size it is now. The 4-week average (blue line of graph) fell a very sharp 7,000 to 207,000 to offer a very strong indication of accelerating labor market strength. Continuing claims (green columns) have also been coming down, 13,000 lower in lagging data for the March 30 week with this 4-week average down 11,000 to 1.734 million. The unemployment rate for insured workers is unchanged at a remarkably low 1.2 percent. What is puzzling about softening demand for capital goods is how difficult it appears to be for employers, especially in the U.S., to find who they need. A lack of skilled hands, not to mention their cost, increases the attraction of machinery. Employment data out of the U.S. have been very uneven so far this year though the prior week's 196,000 rebound in March nonfarm growth has gone a long way to ease the jitters. And offering an indication of unusual demand for labor is the sinking slope of jobless claims. Initial claims fell for a fourth straight week, down 8,000 in the April 6 week to 196,000 which was much better-than-expected and the lowest showing since late 1969 when the labor force was half the size it is now. The 4-week average (blue line of graph) fell a very sharp 7,000 to 207,000 to offer a very strong indication of accelerating labor market strength. Continuing claims (green columns) have also been coming down, 13,000 lower in lagging data for the March 30 week with this 4-week average down 11,000 to 1.734 million. The unemployment rate for insured workers is unchanged at a remarkably low 1.2 percent.
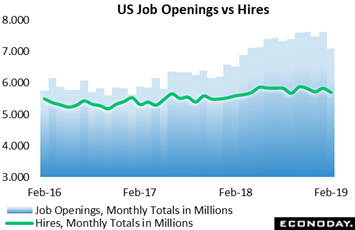 The inability for U.S. employers to fill their staffs has been evident in strong payroll growth for contractors, whether professional or temporary services, and also by the enormous separation between job openings and actual hires. This gap did narrow in the latest data for February but still remains wide, at 1.391 million as seen in the separation between the blue columns of job openings, at 7.087 million, and hires at 5.696 million. This narrowing may point to an easing underway in the imbalance between supply and demand in the labor market but an imbalance is still evident. Quits are also watched in this report especially by Federal Reserve policy makers and they held steady at 3.480 million, not indicating any increase in worker mobility between employers and not indicating any risk of a breakout in wage inflation. The inability for U.S. employers to fill their staffs has been evident in strong payroll growth for contractors, whether professional or temporary services, and also by the enormous separation between job openings and actual hires. This gap did narrow in the latest data for February but still remains wide, at 1.391 million as seen in the separation between the blue columns of job openings, at 7.087 million, and hires at 5.696 million. This narrowing may point to an easing underway in the imbalance between supply and demand in the labor market but an imbalance is still evident. Quits are also watched in this report especially by Federal Reserve policy makers and they held steady at 3.480 million, not indicating any increase in worker mobility between employers and not indicating any risk of a breakout in wage inflation.
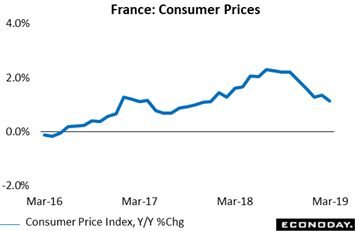 Wage inflation may be edging higher but it has yet to spark much pressure at all in overall inflation. The week saw a run of consumer inflation data out of the U.S. and Europe and subdued was the repeated theme. The graph tracks the CPI in France which as you can see, despite this year's rebound in oil prices, is clearly slumping. In final data for March, the French CPI posted a year-on-year rate of only 1.1 percent for a 2 tenths decline from February. This is the lowest showing since September 2017. Energy did rise nearly 2 percentage points to an annual 5.1 percent in March but food moved in the other direction, down 6 tenths to 2.5 percent. And prices of manufactured goods are flat, down a tick to 0.6 percent while service sector inflation is no better, slipping from 0.9 percent and also at 0.6 percent. The core rate decelerated as well, declining 0.2 percentage points to just 0.5 percent and equalling its weakest showing since October 2017. Though inflation data in France, as well as Europe and the U.S., may be showing seasonality tied to the Easter shift from early April last year to late April this year (April 21), underlying developments nevertheless remain definitely soft and certainly a good deal weaker than the European Central Bank or the Federal Reserve would probably like to see. Wage inflation may be edging higher but it has yet to spark much pressure at all in overall inflation. The week saw a run of consumer inflation data out of the U.S. and Europe and subdued was the repeated theme. The graph tracks the CPI in France which as you can see, despite this year's rebound in oil prices, is clearly slumping. In final data for March, the French CPI posted a year-on-year rate of only 1.1 percent for a 2 tenths decline from February. This is the lowest showing since September 2017. Energy did rise nearly 2 percentage points to an annual 5.1 percent in March but food moved in the other direction, down 6 tenths to 2.5 percent. And prices of manufactured goods are flat, down a tick to 0.6 percent while service sector inflation is no better, slipping from 0.9 percent and also at 0.6 percent. The core rate decelerated as well, declining 0.2 percentage points to just 0.5 percent and equalling its weakest showing since October 2017. Though inflation data in France, as well as Europe and the U.S., may be showing seasonality tied to the Easter shift from early April last year to late April this year (April 21), underlying developments nevertheless remain definitely soft and certainly a good deal weaker than the European Central Bank or the Federal Reserve would probably like to see.
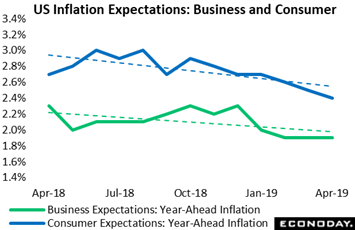 We end the week's data run with inflation expectations in the U.S., something that Fed Chair Jerome Powell repeatedly points to as the most critical of all inflation measures. The green line, produced by the Atlanta Fed, tracks business expectations for year-ahead inflation which is holding this month at a year-and-a-half low of 1.9 percent. This level is not only subdued but the trend is pointing to the risk of even more subdued readings ahead. The blue line, produced by the University of Michigan, tracks consumer expectations one-year ahead and they too aren't showing very much life, down another tick this month to 2.4 percent which is also a year-and-a-half low. Both of these readings are a major part of the reason that market expectations are leaning toward rate cuts, however incremental and however distant, as the next move for the Federal Reserve. We end the week's data run with inflation expectations in the U.S., something that Fed Chair Jerome Powell repeatedly points to as the most critical of all inflation measures. The green line, produced by the Atlanta Fed, tracks business expectations for year-ahead inflation which is holding this month at a year-and-a-half low of 1.9 percent. This level is not only subdued but the trend is pointing to the risk of even more subdued readings ahead. The blue line, produced by the University of Michigan, tracks consumer expectations one-year ahead and they too aren't showing very much life, down another tick this month to 2.4 percent which is also a year-and-a-half low. Both of these readings are a major part of the reason that market expectations are leaning toward rate cuts, however incremental and however distant, as the next move for the Federal Reserve.
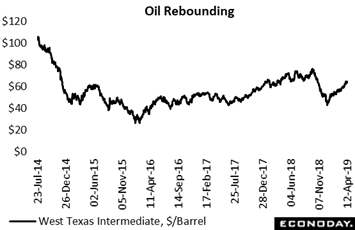 The lack of inflation right now is partly a hangover from oil's big decline at the end of last year, falling from over $70 to under $50 for West Texas Intermediate. Oil has since recovered and is extending a rebound back perhaps toward last year's highs. Yet this has not given much of a much of a boost at all to headline inflation which may be a bit of a surprise. And the softness in cross-border trade is generally keeping a lid on import prices which is another factor subduing the global inflation scene. The upshot of low inflation for the markets is dovish central bank policy, a theme that we've seen developed this year starting with the Federal Reserve's move in January away from last year's rate hikes followed in March by their move away from quantitative tightening. Not having to fight the Fed is often a big plus for the stock market which of course helps explain the big gains underway this year for the global stock markets, embodied in the U.S. Dow which, at 26,412, is up a year-to-date 13.2 percent. The lack of inflation right now is partly a hangover from oil's big decline at the end of last year, falling from over $70 to under $50 for West Texas Intermediate. Oil has since recovered and is extending a rebound back perhaps toward last year's highs. Yet this has not given much of a much of a boost at all to headline inflation which may be a bit of a surprise. And the softness in cross-border trade is generally keeping a lid on import prices which is another factor subduing the global inflation scene. The upshot of low inflation for the markets is dovish central bank policy, a theme that we've seen developed this year starting with the Federal Reserve's move in January away from last year's rate hikes followed in March by their move away from quantitative tightening. Not having to fight the Fed is often a big plus for the stock market which of course helps explain the big gains underway this year for the global stock markets, embodied in the U.S. Dow which, at 26,412, is up a year-to-date 13.2 percent.
There's a caveat in the recent data, whether new year distortions out of Asia or Easter distortions out of the U.S. and Europe, and that's the role that seasonal adjustments may or may not be playing in what has been an ongoing global slowdown. Adjustments during times when volumes are low, especially in the Winter and holiday months, are often shifting and always difficult to judge and can have a larger-than-usual impact on initial data. If this is indeed a risk it could well play out in an unusually large (distorted) swing higher for the global economy in the second quarter. Just something to keep in mind and perhaps to peak your interest in the day-to-day unfolding of economic information.
**Jeremy Hawkins and Brian Jackson contributed to this article
There are plenty of U.S. data in the coming week but it will be updates out of China that are most likely to affect the markets. The monthly batch for China is scheduled for Wednesday morning Beijing time which, for the U.S., will be late Tuesday evening. The run will include fixed asset investment, industrial production along with retail sales where steady to improved readings are the expectations, yet it will be first-quarter GDP that will be the focus and here a further 1 tenth dip, not an increase, to 6.3 percent is the call.
On the U.S. calendar, industrial production on Tuesday and the trade deficit on Wednesday will only mark time ahead of Thursday's retail sales report. The U.S. outlook has yet to recover from the still shocking 1.6 percent plunge in retail sales during December and though a sharp headline gain is expected for March, it will be core readings that will count the most and here forecasts are more moderate. Other data in the week will include the latest trade figures from Japan and the ZEW survey out of Germany along with employment and retail sales out of the UK where Brexit effects will be the focus.
US: Empire State Index for April (Monday 8:30 EDT, 12:30 GMT)
Consensus Forecast: 6.0
Consensus Range: 5.0 to 11.5
The Empire State index, in line with many other factory indications, is at a 2-1/2 low but improvement is the April consensus, at 6.0 vs March's 3.7.
UK: Labour Market Report for March (Tuesday 04:30 EDT, 08:30 GMT)
ILO Unemployment Rate
Consensus Forecast: 4.0%
Average Weekly Earnings, Year-on-Year
Consensus Forecast: +3.4%
The ILO unemployment rate is expected to rise 1 tenth in March to 4.0 percent following what was an upbeat February report. Average hourly earnings including bonuses are expected to slip 2 tenths to a year-on-year 3.4 percent.
Germany: ZEW Survey for April (Tuesday 05:00 EDT, 09:00 GMT)
Consensus Forecast: 8.1
A decline to 8.1 is the call for April's German ZEW survey which in March slipped 9 tenths to 11.1 in what was a downbeat report and the weakest headline result in four years. Yet the expectations reading was solid, rising for a fifth month but still in the negative column at minus 3.6. For April, expectations are forecast to move back to positive ground at plus 0.8.
US: Industrial Production for March (Tuesday 9:15 EDT, 13:15 GMT)
Consensus Forecast, Month-to-Month Change: 0.3%
Consensus Range: -0.2% to 0.4%
Manufacturing Production
Consensus Forecast, Month-to-Month Change: 0.3%
Consensus Range: 0.1% to 0.5%
Capacity Utilization Rate
Consensus Forecast: 79.2%
Consensus Range: 78.4% to 79.4%
The consensus for manufacturing production, which has posted two straight declines, is a rebound to a 0.3 percent gain in March. Forecasters see headline industrial production also rising 0.3 percent with the capacity utilization rate up slightly to 79.2 percent (February revised to 79.1 percent).
US: Housing Market Index for April (Tuesday 10:00 EDT, 14:00 GMT)
Consensus Forecast: 63
Consensus Range: 62 to 64
Re-acceleration after a flat March is the call for April's housing market index, at a consensus 63 vs March's 62. This index has been holding in the low 60 range vs the upper 60 range last year.
Japan: Merchandise Trade for March (Tuesday 19:50 EDT, 23:50 GMT)
Consensus Forecast: ¥310.0 billion
A headline surplus of ¥350.0 billion is expected for Japan's March merchandise trade report, up from a surplus of ¥339.0 billion in February. The year-on-year rate for exports was weak in February, down 1.2 percent but with imports down an even steeper 6.6 percent.
China: Fixed Asset Investment for March (Tuesday 20:00 EDT, Wednesday 2:00 GMT)
Consensus Forecast: 6.3%
Consensus Range: 5.9% to 7.8%
Fixed asset investment in China grew a slightly better-than-expected 6.1 percent on the year for January and February combined, up from 5.9 percent in December and above the consensus forecast of 5.9 percent. Forecasters see March fixed asset investment rising 6.3 percent.
China: GDP for First Quarter (Tuesday 20:00 EDT, Wednesday 2:00 GMT)
Consensus Forecast: 6.3%
Consensus Range: 6.2% to 6.6%
After posting at 6.4 percent in the fourth quarter for the slowest pace since 2009, forecasters expect first-quarter GDP to come in one tenth lower at 6.3 percent. The consensus range is 6.2 to 6.6 percent. Trade frictions with the U.S. were cited by the National Bureau of Statistics for the slowing in the fourth quarter.
China: Industrial Production for March (Tuesday 20:00 EDT, Wednesday 2:00 GMT)
Consensus Forecast: 6.0%
Consensus Range: 5.5% to 6.6%
Industrial production in March is expected to accelerate to a 6.0 percent year-on-year increase from 5.3 percent in January and February combined, a period held back by slowing in the utilities sector.
China: Retail Sales for February (Tuesday 20:00 EDT, Wednesday 2:00 GMT)
Consensus Forecast: 8.3%
Consensus Range: 8.6% to 7.6%
Chinese retail sales in March are expected to edge 1 tenth higher to an 8.3 percent year-on-year growth rate in the January to February period. Sales of autos and communication equipment improved in the prior report, offset by slowing in household nondurables as well as home appliances and furniture.
US: International Trade Balance for February (Wednesday 8:30 EDT, 12:30 GMT)
Consensus Forecast: -$53.7 billion
Consensus Range: -$54.5 to -$50.8 billion
After sharp improvement in January to $51.1 billion, the US trade deficit is expected to deepen back to a consensus $53.7 billion.
US: Wholesale Inventories for March (Wednesday 10:00 EDT, 14:00 GMT)
Consensus Forecast, Month-to-Month Change: 0.4%
Consensus Range: 0.1% to 0.5%
Wholesale inventories have been climbing very sharply in contrast to sales in the sector which have been spotty. Forecasters see a slowing build for wholesale inventories in March, at a consensus 0.4 percent vs 1.4 percent (revised) and 1.1 percent builds in the two prior months.
US: Beige Book (Wednesday 14:00 EDT, 18:00 GMT)
Prepared for the FOMC Meeting on April 30 & May 1
Modest-to-moderate for economic activity was downgraded one notch to slight-to-moderate in the last Beige Book in March and an upgrade back to the former is possible given, if nothing else, the sizable 196,000 bounce back in March nonfarm payrolls. Housing data have also improved since March though manufacturing has remained soft. April's Beige Book is in preparation for the April 30 and May 1 meeting.
UK: Retail Sales for March, Year-on-Year (Thursday 04:30 EDT, 08:30 GMT)
Consensus Forecast: +3.3%
At year-on-year growth of 4.0 percent, UK retail sales proved solid in February with discretionary spending showing particular strength. But moderation is the expectation for March retail sales with the consensus at 3.3 percent.
US: Initial Jobless Claims for April 13 week (Thursday 8:30 EDT, 12:30 GMT)
Consensus Forecast: 206,000
Consensus Range: 204,000 to 215,000
After four straight declines to the lowest levels since 1969, initial jobless claims are expected to correct higher to a consensus 206,000 vs 196,000 in the April 6 week. The April 13 week will track the survey week of the March employment report.
US: Philadelphia Fed Manufacturing Index for April (Thursday 8:30 EDT, 12:30 GMT)
Consensus Forecast: 10.2
Consensus Range: 4.0 to 11.0
Slight slowing at a consensus 10.2 is the call for April's Philadelphia Fed manufacturing index which in March bounced solidly higher to a 13.7 level that masked, however, a second straight poor showing for new orders.
US: Retail Sales for March (Thursday 8:30 EDT, 12:30 GMT)
Consensus Forecast: 0.8%
Consensus Range: 0.3% to 1.2%
Retail Sales Ex-Autos
Consensus Forecast: 0.7%
Consensus Range: 0.3% to 1.0%
Retail Sales Ex-Autos & Gas
Consensus Forecast: 0.4%
Consensus Range: 0.4% to 0.6%
Retail Sales Control Group (Ex-Food Services, Ex-Autos, Ex-Gas, Ex-Building Materials)
Consensus Forecast: 0.4%
Consensus Range: 0.3% to 0.8%
Strong headline recovery, boosted by autos and price effects for gasoline, is what forecasters see for retail sales in March, at a consensus increase of 0.8 percent vs a 0.2 percent dip in February. But ex-autos & ex-gasoline sales are expected at a more moderate 0.4 percent gain with the control group also at 0.4 percent.
US: PMI Composite for April, Flash (Thursday 09:45 EDT, 13:45 GMT)
Consensus Forecast: 54.3
Consensus Range: 53.0 to 54.4
PMI Manufacturing
Consensus Forecast: 52.2
Consensus Range: 51.8 to 53.6
PMI Services
Consensus Forecast: 55.0
Consensus Range: 52.6 to 56.0
Solid growth for services but slowing growth for manufacturing were the offsetting themes of the March PMI. The consensus for April's flash PMI composite is 54.3 split between a services consensus at 55.0 and a manufacturing consensus of only 52.2.
US: Business Inventories for February (Thursday 10:00 EDT, 14:00 GMT)
Consensus Forecast, Month-to-Month Change: 0.3%
Consensus Range: 0.1% to 0.5%
After back-to-back builds of 0.8 percent, a slowing build of 0.3 percent is forecast for February business inventories. Inventories relative to sales have been rising at an accelerated rate.
US: Index of Leading Economic Indicators for March (Thursday 10:00 EDT, 14:00 GMT)
Consensus Forecast, Month-to-Month Change: 0.3%
Consensus Range: 0.2% to 0.4%
The consensus for March's index of leading economic indicators is a modest increase of 0.3 percent vs a subdued 0.2 percent rise in February that followed even weaker showings in January and December.
Japan: Consumer Price Index for March, Year-on-Year (Thursday 19:30 EDT, 23:30 GMT)
Consensus Forecast Ex-Food: 0.7%
No change at a still subdued year-on-year 0.7 percent pace is the call for Japanese ex-food consumer prices in March. Declines in transport and communication costs accelerated in February.
US: Housing Starts for March (Friday 8:30 EDT, 12:30 GMT)
Consensus Forecast, Annualized Rate: 1.230 million
Consensus Range: 1.168 to 1.300 million
Building Permits
Consensus Forecast: 1.300 million
Consensus Range: 1.299 to 1.320 million
Improvement is the forecast for housing starts and permits in March. Starts are expected to come in at a 1.230 million annual pace vs an unexpectedly low 1.162 million in February. The consensus for permits is 1.300 million vs February's 1.291 million which was also unexpectedly low (revised from an initial 1.296 million).
|
