|
The first-quarter of this year's global economy definitely got off to a slow start. Contracting export volumes, uneven consumer spending following a dismal December, and the risk of a new slump for price inflation were all central reasons why many central banks began to pivot back from what had been a hawkish bias to a netural or even dovish bias. But as informed by incoming data (so to speak), the news is increasingly pointing to less risk of a significant downturn. Cross-border activity appears to be showing better life and retail spending may be on the mend. But first we start with the week's most significant numbers, and that's a bit of good news out of China.
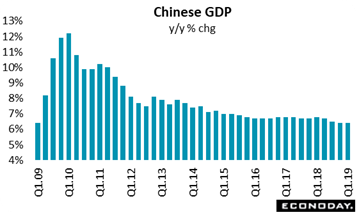 China's economy expanded at a 6.4 percent year-on-year pace in the three months to March, unchanged from the previous quarter and marginally higher than the consensus forecast. As in the previous quarter, China's economy grew at the slowest year-on-year pace since 2009, albeit not far below the 6.7 to 7.0 percent range seen since the start of 2015 and near the top of the government's 2019 range of 6.0 to 6.5 percent. On the quarter, China's GDP grew 1.4 percent, down only 1 tick from the 1.5 percent increase recorded in the three months to December. China's economy expanded at a 6.4 percent year-on-year pace in the three months to March, unchanged from the previous quarter and marginally higher than the consensus forecast. As in the previous quarter, China's economy grew at the slowest year-on-year pace since 2009, albeit not far below the 6.7 to 7.0 percent range seen since the start of 2015 and near the top of the government's 2019 range of 6.0 to 6.5 percent. On the quarter, China's GDP grew 1.4 percent, down only 1 tick from the 1.5 percent increase recorded in the three months to December.
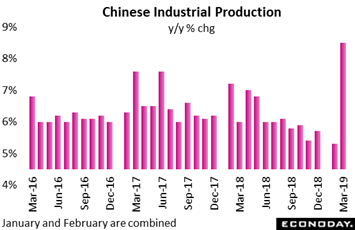 Outshining GDP in the week was Chinese industrial production which grew 8.5 percent on the year in March, up from 5.3 percent for January and February combined and well above the consensus forecast for 6.0 percent. Industrial output for the quarter as a whole was up 6.5 percent from the March 2018 quarter when yearly growth was 6.8 percent. Monthly industrial production rose 1.00 percent in March after rising 0.46 percent previously. The much stronger-than-expected headline growth was broad-based, reflecting stronger year-on-year comparisons in almost all industries and products. Among major industries, non-metal minerals posted the sharpest production growth, rising 15.4 percent year-on-year after 8.8 percent the previous month, closely followed by electric machinery, up 15.2 percent following a rise of 8.0 percent. Among major products, cement posted the strongest year-on-year production growth, at 22.2 percent in March following February's 0.5 percent. Autos remained down at minus 2.6 percent, though this was an improvement from the double-digit declines seen in prior months (minus 15.1 percent in the January-March period). Note that the period for January and February is combined due to calendar factors tied to the lunar new year. Outshining GDP in the week was Chinese industrial production which grew 8.5 percent on the year in March, up from 5.3 percent for January and February combined and well above the consensus forecast for 6.0 percent. Industrial output for the quarter as a whole was up 6.5 percent from the March 2018 quarter when yearly growth was 6.8 percent. Monthly industrial production rose 1.00 percent in March after rising 0.46 percent previously. The much stronger-than-expected headline growth was broad-based, reflecting stronger year-on-year comparisons in almost all industries and products. Among major industries, non-metal minerals posted the sharpest production growth, rising 15.4 percent year-on-year after 8.8 percent the previous month, closely followed by electric machinery, up 15.2 percent following a rise of 8.0 percent. Among major products, cement posted the strongest year-on-year production growth, at 22.2 percent in March following February's 0.5 percent. Autos remained down at minus 2.6 percent, though this was an improvement from the double-digit declines seen in prior months (minus 15.1 percent in the January-March period). Note that the period for January and February is combined due to calendar factors tied to the lunar new year.
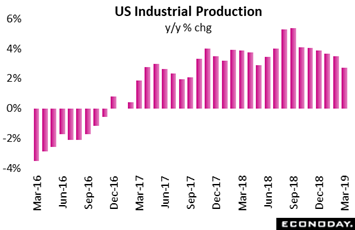 Before March's data, Chinese production had been slumping as the US still is. Industrial production unexpectedly slipped 0.1 percent in March vs Econoday's consensus for a 0.3 percent gain. Year-on-year as tracked in the graph, industrial production slowed to 2.7 percent for the lowest rate of annual growth since September 2017. Manufacturing production, which makes up the bulk of the report, was also expected to rise a monthly 0.3 percent in March but instead came in unchanged. Overall capacity utilization, at 78.8 percent, missed expectations by 3 tenths. But there was a bounce back for the production of business equipment, up 0.4 percent after February's sharp 0.8 percent downdraft. This year-on-year rate, at plus 3.8 percent, still leads the manufacturing readings and suggests that businesses, finding skilled labor in short supply, are turning to machinery for production. Consumer goods, in contrast, fell 0.2 percent in the month for a year-on-year 0.1 percent decline. Manufacturing volumes overall were up only 1.0 percent on the year vs 2.8 percent for total industrial production. Like manufacturing, the report's two other components were also soft with utilities up only 0.2 percent and with mining, which has been a major source of U.S. strength the last two years, down 0.8 percent in the month. Still, growth in mining volumes remains in the double digits on an annual basis, at 10.5 percent. Before March's data, Chinese production had been slumping as the US still is. Industrial production unexpectedly slipped 0.1 percent in March vs Econoday's consensus for a 0.3 percent gain. Year-on-year as tracked in the graph, industrial production slowed to 2.7 percent for the lowest rate of annual growth since September 2017. Manufacturing production, which makes up the bulk of the report, was also expected to rise a monthly 0.3 percent in March but instead came in unchanged. Overall capacity utilization, at 78.8 percent, missed expectations by 3 tenths. But there was a bounce back for the production of business equipment, up 0.4 percent after February's sharp 0.8 percent downdraft. This year-on-year rate, at plus 3.8 percent, still leads the manufacturing readings and suggests that businesses, finding skilled labor in short supply, are turning to machinery for production. Consumer goods, in contrast, fell 0.2 percent in the month for a year-on-year 0.1 percent decline. Manufacturing volumes overall were up only 1.0 percent on the year vs 2.8 percent for total industrial production. Like manufacturing, the report's two other components were also soft with utilities up only 0.2 percent and with mining, which has been a major source of U.S. strength the last two years, down 0.8 percent in the month. Still, growth in mining volumes remains in the double digits on an annual basis, at 10.5 percent.
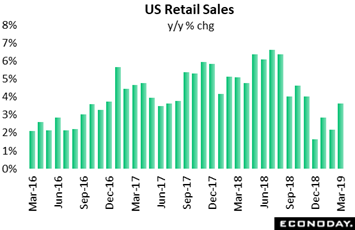 US production may have faded further in March but not retail sales. In fact, the optimists weren't quite optimistic enough as March US retail sales, across all major readings, came in just above Econoday's high estimates. Total dollar sales at US retailers jumped a month-to-month 1.6 percent in March to fully offset the 1.6 percent plunge posted in the holiday month of December. Year-on-year, March retail sales improved to 3.6 percent growth as seen in the graph. Vehicle sales stand out sharply in March, up a monthly 3.3 percent following declines in the two prior months. Sales at gasoline stations also stand out, up 3.5 percent for a second straight month but boosted by price effects for fuel. Convincing strength is clearly evident once again for non-store retailers which, after falling 4.5 percent in December, have posted three straight strong gains including 1.2 percent in both March and February. Restaurants are also convincing, up 0.8 percent in the latest month for a third straight monthly gain in what speaks directly to discretionary strength. Lagging were department stores, unchanged following three straight declines which may reflect an ongoing shift in consumer habits away from traditional malls more than it does weakness in consumer demand. Department stores aside, March's retail sales report points to a positive consumer contribution to first-quarter GDP and, for Federal Reserve policy and whether the next rate move is up or down, is an offset to the weakness in industrial production. US production may have faded further in March but not retail sales. In fact, the optimists weren't quite optimistic enough as March US retail sales, across all major readings, came in just above Econoday's high estimates. Total dollar sales at US retailers jumped a month-to-month 1.6 percent in March to fully offset the 1.6 percent plunge posted in the holiday month of December. Year-on-year, March retail sales improved to 3.6 percent growth as seen in the graph. Vehicle sales stand out sharply in March, up a monthly 3.3 percent following declines in the two prior months. Sales at gasoline stations also stand out, up 3.5 percent for a second straight month but boosted by price effects for fuel. Convincing strength is clearly evident once again for non-store retailers which, after falling 4.5 percent in December, have posted three straight strong gains including 1.2 percent in both March and February. Restaurants are also convincing, up 0.8 percent in the latest month for a third straight monthly gain in what speaks directly to discretionary strength. Lagging were department stores, unchanged following three straight declines which may reflect an ongoing shift in consumer habits away from traditional malls more than it does weakness in consumer demand. Department stores aside, March's retail sales report points to a positive consumer contribution to first-quarter GDP and, for Federal Reserve policy and whether the next rate move is up or down, is an offset to the weakness in industrial production.
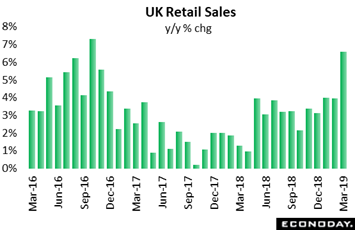 Like the U.S. and despite Brexit confusion, consumers in the UK are also showing more life. A 1.1 percent monthly jump in retail sales (measured here in volumes) compared with market expectations for a modest decline and lifted annual growth from 4.0 percent to 6.7 percent, its strongest reading since October 2016. Excluding auto fuel, purchases were even more robust, climbing 1.2 percent versus February for a yearly rise of 6.2 percent, some 2.4 percentage points up from January. The monthly headline gain was divided between food, which saw a 1.1 percent rise after a 1.0 percent drop in February, and (ex-auto fuel) non-food which advanced 0.6 percent following a 1.2 percent bounce. Within the latter, there were solid rises in both household goods (1.8 percent) and textiles and clothing (1.0 percent). Volume declines were limited to non-specialized stores and the other stores category (both just 0.1 percent) and auto fuel which was down 0.3 percent. However, a main area of strength, as in the U.S., was non-store retailing which jumped 4.2 percent for a third straight increase in excess of 2 percent. The March report puts overall sales volumes last quarter a surprisingly healthy 1.6 percent above their level in the fourth quarter when they gained just 0.1 percent. Prospects for first quarter GDP growth are now looking up and the likelihood that the Bank of England will retain a tightening bias next month is all the higher. Like the U.S. and despite Brexit confusion, consumers in the UK are also showing more life. A 1.1 percent monthly jump in retail sales (measured here in volumes) compared with market expectations for a modest decline and lifted annual growth from 4.0 percent to 6.7 percent, its strongest reading since October 2016. Excluding auto fuel, purchases were even more robust, climbing 1.2 percent versus February for a yearly rise of 6.2 percent, some 2.4 percentage points up from January. The monthly headline gain was divided between food, which saw a 1.1 percent rise after a 1.0 percent drop in February, and (ex-auto fuel) non-food which advanced 0.6 percent following a 1.2 percent bounce. Within the latter, there were solid rises in both household goods (1.8 percent) and textiles and clothing (1.0 percent). Volume declines were limited to non-specialized stores and the other stores category (both just 0.1 percent) and auto fuel which was down 0.3 percent. However, a main area of strength, as in the U.S., was non-store retailing which jumped 4.2 percent for a third straight increase in excess of 2 percent. The March report puts overall sales volumes last quarter a surprisingly healthy 1.6 percent above their level in the fourth quarter when they gained just 0.1 percent. Prospects for first quarter GDP growth are now looking up and the likelihood that the Bank of England will retain a tightening bias next month is all the higher.
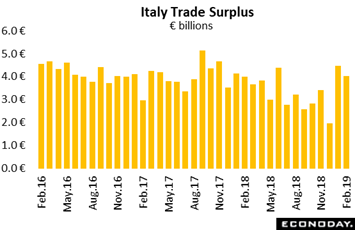 Slowing in global trade has been a central factor that has pushed many central banks, including the European Central Bank and the Federal Reserve, toward a wait-and-see approach. But some of the weakness in trade may be easing, Italy is one example. The country's merchandise trade balance was in a €4.0 billion surplus in February after an upwardly revised €4.5 billion in January, two months that contrast with a long slump going into year end. At 3.4 percent, unadjusted annual export growth was the strongest since October while at 3.3 percent, the import rate was up 1.5 percentage points in the month. Though not robust, February's data leave total net exports on course to provide a modest boost to real GDP growth in the quarter just ended, something to note given Italy's fourth-quarter slip into recession. Slowing in global trade has been a central factor that has pushed many central banks, including the European Central Bank and the Federal Reserve, toward a wait-and-see approach. But some of the weakness in trade may be easing, Italy is one example. The country's merchandise trade balance was in a €4.0 billion surplus in February after an upwardly revised €4.5 billion in January, two months that contrast with a long slump going into year end. At 3.4 percent, unadjusted annual export growth was the strongest since October while at 3.3 percent, the import rate was up 1.5 percentage points in the month. Though not robust, February's data leave total net exports on course to provide a modest boost to real GDP growth in the quarter just ended, something to note given Italy's fourth-quarter slip into recession.
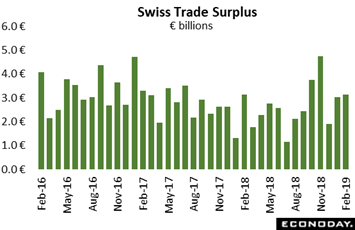 Trade may also be improving for Switzerland where the merchandise trade balance was in a CH3.18 billion surplus in March. Following a CHF2.94 billion surplus in February, this made for a CHF1.50 billion increase from a year ago and the best performance since November. However, annual export growth slowed to 5.4 percent from 6.1 percent in mid-quarter, while the import rate was minus 2.3 percent, a drop of some 10.8 percentage points. Given the import drop, net merchandise exports again contributed positively to real GDP growth, at least in March. Even so, following a particularly poor start to the year, first quarter export volumes still declined 1.0 percent which, with imports rising 0.7 percent, left the real trade balance having a negative impact on the quarter. Trade may also be improving for Switzerland where the merchandise trade balance was in a CH3.18 billion surplus in March. Following a CHF2.94 billion surplus in February, this made for a CHF1.50 billion increase from a year ago and the best performance since November. However, annual export growth slowed to 5.4 percent from 6.1 percent in mid-quarter, while the import rate was minus 2.3 percent, a drop of some 10.8 percentage points. Given the import drop, net merchandise exports again contributed positively to real GDP growth, at least in March. Even so, following a particularly poor start to the year, first quarter export volumes still declined 1.0 percent which, with imports rising 0.7 percent, left the real trade balance having a negative impact on the quarter.
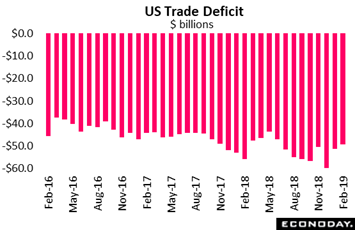 Trade news is also mostly good out of the US. In fact, first-quarter GDP looks to get a major boost from improvement in the trade deficit which, for February, came in at much lower-than-expected $49.4 billion. Exports jumped 1.1 percent in the month on top of January's 1.0 percent gain. Though the risk of disruptions tied to the grounding of the Boeing 737 Max is a looming wild card, exports of civilian aircraft rose sharply in March, up $2.2 billion in the month. Outside of aircraft, however, gains were less striking with auto exports up a moderate $0.6 billion and with monetary gold and consumer goods showing marginal gains. For farmers, the results were slightly in the negative column with exports down $0.2 billion. But exports of services, at $70.1 billion in the month and usually a reliable plus for the U.S., rose 0.3 percent. Imports rose 0.2 percent in the month but with consumer goods showing yet another large increase of $1.6 billion. Imports of industrial supplies fell $1.2 billion despite a $0.8 billion rise in the oil subcomponent. Imports for other categories were little changed. Bilateral country deficits showed a sharp decline with China, at $24.8 billion in unadjusted monthly data that are hard to gauge given strong calendar effects during the lunar new year. But year-to-date, the deficit with China was at $59.2 billion and down sizably from $65.2 billion in the comparison with the 2018 period. GDP in the US looks to be getting some first-quarter help from net exports while the easing deficit with China may well ease tensions in U.S.-Chinese trade talks. Trade news is also mostly good out of the US. In fact, first-quarter GDP looks to get a major boost from improvement in the trade deficit which, for February, came in at much lower-than-expected $49.4 billion. Exports jumped 1.1 percent in the month on top of January's 1.0 percent gain. Though the risk of disruptions tied to the grounding of the Boeing 737 Max is a looming wild card, exports of civilian aircraft rose sharply in March, up $2.2 billion in the month. Outside of aircraft, however, gains were less striking with auto exports up a moderate $0.6 billion and with monetary gold and consumer goods showing marginal gains. For farmers, the results were slightly in the negative column with exports down $0.2 billion. But exports of services, at $70.1 billion in the month and usually a reliable plus for the U.S., rose 0.3 percent. Imports rose 0.2 percent in the month but with consumer goods showing yet another large increase of $1.6 billion. Imports of industrial supplies fell $1.2 billion despite a $0.8 billion rise in the oil subcomponent. Imports for other categories were little changed. Bilateral country deficits showed a sharp decline with China, at $24.8 billion in unadjusted monthly data that are hard to gauge given strong calendar effects during the lunar new year. But year-to-date, the deficit with China was at $59.2 billion and down sizably from $65.2 billion in the comparison with the 2018 period. GDP in the US looks to be getting some first-quarter help from net exports while the easing deficit with China may well ease tensions in U.S.-Chinese trade talks.
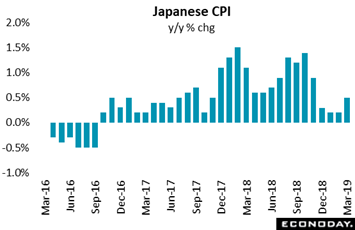 Though there may be signs of ongoing improvement in demand, concrete improvement for inflation remains elusive, especially as always in Japan. Inflation data showed headline inflation rising but underlying measures remaining steady and subdued in March. The headline consumer price index rose 0.5 percent on the year in March after advancing 0.2 percent in February, still well below the Bank of Japan's 2.0 percent inflation target. Seasonally adjusted headline CPI remained unchanged on the month in March after an unchanged reading in February. The March increase in yearly inflation reflected a smaller year-on-year decline in food prices in February as well as offsetting moves in some of the other major categories of the index. Food prices, which account for just over a quarter of the total index, fell 0.3 percent on the year after falling 1.4 percent previously, while transport and communication costs, around 15 percent of the index, fell 0.3 percent after falling 0.6 percent previously. In other major categories, year-on-year price changes were relatively steady including for housing, fuel and utility charges and services. Core CPI, which excludes fresh food prices, rose 0.8 percent on the year in March, up from 0.7 percent in February and a tick above the consensus forecast. The index remained unchanged on the month after increasing 0.1 percent previously. The Bank of Japan's preferred measure of underlying inflation, CPI excluding fresh food and energy prices, increased a marginal 0.4 percent on the year in March, as it did in February, and remained unchanged on the month after increasing 0.1 percent previously. Though there may be signs of ongoing improvement in demand, concrete improvement for inflation remains elusive, especially as always in Japan. Inflation data showed headline inflation rising but underlying measures remaining steady and subdued in March. The headline consumer price index rose 0.5 percent on the year in March after advancing 0.2 percent in February, still well below the Bank of Japan's 2.0 percent inflation target. Seasonally adjusted headline CPI remained unchanged on the month in March after an unchanged reading in February. The March increase in yearly inflation reflected a smaller year-on-year decline in food prices in February as well as offsetting moves in some of the other major categories of the index. Food prices, which account for just over a quarter of the total index, fell 0.3 percent on the year after falling 1.4 percent previously, while transport and communication costs, around 15 percent of the index, fell 0.3 percent after falling 0.6 percent previously. In other major categories, year-on-year price changes were relatively steady including for housing, fuel and utility charges and services. Core CPI, which excludes fresh food prices, rose 0.8 percent on the year in March, up from 0.7 percent in February and a tick above the consensus forecast. The index remained unchanged on the month after increasing 0.1 percent previously. The Bank of Japan's preferred measure of underlying inflation, CPI excluding fresh food and energy prices, increased a marginal 0.4 percent on the year in March, as it did in February, and remained unchanged on the month after increasing 0.1 percent previously.
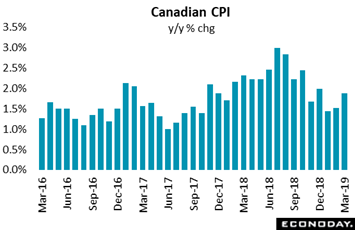 The direction of prices is similar in Canada though the rate of inflation is visibly higher. Canadian inflation at the consumer level accelerated slightly in March. A largely seasonal and as-expected 0.7 percent monthly gain in prices put the annual rate at 1.9 percent as tracked in the graph, 0.4 percentage points higher than its February rate. Excluding food and energy, prices rose 0.3 percent on the month and 1.9 percent year-on-year. Prices increased year-on-year in all eight major components, with a 1.9 percent price increase in the transportation component driving the overall CPI gain as gasoline prices declined less in March than in February. Energy prices decreased 1.2 percent in March, following a 5.7 percent decline in February, as downward pressure from gasoline prices eased while prices for natural gas and fuel oil rose. Food and shelter prices, third and first in component weighting, widened their year-on-year gains, with food up 3.6 percent on the year in March after 3.2 percent in February and with shelter up 2.7 percent after 2.4 percent previously. Prices for durable goods rose 1.2 percent year-on-year, led by a 3.0 percent increase in passenger vehicle prices, mainly due to a 1.5 percent decline in March 2018 as a result of rebates. Prices for services rose 2.2 percent year-on-year after rising 2.3 percent previously, with travel tours declining 6.4 percent as they reached a lower seasonal peak than in the same period a year ago. The average of the Bank of Canada's preferred measures of inflation rose from 1.9 percent to 2.0 percent in March with other core rates either flat or also showing a very small pick up. The direction of prices is similar in Canada though the rate of inflation is visibly higher. Canadian inflation at the consumer level accelerated slightly in March. A largely seasonal and as-expected 0.7 percent monthly gain in prices put the annual rate at 1.9 percent as tracked in the graph, 0.4 percentage points higher than its February rate. Excluding food and energy, prices rose 0.3 percent on the month and 1.9 percent year-on-year. Prices increased year-on-year in all eight major components, with a 1.9 percent price increase in the transportation component driving the overall CPI gain as gasoline prices declined less in March than in February. Energy prices decreased 1.2 percent in March, following a 5.7 percent decline in February, as downward pressure from gasoline prices eased while prices for natural gas and fuel oil rose. Food and shelter prices, third and first in component weighting, widened their year-on-year gains, with food up 3.6 percent on the year in March after 3.2 percent in February and with shelter up 2.7 percent after 2.4 percent previously. Prices for durable goods rose 1.2 percent year-on-year, led by a 3.0 percent increase in passenger vehicle prices, mainly due to a 1.5 percent decline in March 2018 as a result of rebates. Prices for services rose 2.2 percent year-on-year after rising 2.3 percent previously, with travel tours declining 6.4 percent as they reached a lower seasonal peak than in the same period a year ago. The average of the Bank of Canada's preferred measures of inflation rose from 1.9 percent to 2.0 percent in March with other core rates either flat or also showing a very small pick up.
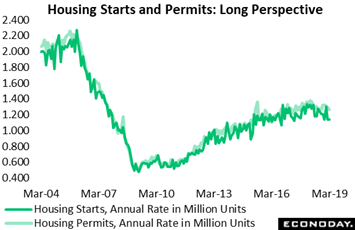 We end the week's data run on a clear down note, and that's a continuing and hard to explain slump in U.S. housing. Housing starts came in far below expectations in March, at a 1.139 million annual rate which was nearly 30,000 below Econoday's consensus range. And permits weren't any better, at a 1.269 million rate and nearly 20,000 below the low estimate. The trend is clearly downward with starts the weakest since May 2017 and permits the weakest since August last year. Year-on-year rates are minus 14.2 percent for starts and minus 7.8 percent for permits. Goods news in the report was scarce but did include a welcome 11.9 percent monthly jump in single-family completions at a 938,000 rate for a new home sales market that needs fresh supply. But another key reading, permits for single-family homes, fell 1.1 percent in March and were down 5.1 percent year-on-year. Low mortgage rates may be helping to increase purchase applications but they have yet to trigger much response from home builders. However much the week's retail sales and trade data have boosted the outlook for the coming week's first-quarter U.S. GDP report, residential investment looks very likely to extend its dismal run. We end the week's data run on a clear down note, and that's a continuing and hard to explain slump in U.S. housing. Housing starts came in far below expectations in March, at a 1.139 million annual rate which was nearly 30,000 below Econoday's consensus range. And permits weren't any better, at a 1.269 million rate and nearly 20,000 below the low estimate. The trend is clearly downward with starts the weakest since May 2017 and permits the weakest since August last year. Year-on-year rates are minus 14.2 percent for starts and minus 7.8 percent for permits. Goods news in the report was scarce but did include a welcome 11.9 percent monthly jump in single-family completions at a 938,000 rate for a new home sales market that needs fresh supply. But another key reading, permits for single-family homes, fell 1.1 percent in March and were down 5.1 percent year-on-year. Low mortgage rates may be helping to increase purchase applications but they have yet to trigger much response from home builders. However much the week's retail sales and trade data have boosted the outlook for the coming week's first-quarter U.S. GDP report, residential investment looks very likely to extend its dismal run.
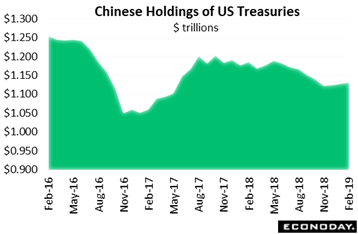 The trade deficit is only one imbalance for the U.S.; the other is the government's deepening deficit which is funded, of course, through the issuance of U.S. Treasuries. During the 2016 presidential campaign and talk of U.S. action against the Chinese to stem the trade deficit, Chinese holdings of U.S. Treasuries, though still enormous, did begin to move lower from $1.250 trillion at the beginning of 2016 to a low of $1.050 trillion at the time of Donald Trump's election. But Chinese accounts soon began to replenish their holdings which, though, have never quite returned to the pre-election levels. In the latest month, as tracked by the Treasury International Capital report, Chinese accounts added $4.2 billion to their holdings for a total of $1.131 trillion. An amicable outcome to the ongoing trade talks between the two nation's could see holdings in China move back higher, and there definitely is strong global demand for U.S. Treasuries which, compared to bonds in Germany or Japan or the UK, have much higher yields. Substantial gains underway this year in global stock markets, including a 13.9 percent increase for the Dow, have not come at the expense of U.S. Treauries with yields on both the 2-year and 10-year maturities down 12 basis points so far this year, to 2.38 and 2.56 percent respectively. For inversion hounds, the spread between these two central issues, steady at 18 basis points, is not indicating, at least so far this year, an increasing risk of recession. The trade deficit is only one imbalance for the U.S.; the other is the government's deepening deficit which is funded, of course, through the issuance of U.S. Treasuries. During the 2016 presidential campaign and talk of U.S. action against the Chinese to stem the trade deficit, Chinese holdings of U.S. Treasuries, though still enormous, did begin to move lower from $1.250 trillion at the beginning of 2016 to a low of $1.050 trillion at the time of Donald Trump's election. But Chinese accounts soon began to replenish their holdings which, though, have never quite returned to the pre-election levels. In the latest month, as tracked by the Treasury International Capital report, Chinese accounts added $4.2 billion to their holdings for a total of $1.131 trillion. An amicable outcome to the ongoing trade talks between the two nation's could see holdings in China move back higher, and there definitely is strong global demand for U.S. Treasuries which, compared to bonds in Germany or Japan or the UK, have much higher yields. Substantial gains underway this year in global stock markets, including a 13.9 percent increase for the Dow, have not come at the expense of U.S. Treauries with yields on both the 2-year and 10-year maturities down 12 basis points so far this year, to 2.38 and 2.56 percent respectively. For inversion hounds, the spread between these two central issues, steady at 18 basis points, is not indicating, at least so far this year, an increasing risk of recession.
The stubborn slump in the U.S. housing sector had appeared certain, and may still appear certain, to be coming to an end, if nothing less due to the decline in interest rates not to mention what remains a very strong labor market. But a crack in U.S. housing, a substantial sector that could sap the strength of the U.S. consumer, still seems like a remote risk. And the latest signs out of the global economy, apart from inflation, are looking better. The assumption for global monetary policy hasn't yet turned from a bias, however incremental and however distant, toward lower rates but easing weakness in economic indicators could begin to move expectations back to neutral if not back to higher rates.
**Jeremy Hawkins contributed to this article
The U.S. housing sector, which is under close focus following March's poor results for starts and permits, opens the week beginning with existing home sales on Monday followed on Tuesday by new home sales and house prices from the FHFA. Moderation for all three reports is the unwelcome expectation. U.S. manufacturing has also been struggling and will get anecdotal updates from the Richmond and Kansas City Feds as well as a definitive update from Thursday's durable goods report. The big news comes on Friday with the first estimate for first-quarter GDP where improvement in net exports and a build for inventories are expected to offset moderate slowing in consumer spending, making for respectable 2.0 percent headline growth.
Confidence readings are on tap out of Europe beginning with the Eurozone consumer confidence on Tuesday and France's business climate indicator and Germany's Ifo survey both on Wednesday. Forecasters see all three showing modest improvement. A policy announcement from the Bank of Canada will top that nation's news on Wednesday in a meeting that follow the bank's dovish shift in March. The week's Asian news will be centered in Japan starting on Thursday with the latest Bank of Japan announcement. Friday morning local time and Thursday evening U.S. and European time will see the Japanese unemployment rate, industrial production, and retail sales amid what are mixed expectations.
US: Existing Home Sales for March (08:30 EDT; 12:30 GMT)
Consensus Forecast, Annualized Rate: 5.300 million
Consensus Range: 5.200 to 5.410 million
At a consensus 5.300 million annual rate, understandable moderation is the call for March US existing home sales which in February surged 11.8 percent to a 5.510 million rate. Even with February's gain, sales of existing home sales were still down year-on-year, at minus 1.8 percent.
US: FHFA House Price Index for February (10:00 EDT; 14:00 GMT)
Consensus Forecast, Month-to-Month Change: 0.3%
Consensus Range: 0.3% to 0.5%
Give back from a surprisingly large jump in January is what forecasters see for February's FHFA house price index, at a consensus gain of 0.3 percent vs the prior month's rise of 0.6 percent. Despite the strength of January's report, the month's year-on-year rate of 5.6 percent was a 3-year low.
EZ: EC Consumer Confidence Flash for April (10:00 EDT; 14:00 GMT; 16:00 CEST)
Consensus Forecast: -6.9%
The European Commission's consumer confidence flash is expected to improve for a fourth straight month yet only very slightly, to minus 6.9 in April vs March's minus 7.2.
US: New Home Sales for March (10:00 EDT; 14:00 GMT)
Consensus Forecast, Annualized Rate: 645,000
Consensus Range: 630,000 to 660,000
US new home sales are very volatile but have, nevertheless, been getting a boost from low mortgage rates and trending higher. Yet expectations for March are looking for an unwelcome retreat, to 645,000 from February's annual rate of 667,000.
US: Richmond Fed Manufacturing Index for April (10:00 EDT; 14:00 GMT)
Consensus Forecast: 12
Consensus Range: 10 to 13
A strong rise for new orders and employment were the highlights of March's U.S. Richmond Fed report where, however, backlogs have been in deep contraction. The April consensus for Richmond is 12 vs March's 10.
FR: Business Climate Indicator for April (02:45 EDT; 06:45 GMT; 08:45 CEST)
Consensus Forecast: 105
The business climate indicator for France is expected to improve 3 points in April to 105. March's 102 reading was the weakest since June 2016 reflecting slowing output that offset a steady showing for new orders.
DE: Ifo Survey for April (04:00 EDT; 08:00 GMT; 10:00 CEST)
Consensus Forecast: 99.9
The consensus for Germany's Ifo Survey of business confidence is 99.9 in April vs 99.6 in March, a month when the index posted its first rise since last August. Its 5-year average is 101.1.
CA: Bank of Canada Announcement (10:00 EDT; 14:00 GMT)
Consensus Forecast: 1.75 percent
No change is the call for the Bank of Canada which is expected to hold its overnight target rate at 1.75 percent. In the last announcement in March, policy makers removed their tightening bias in acknowledgement of slowing growth. Also released will be the quarterly monetary policy report which will offer projections for inflation and growth.
US: Durable Goods Orders for March (08:30 EDT; 12:30 GMT)
Consensus Forecast, Month-to-Month Change: 0.8%
Consensus Range: -0.5% to 1.9%
Durable Goods Orders, Ex-Transportation
Consensus Forecast: 0.2%
Consensus Range: 0.1% to 0.4%
Core Capital Goods Orders (Nondefense Ex-Aircraft)
Consensus Forecast: 0.1%
Consensus Range: 0.1% to 0.1%
Weakness in both orders and shipments of core capital goods underscored in February what was another disappointing durable goods report. For March, forecasters see US durable goods orders rising 0.8 percent with ex-transportation orders up only 0.2 percent to extend their flat run. Core capital goods orders are expected to inch 0.1 percent higher.
US: Kansas City Manufacturing Index for April (11:00 EDT; 15:00 GMT)
Consensus Forecast: 10
Consensus Range: 10 to 13
Steady and solid growth is the forecast for April's Kansas City manufacturing index, at a consensus 10 which would be unchanged from March which was the best showing for this index since November.
JP: Unemployment Rate for March (19:30 EDT Thursday; 23:30 GMT Thursday; 08:30 JST Friday)
Consensus Forecast: 2.4%
March's unemployment rate in Japan is expected to edge higher to 2.4 percent vs 2.3 percent in February, a month that saw a 2 tenths downtick and was just above the multi-decade low of 2.2 percent recorded in May 2018. The unemployment rate has been at or below 2.5 percent since the start of 2018.
JP: Industrial Production for March (19:50 EDT Thursday; 23:50 GMT Thursday; 08:50 JST Friday)
Consensus Forecast: -0.1%
Industrial production in March is expected to slip a month-to-month 0.1 percent following a rise of 1.4 percent in April that saw increases for vehicles, electrical machinery and information & communications equipment.
JP: Retail Sales for March (19:50 EDT Thursday, 23:50 GMT Thursday; 08:50 JST Friday)
Consensus Forecast, Year-on-Year: 0.8%
At 0.8 percent year-on-year, forecasters see Japanese retail sales in March accelerating from February's unexpectedly low 0.4 percent increase which was the weakest since October 2017. February was held down by slowing fuel sales as well as food & beverage sales which offset a solid rise for vehicles.
US: Real GDP: 1st Quarter, 1st Estimate, Annualized Rate (08:30 EDT; 12:30 GMT)
Consensus Forecast: 2.0%
Consensus Range: 1.4% to 2.8%
Real Consumer Spending, Annualized Rate
Consensus Forecast: 1.1%
Consensus Range: 0.3% to 2.6%
GDP Price Index
Consensus Forecast: 1.6%
Consensus Range: 1.2% to 2.8%
GDP Core Price Index
Consensus Forecast: 2.1%
Consensus Range: 1.6% to 2.2%
Reflecting expected improvement in trade and a rise in inventories, consensus for the first estimate of US first-quarter GDP is 2.0 percent compared to 2.2 percent in the fourth quarter. Consumer spending rose at a solid 2.5 percent pace in the fourth quarter and slowing to 1.1 percent is the call for the first quarter. The GDP price index is seen at 1.6 percent, up 1 tenth from 1.7 percent in the fourth quarter with the core GDP price index also expected to rise 1 tenth to 2.1 percent.
US Consumer Sentiment Index, Final April (10:00 EDT; 14:00 GMT)
Consensus Forecast: 97.1
Consensus Range: 96.9 to 97.7
Econoday's consensus for the final US consumer sentiment index for April is 97.1 which would be little changed from the weaker-than-expected dip to 96.9 in the month's preliminary reading that was held down a drop in expectations.
|
