|
The week was mostly quiet, a light US calendar and a couple of no-action central bank meetings. A solid gain in Eurozone retail sales highlighted Tuesday’s session and underscored the building momentum of the continent’s economy and what looks to be a pending rate cut from the European Central Bank. Wednesday and Thursday came and went saving Friday for the big surprises: unexpected strength in UK GDP and a surge in Canadian employment that may or may not push back the outlook for a Bank of Canada rate cut. But it was the last indicator of the week that offered the biggest surprises, ones that will stir at least some chatter within the Federal Reserve.
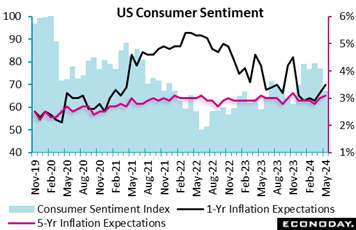 The preliminary University of Michigan consumer sentiment index fell sharply from April’s 77.2 to 67.4 to miss Econoday’s consensus by a very wide 10 points. The index is suddenly at its lowest points since 61.3 in November 2023. The preliminary University of Michigan consumer sentiment index fell sharply from April’s 77.2 to 67.4 to miss Econoday’s consensus by a very wide 10 points. The index is suddenly at its lowest points since 61.3 in November 2023.
Consumers are seeing an unwelcome stalling out in disinflation and are no longer hopeful about a dip in interest rates any time soon. Moderation in the labor market in terms of hiring and wage growth is also dampening confidence, not to mention geopolitical crises that continue to drag on.
Year-ahead inflation expectations jumped 3 tenths to 3.5 percent in May, the highest since 4.5 percent in November. Five-year inflation expectations rose 1 tenth to 3.1 percent in May, their second straight gain and the highest since 3.2 percent in November 2023. Fed policymakers will not pay too much heed to the increase in the 1-year measure which can be volatile and influenced by short-term price fluctuations – particularly for energy costs which have been edging up. The 5-year measure – which is more in line with what policymakers view as the medium term – is not much changed and remains in a narrow range hovering around the 3 percent mark for most of the past three years. Inflation expectations remain anchored, though above pre-pandemic levels.
The Fed's credibility as an inflation fighter remains intact even as the underlying pace of inflation is perceived to be on the rise and above the two percent target.
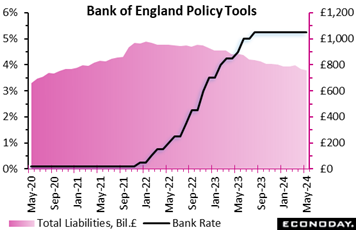 A strong market conviction that policy would not be adjusted proved correct as the Bank of England held its Bank Rate at 5.25 percent. The benchmark rate has been at this level, a 16-year high, since it was last raised by 25 basis points back in August last year. However, the vote showed a modest shift towards possible future rate cuts as the leading dove, Swati Dhingra, was joined by Deputy Governor Dave Ramsden in calling for an immediate 25 basis point ease. With no one wanting to raise rates, the other seven members again all voted for no change. A strong market conviction that policy would not be adjusted proved correct as the Bank of England held its Bank Rate at 5.25 percent. The benchmark rate has been at this level, a 16-year high, since it was last raised by 25 basis points back in August last year. However, the vote showed a modest shift towards possible future rate cuts as the leading dove, Swati Dhingra, was joined by Deputy Governor Dave Ramsden in calling for an immediate 25 basis point ease. With no one wanting to raise rates, the other seven members again all voted for no change.
The tone of the minutes suggests that the Monetary Policy Committee as a whole has become a little more confident that inflation is beginning to behave itself. The April CPI report due in a couple of weeks should show headline inflation sliding to around 2 percent but, as the bank’s latest forecasts show, officials do see upside risks over the second half of the year owing to the unwinding of energy-related base effects. Consequently, policymakers will be wary about pulling the easing trigger too soon. That said, it also noted that developments in the Middle East have so far had only a limited impact on oil prices.
Inflation persistence is still an issue, notably in services where inflation was an elevated 6.0 percent in March. The bank remains cautious about the reliability of the government’s Labour Force Survey but judges that the labour market continues to loosen although it remains relatively tight by historical standards. Pay growth similarly is still high, albeit probably easing.
May's announcement and vote are more dovish than in March but should leave financial markets expecting the first cut in Bank Rate in August or September. For now, June would still seem to be at most just a possibility as some key indicators of inflation simply remain too far above the two percent target.
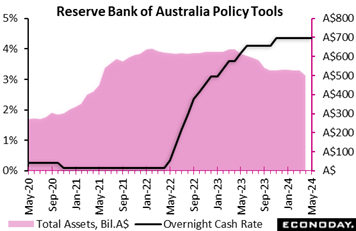 The Reserve Bank of Australia left its main policy rate, the cash rate, unchanged at 4.35 percent in line with the consensus forecast. Officials increased this rate by 25 basis points in November but have otherwise left it unchanged since mid-2023, reflecting their assessment that aggressive policy tightening over the previous twelve months will pull down inflation to their two percent to three percent target. The Reserve Bank of Australia left its main policy rate, the cash rate, unchanged at 4.35 percent in line with the consensus forecast. Officials increased this rate by 25 basis points in November but have otherwise left it unchanged since mid-2023, reflecting their assessment that aggressive policy tightening over the previous twelve months will pull down inflation to their two percent to three percent target.
In their statement, officials noted that "inflation continues to moderate, but is declining more slowly than expected". Though the most recent monthly CPI data showed headline inflation picking up from 3.4 percent in February to 3.5 percent in March, quarterly data show headline and underlying rates easing from levels recorded in the three months to December. Officials still expect this downward trend to continue, forecasting inflation to return to its target range in the second half of 2025 based on an assumption that policy rates, in line with market expectations, have peaked at their current level and will remain around that level for the rest of the year before falling to around 3.9 percent by the end of next year.
But the bank said it “is not ruling anything in or out” and warned that "recent data have demonstrated that the process of returning inflation to target is unlikely to be smooth". The RBA's next meeting is scheduled for mid-June.
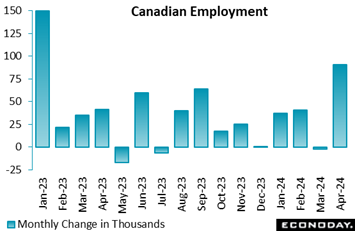 The Canadian labor market was stronger than expected in April, as employment soared 90,400 on the month, more than five times as much as expected by forecasters in Econoday’s survey. This is the largest gain since January 2023. Nevertheless, the unemployment rate remained unchanged at 6.1 percent though the participation rate edged up to 65.4 from 65.3 percent. The Canadian labor market was stronger than expected in April, as employment soared 90,400 on the month, more than five times as much as expected by forecasters in Econoday’s survey. This is the largest gain since January 2023. Nevertheless, the unemployment rate remained unchanged at 6.1 percent though the participation rate edged up to 65.4 from 65.3 percent.
The month’s strong job growth didn't translate into greater wage pressures as average hourly wages eased to an annual 4.7 percent from 5.1 percent in March. Still wage growth remains elevated and may be enough to take a June rate cut off the table.
After a small retreat in March, both full-time and part-time employment rebounded in April, by 40,100 and 50,300, respectively. The number of employees grew 75,900 split between a 50,400 advance in the private sector and a 25,500 rise in public jobs. Self-employment rose 14,500.
Looking at the industry breakdown, gains were concentrated in services, which added 100,700 jobs, while goods-producing industries shed 10,400 positions.
Within services, most sectors added positions, led by professional, scientific and technical services with 25,500 jobs, accommodation and food with 24,200 jobs and health care and social assistance with 17,400 jobs, together creating 67,100 positions.
Within goods-producing industries, construction shed 11,100 positions, agriculture 5,400, and utilities 5,000. Manufacturing created 3,400 jobs and natural resources 7,700.
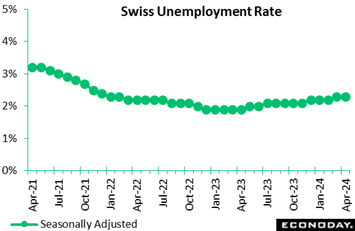 The Swiss labour market weakened again at the start of the quarter. Seasonally adjusted joblessness was up 1,216 or 1.2 percent on the month at 106,420. However, the increase was not steep enough to impact the unemployment rate which held steady at 2.3 percent. Unadjusted, the number of people out of work fell some 1,636 or 1.5 percent to 106,957, lowering the rate by a tick to also 2.3 percent. This was 0.3 percentage points above its level a year ago, narrowing March's gap by 0.1 percentage point. The Swiss labour market weakened again at the start of the quarter. Seasonally adjusted joblessness was up 1,216 or 1.2 percent on the month at 106,420. However, the increase was not steep enough to impact the unemployment rate which held steady at 2.3 percent. Unadjusted, the number of people out of work fell some 1,636 or 1.5 percent to 106,957, lowering the rate by a tick to also 2.3 percent. This was 0.3 percentage points above its level a year ago, narrowing March's gap by 0.1 percentage point.
Meantime, seasonally adjusted vacancies continued to decline with a 677 or 1.7 percent slide on the month to 39,780. This equated to an unadjusted yearly fall of 20.5 percent following a larger 25.3 percent drop in March.
The April update remains consistent with a gently loosening trend in the Swiss labour market and will leave speculators contemplating another cut in the Swiss National Bank’s policy rate in June.
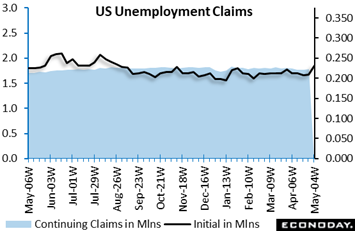 Initial US jobless claims increased 22,000 to a higher-than-expected 231,000 level in the May 4 week, indicating some weakening in the labor market. Although one week is only one week, the jump was noticeable. Initial claims have not been this high since the August 26, 2023 week. The four-week moving average rose 4,750 to 215,000 in the May 4 week, the highest level since the week ended February 10. Insured jobless claims rose 17,000 to 1.785 million in the April 27 week, following three consecutive weeks of declines totaling 42,000. The insured rate of unemployment (for those eligible for benefits) remained steady at 1.2 percent in the week where it has been for more than a year. Initial US jobless claims increased 22,000 to a higher-than-expected 231,000 level in the May 4 week, indicating some weakening in the labor market. Although one week is only one week, the jump was noticeable. Initial claims have not been this high since the August 26, 2023 week. The four-week moving average rose 4,750 to 215,000 in the May 4 week, the highest level since the week ended February 10. Insured jobless claims rose 17,000 to 1.785 million in the April 27 week, following three consecutive weeks of declines totaling 42,000. The insured rate of unemployment (for those eligible for benefits) remained steady at 1.2 percent in the week where it has been for more than a year.
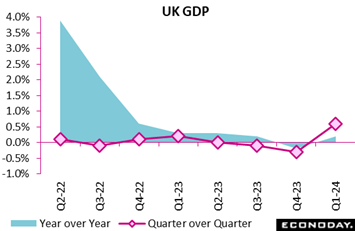 The UK’s recession proved shallow and short-lived. GDP rose a surprisingly robust 0.6 percent in the first quarter compared to the fourth quarter. This was well above Econoday’s consensus and the first positive print since the start of 2023. After 0.3 percent contraction in the previous period, the first quarter advance lifted annual growth from minus 0.2 percent to plus 0.2 percent. The UK’s recession proved shallow and short-lived. GDP rose a surprisingly robust 0.6 percent in the first quarter compared to the fourth quarter. This was well above Econoday’s consensus and the first positive print since the start of 2023. After 0.3 percent contraction in the previous period, the first quarter advance lifted annual growth from minus 0.2 percent to plus 0.2 percent.
The quarterly increase partly reflected gains in household spending (0.2 percent) and gross fixed capital formation (1.4 percent). Within the latter, business investment was up 0.9 percent, building on the previous period's 1.4 percent rise. Government consumption (0.3 percent) also made fresh ground while business inventories (excluding alignment and balancing) had no significant impact.
Headline growth also benefitted from an improvement in net foreign trade although this masked contraction on both sides of the balance sheet. Export volumes fell 1.0 percent which, with their import counterpart down a sharper 2.3 percent, made for a net boost of 0.4 percentage points. Monthly data underscored the strength as output in March rose a sharp 0.4 percent to double the consensus. This points to momentum going into the second quarter.
Confirmation that the economy is growing again will come as no surprise to the BoE but the speed of the recovery will. The results may well leave some MPC members all the more cautious about cutting Bank Rate too soon – especially with services output increasing in every month of the quarter.
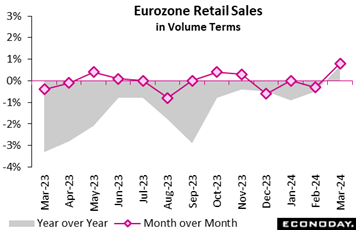 Following a poor February, European retailers enjoyed a much better March. Sales rose 0.8 percent on the month, just beating Econoday’s consensus and their best performance since September 2022. Following a 0.3 fall in February, March's gain lifted annual growth back into positive territory at 0.7 percent. Following a poor February, European retailers enjoyed a much better March. Sales rose 0.8 percent on the month, just beating Econoday’s consensus and their best performance since September 2022. Following a 0.3 fall in February, March's gain lifted annual growth back into positive territory at 0.7 percent.
However, less promisingly, the latest monthly advance was restricted to the food, drink and tobacco and the auto fuel sectors where purchases were up 1.2 percent and 2.0 percent respectively. Non-food demand, excluding auto fuel, was only flat.
Regionally, both France (1.1 percent) and Germany (1.8 percent) posted overall gains but Spain (minus 0.6 percent) saw its third drop in the last four months.
In fact, despite March's advance, first quarter Eurozone volumes were still only 0.1 percent above their level in the previous quarter, implying just a minimal contribution to real GDP growth. Looking ahead, consumer confidence is rising, albeit from historically weak levels, and a probable interest rate cut by the ECB next month should provide a small boost. On balance, household spending this quarter is likely to grow but only modestly.
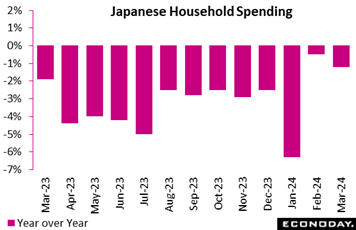 Japan's real household spending fell a smaller-than-expected 1.2 percent on year in March after a 0.5 percent slip in February (down 2.7 percent without the leap-year effect) as consumers remain cautious amid elevated costs for food and other necessities, but it was partly offset by a rebound in automobile purchases thanks to resumed vehicle production after suspension for nearly two months over a safety test scandal. The median forecast was a deeper 2.3 percent drop. Japan's real household spending fell a smaller-than-expected 1.2 percent on year in March after a 0.5 percent slip in February (down 2.7 percent without the leap-year effect) as consumers remain cautious amid elevated costs for food and other necessities, but it was partly offset by a rebound in automobile purchases thanks to resumed vehicle production after suspension for nearly two months over a safety test scandal. The median forecast was a deeper 2.3 percent drop.
The 13th straight year-over-year decrease was led by lower electricity bills paid in March for February, when mild weather reduced heating needs. Households also continued giving less gift money as Covid-era necessity has simplified ceremonies and lowered their costs. Pent-up demand for traveling has waned after subsidies for hotels and transportation aimed at supporting the tourism industry was phased out.
On the month, expenditures rose a seasonally adjusted 1.2 percent, stronger than the median forecast of being unchanged following an equally solid 1.4 percent gain, which was the first increase in five months. Lower temperatures in the first half of March dampened demand for spring clothing but sales of formal wear for graduation and entrance ceremonies were solid.
People continued spending more on eating out, but higher spending on automobiles in March may not necessarily be a welcome sign for the outlook for consumer spending. Compared to a year earlier, the number of vehicles purchased was the same but their prices were higher. The ministry could not determine whether consumers are shifting toward higher end models or high material costs are boosting vehicle prices. In addition, some parents had to send more money to their children studying away from home.
The core measure of real average household spending (excluding housing, motor vehicles and remittance), a key indicator used in GDP calculation, fell a larger 2.0 percent on the year in March after dipping 0.8 percent in February. The underlying trend is in place: Consumers are seeking lower prices for goods and services including a wide range of discount mobile phone communications plans.
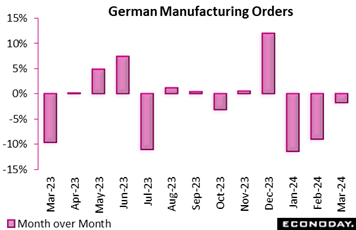 German manufacturing orders extended their downtrend in March. With February's previously reported gain revised away to leave a 0.8 percent drop, a 0.4 percent monthly fall was the third straight decline and much steeper than expected. However, with orders slumping fully 7.7 percent a year ago, annual growth still climbed from minus 9.0 percent to minus 1.8 percent. German manufacturing orders extended their downtrend in March. With February's previously reported gain revised away to leave a 0.8 percent drop, a 0.4 percent monthly fall was the third straight decline and much steeper than expected. However, with orders slumping fully 7.7 percent a year ago, annual growth still climbed from minus 9.0 percent to minus 1.8 percent.
The domestic market was rather weaker, posting a 3.6 percent monthly decrease that easily more than reversed February's 1.0 percent bounce. This left home orders at their lowest level since May 2020 in the midst of Covid. By contrast, overseas demand rose 2.0 percent, led by a 10.6 percent jump in demand from the rest of the Eurozone. Overall orders for capital goods and intermediates fell 0.4 percent but consumer goods were up 3.6 percent.
Separately released data on industrial production fell 0.4 percent on the month in March and fell 3.3 percent on the year. More up-to-date PMI manufacturing survey data showed ongoing contraction in the sector in both March and April. German manufacturing remains in the doldrums and until demand begins to recover, the outlook for goods production is only sluggish at best.
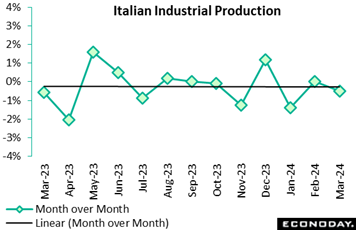 Industrial production in Italy was surprisingly weak in March. A 0.5 percent monthly decline easily undershot the market consensus and with February's minimal 0.1 percent gain revised away to no change, means output has not expanded since December. Annual workday adjusted growth was minus 3.5 percent, down from minus 3.3 percent. Industrial production in Italy was surprisingly weak in March. A 0.5 percent monthly decline easily undershot the market consensus and with February's minimal 0.1 percent gain revised away to no change, means output has not expanded since December. Annual workday adjusted growth was minus 3.5 percent, down from minus 3.3 percent.
Weakness was broad-based and but for a 1.7 percent rise in energy, the monthly headline decline would have been still steeper. Intermediates fell only 0.1 percent but consumer goods were down 0.6 percent, their fourth decrease in the last five months, and capital goods fully 3.8 percent.
The March update leaves overall industrial production 1.3 percent lower on the quarter, its fourth straight quarter of negative growth and a reminder of the importance of services to what is a shallow upswing in total output.
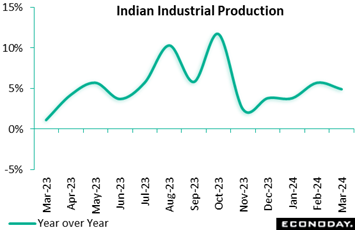 India's index of industrial production rose 4.9 percent on the year in March, slowing from growth of 5.7 percent in February. Within the industrial sector, manufacturing output advanced 5.2 percent on the year after an increase of 5.0 percent previously. Previously published PMI survey data indicated that month-over-month growth in the manufacturing sector accelerated in March and remained very strong in April. India's index of industrial production rose 4.9 percent on the year in March, slowing from growth of 5.7 percent in February. Within the industrial sector, manufacturing output advanced 5.2 percent on the year after an increase of 5.0 percent previously. Previously published PMI survey data indicated that month-over-month growth in the manufacturing sector accelerated in March and remained very strong in April.
The Reserve Bank of India again left policy rates on hold at 6.50 percent at their most recent meeting held last month. Officials advised then that they expect growth to remain supported by investment demand and an improved outlook for consumer spending. March's data showing ongoing strength in industrial production suggest upside risks to the inflation outlook will remain the RBI's primary concern in upcoming policy meetings.
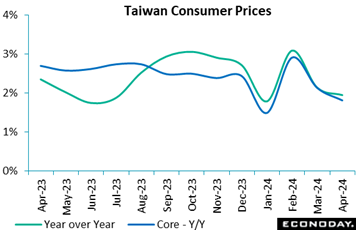 Consumer prices in Taiwan edged up just 0.1 percent on the month in April, well short of the 0.26 percent increase in March. The advance was small enough to trim the yearly inflation rate from 2.14 percent to 1.95 percent, short of the consensus and back below 2.0 percent for the first time since January. Core inflation, which excludes fruits, vegetables, and energy prices, was 1.81 percent, down from 2.13 percent in March and 2.90 percent in February. Consumer prices in Taiwan edged up just 0.1 percent on the month in April, well short of the 0.26 percent increase in March. The advance was small enough to trim the yearly inflation rate from 2.14 percent to 1.95 percent, short of the consensus and back below 2.0 percent for the first time since January. Core inflation, which excludes fruits, vegetables, and energy prices, was 1.81 percent, down from 2.13 percent in March and 2.90 percent in February.
The sensitivity of the Central Bank of the Republic of China (Taiwan) to inflationary pressures was reflected in its unexpected decision to increase its main policy rate by 12.5 basis points to 2.00 percent in March. However, the central bank has already said that it expects both the headline and core rates to exceed 2 percent this year. Consequently, the April decline in both measures should be well received and should reduce the likelihood of any additional near-term tightening.
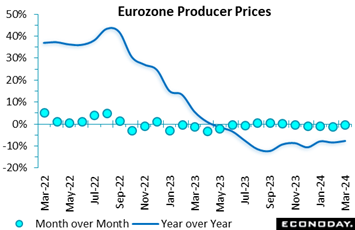 Producer prices in the Eurozone fell for a fifth straight month in March. However, following a slightly steeper revised 1.1 percent drop in February, a 0.4 percent monthly decline was the smallest decrease of the sequence and slightly shallower than the market consensus. Annual inflation rose from minus 8.5 percent to minus 7.8 percent, its least negative reading since July 2023. Producer prices in the Eurozone fell for a fifth straight month in March. However, following a slightly steeper revised 1.1 percent drop in February, a 0.4 percent monthly decline was the smallest decrease of the sequence and slightly shallower than the market consensus. Annual inflation rose from minus 8.5 percent to minus 7.8 percent, its least negative reading since July 2023.
Moreover, March's monthly slide was again wholly attributable to energy where prices were down a further 1.8 percent. Excluding this category, the PPI was up 0.2 percent, its third consecutive increase albeit only enough to leave the yearly underlying rate steady at minus 1.3 percent. Elsewhere, capital goods, intermediates and consumer durables all increased 0.1 percent while non-durables rose 0.4 percent.
The March report provides further evidence that deflationary pressures in Eurozone manufacturing are on the wane. Core prices are still well below their level a year ago but the quarterly trend has clearly turned up. That said, the broader picture remains soft and the sector continues to pose few problems for ECB policy.
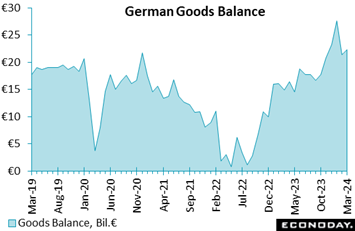 Germany’s seasonally adjusted merchandise trade surplus weighed in at €22.3 billion in March, up from February's €21.4 billion. Unadjusted, the surplus stood at €23.9 billion, just slightly short of the €24.3 billion posted in March 2023. Germany’s seasonally adjusted merchandise trade surplus weighed in at €22.3 billion in March, up from February's €21.4 billion. Unadjusted, the surplus stood at €23.9 billion, just slightly short of the €24.3 billion posted in March 2023.
The monthly headline improvement reflected stronger exports which rose 0.9 percent and so easily outpaced a 0.3 percent increase in imports. However, on the year, exports were still down an unadjusted 8.3 percent while imports were off a steeper 9.6 percent.
The trade balance remains in a very healthy surplus and total exports provided a boost to first quarter real GDP growth.
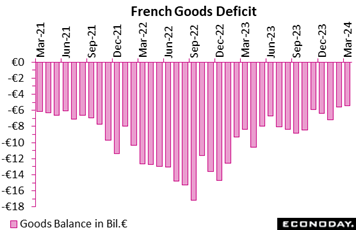 France’s seasonally adjusted trade balance was in a €5.47 billion deficit in March, down from February's €5.61 billion and the smallest shortfall since January 2021. The improvement reflected a marked strengthening on both sides of the balance sheet as exports rose a monthly 2.9 percent and imports 2.4 percent. However, while the 3-monthly change in the former now stands at 0.7 percent, the latter's rate remains sub-zero at minus 0.4 percent. On this basis, the trend in the deficit is improving at a moderate pace. Annual export growth was minus 1.3 percent, well above its minus 7.0 percent import counterpart. France’s seasonally adjusted trade balance was in a €5.47 billion deficit in March, down from February's €5.61 billion and the smallest shortfall since January 2021. The improvement reflected a marked strengthening on both sides of the balance sheet as exports rose a monthly 2.9 percent and imports 2.4 percent. However, while the 3-monthly change in the former now stands at 0.7 percent, the latter's rate remains sub-zero at minus 0.4 percent. On this basis, the trend in the deficit is improving at a moderate pace. Annual export growth was minus 1.3 percent, well above its minus 7.0 percent import counterpart.
However, for overall foreign net trade, much of the recent gain has been due to weaker import prices as total net exports volumes had only a neutral impact on first quarter real GDP growth.
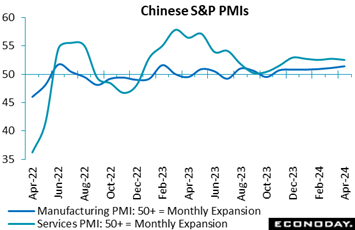 S&P’s business activity index for China's services sector eased from 52.7 to 52.5, while the previously-published headline index for the manufacturing PMI survey rose from 51.1 in March to 51.4 in April. Official PMI survey data published in the prior week showed steady but subdued expansion in the manufacturing sector and somewhat weaker growth in the non-manufacturing sector in April. S&P’s business activity index for China's services sector eased from 52.7 to 52.5, while the previously-published headline index for the manufacturing PMI survey rose from 51.1 in March to 51.4 in April. Official PMI survey data published in the prior week showed steady but subdued expansion in the manufacturing sector and somewhat weaker growth in the non-manufacturing sector in April.
Respondents to S&P's service sector survey reported stronger growth in output, new orders, and new export orders in April, with the latter growing at the fastest pace in ten months. Payrolls were reported to have fallen for the third consecutive month, largely driven by resignations and redundancies, while the survey's measure of confidence increased for the second month in a row. Respondents also reported weaker growth in input costs but a bigger increase in selling prices.
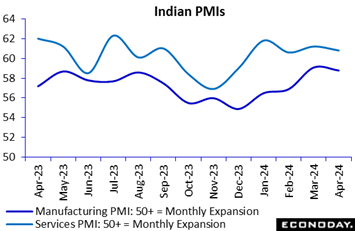 S&P’s services index for India remained very strong in April, with the survey's main business activity index little changed at 60.8 versus 61.2 in March. The manufacturing PMI, published in the prior week, eased to 58.8 from 59.1 in March, the latter the highest level since 2008. With these PMI surveys showing very robust conditions in the Indian economy, the Reserve Bank of India's focus will likely remain on risks to the inflation outlook at its policy meeting next month. S&P’s services index for India remained very strong in April, with the survey's main business activity index little changed at 60.8 versus 61.2 in March. The manufacturing PMI, published in the prior week, eased to 58.8 from 59.1 in March, the latter the highest level since 2008. With these PMI surveys showing very robust conditions in the Indian economy, the Reserve Bank of India's focus will likely remain on risks to the inflation outlook at its policy meeting next month.
Respondents to the service sector survey reported output, new orders, and new export orders all continued to grow at a very strong pace in April. The survey also showed a smaller increase in payrolls and an increase in its measure of business confidence. Respondents also reported smaller but still strong increases in input costs and selling prices in April.
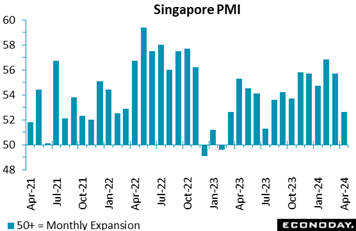 S&P’s Singapore PMI indicates growth in the aggregate economy slowed sharply in April, with the survey's headline index falling from 55.7 in March to 52.6, a nine-month low. Respondents reported weaker domestic demand and price pressures yet greater optimism about the outlook. S&P’s Singapore PMI indicates growth in the aggregate economy slowed sharply in April, with the survey's headline index falling from 55.7 in March to 52.6, a nine-month low. Respondents reported weaker domestic demand and price pressures yet greater optimism about the outlook.
April's survey shows solid but slower growth in output and new orders in April and the first fall in payrolls since July 2023. The survey's measure of business confidence rose to its second-highest level in a year and continues to indicate that firms expect solid growth in output over the next twelve months. Respondents also reported slower growth in input costs but a bigger increase in selling prices.
Global economic data continue to come in very near expectations, at minus 3 for the Relative Performance Index and at plus 3 less prices (RPI-P). Though the outlook for monetary policy varies by region, on net the results point to a steady period for global interest rates.
Overall economic activity in Eurozone had underperformed for almost all of April but May’s early releases have proved surprisingly strong. At 21 and 41 respectively, both the RPI and, in particular, RPI-P, show the latest data quite easily beating market forecasts. ECB policy remains on course for a June ease but beyond that, the path to lower interest rates is much less clear.
Confirmation that the UK recession ended last quarter was provided by a surprisingly large increase in total output. The unexpected strength of the March data boosted the RPI to a solid 41 and the RPI-P to fully 52, the latter’s highest reading since last August. The BoE MPC may be moving towards a cut in Bank Rate but these values suggest that the pressure to ease is not as intense as previously supposed.
A weaker labour market in Switzerland last month carried no surprise but left economic activity in general still disappointingly soft. The RPI closed out the week at minus 10 and the RPI-P at minus 28, leaving the door still open for another 25 basis point ease in the SNB’s policy rate in June.
In Japan, the RPI’s move into positive surprise territory proved only brief as the gauge ended the week at minus 19. Still, weakness here only reflects unexpectedly soft prices as, at 4, the RPI-P held just above zero.
China ended the week exactly at zero for the both the RPI and RPI-P indicating that the countries, on net, are hitting Econoday’s consensus estimates on the nose and suggest that pressure on authorities to stimulate the economy may be easing.
Canada remains in negative ground though April’s strong employment report helped lift the RPI by more than 20 points to, however, a still sizably negative minus 31. Wage growth is a concern for the Bank of Canada but a cut in interest rates next month is still a possibility.
Both the RPI and RPI-P are at minus 26 to extend a building run of underperformance for the US economy. Yet with inflation and inflation expectations not showing improvement, it would take greater underperformance to prompt Federal Reserve officials to talk up rate cuts.
**Contributing to this article were Jeremy Hawkins, Brian Jackson, Mace News, Max Sato, and Theresa Sheehan
Indian consumer prices open the calendar on Monday and are expected to remain steady just under 5 percent and nearly a point above the Bank of India’s target. Wages in Tuesday’s UK labour market report, at a consensus 5.4 percent, are expected to cool slightly but more than justify the Bank of England’s decision to hold rates steady.
Marginal moderation is the call for US consumer prices on Wednesday, to a 3.4 percent rate overall and 3.6 percent for the ex-food ex-energy core. US retail sales on Wednesday and industrial production on Thursday are both expected to show limited gains.
Contraction is expected for Japan’s first estimate of first-quarter GDP on Thursday, pulled down by both consumer spending and business investment. Australia’s labour force report also on Thursday is expected to show a rebound in hiring.
The week closes with Chinese industrial production and retail sales on Friday; noticeable acceleration is expected for both.
Chinese CPI for April (Sat 0930 CST; Sat 0130 GMT; Fri 2130 EDT)
Consensus Forecast, Year over Year: 0.2%
April’s year-over-year rate is expected at 0.2 percent versus March’s 0.1 percent rate. China’s CPI peaked in January last year at 2.1 percent.
Chinese PPI for April (Sat 0930 CST; Sat 0130 GMT; Fri 2130 EDT)
Consensus Forecast, Year over Year: -2.4%
Producer prices have been in long annual contraction. April’s consensus is minus 2.4 percent on the year versus March’s as-expected minus 2.8 percent.
Indian CPI for April (Mon 1730 IST; Mon 1200 GMT; Mon 0800 EDT)
Consensus Forecast, Year over Year: 4.80%
Consumer prices are expected to hold steady at 4.80 percent on the year in April versus 4.85 and 5.09 percent in the two prior months. Four percent is the midpoint of the Bank of India’s target range.
UK Labour Market Report (Tue 0700 BST; Tue 0600 GMT; Tue 0200 EDT)
Consensus Forecast, ILO Unemployment Rate for three months to April: 4.3%
Consensus Forecast, Average Earnings for three months to April: 5.4%
The ILO unemployment rate for the three months to April is expected to edge higher to 4.3 percent versus 4.2 percent in March. Average earnings growth for the three months to April are seen easing slightly to 5.4 percent from 5.6 percent in the two prior reports.
Indian Wholesale Price Index for April (Tue 1200 IST; Tue 0630 GMT; Tue 0230 EDT)
Consensus Forecast, Year over Year: 1.1%
Wholesale prices are expected to come in at a year-over-year 1.1 percent in April versus 0.53 percent in March.
Germany: ZEW Survey for May (Tue 1100 CEST; Tue 0900 GMT; Tue 0500 EDT)
Consensus Forecast, Economic Sentiment: 45.0
ZEW’s expectations component (economic sentiment) is seen rising to 45.0 versus April’s 42.9. This component has exceeded expectations for nine months in a row.
Eurozone Industrial Production for March (Wed 1100 CEST; Wed 0900 GMT; Wed 0500 EDT)
Consensus Forecast, Month over Month: -0.5%
Production in March is expected to fall a monthly 0.5 percent after rising 0.8 percent in February that, however, was nowhere close to reversing January’s 3.0 percent decline. March will need a monthly jump of fully 4.0 percent just to keep the quarter flat.
Canadian Housing Starts for May (Mon 0815 EDT; Mon 1215 GMT)
Consensus Forecast, Annual Rate: 240,000
Housing starts are expected to hold steady 240,000 in May versus April’s 242,000.
US CPI for April (Wed 1230 GMT; Wed 0830 EDT)
Consensus Forecast, Month over Month: 0.3%
Consensus Forecast, Year over Year: 3.4%
US CPI Core, Less Food & Energy
Consensus Forecast, Month over Month: 0.3%
Consensus Forecast, Year over Year: 3.6%
Consumer prices have come in on the high end of Econoday’s consensus ranges the past four reports. Overall prices as well as the core both rose an overheated 0.4 percent in March with April consensus estimates at 0.3 percent for both. Annual rates, at 3.5 and 3.8 percent respectively, didn’t show any improvement in March with limited improvement expected for April, at 3.4 and 3.6 percent.
US Retail Sales for April (Wed 0830 EDT; Wed 1230 GMT)
Consensus Forecast, Month over Month: 0.4%
Consensus Forecast, Ex-Vehicles - M/M: 0.2%
Consensus Forecast, Ex-Vehicles, Ex-Gas - M/M: 0.1%
April sales are expected to rise 0.4 percent versus March’s better-than-expected 0.7 percent increase. March’s ex-auto sales jumped 1.1 percent with April expected to rise 0.2 percent; April ex-auto ex-gas is expected to gain only 0.1 percent.
Canadian Manufacturing Sales for March (Wed 08:30 EDT; Wed 1230 GMT)
Consensus Forecast, Month over Month: -2.8%
After increasing 0.7 percent in February that, however, followed no change in January, manufacturing sales in March are expected to fall 2.8 percent.
Japanese First-Quarter GDP, First Estimate (Thu 0850 JST; Wed 2350 GMT; Wed 1950 EDT)
Consensus Forecast, Quarter over Quarter: -0.4%
Consensus Forecast, Annualized Rate: -1.6%
Pulled down by expected weakness for both consumer spending and business investment, GDP for the first quarter is expected to fall a quarterly 0.4 percent and fall 1.6 percent on an annualized basis. These would compare with 0.1 percent expansion in the fourth quarter and annualized expansion of 1.2 percent.
Australian Labour Force Survey for April (Thu 1130 AEST; Thu 0130 GMT; Wed 2130 EDT)
Consensus Forecast, Employment: 24,000
Consensus Forecast, Unemployment Rate: 3.9 percent
Employment in April is expected to rebound 24,400 versus March’s weaker-than-expected decrease of 6,600. Unemployment is expected to edge 1 tenth higher to 3.9 percent.
US Industrial Production for April (Thu 1315 GMT; Fri 0915 EDT)
Consensus Forecast, Month over Month: 0.1%
Consensus Forecast, Manufacturing Output - M/M: 0.2%
Consensus Forecast, Capacity Utilization Rate: 78.4%
After rising 0.4 percent in March, industrial production is expected to edge 0.1 percent higher in April. Manufacturing output is expected to rise 0.2 percent after rising a solid 0.5 percent. Capacity utilization is expected to hold steady at 78.4 percent.
Chinese Fixed Asset Investment for April (Fri 1000 CST; Fri 0200 GMT; Thu 2200 EDT)
Consensus Forecast, Year-to-Date on Y/Y Basis: 4.7%
Fixed asset investment for the year-to-date to April is expected to rise 4.7 percent. This would compare with better-than-expected growth of 4.5 percent in March.
Chinese Industrial Production for April (Fri 1000 CST; Fri 0200 GMT; Thu 2200 EDT)
Consensus Forecast, Year over Year: 5.3%
Year-over-year growth in industrial production percent in March rose a lower-than-expected 4.5 percent. Expectations for April is a pop higher to 5.3 percent.
Chinese Retail Sales for April (Fri 1000 CST; Fri 0200 GMT; Thu 2200 EDT)
Consensus Forecast, Year over Year: 3.7%
After rising a year-over-year 3.1 percent in March, which was well short of expectations for 5.0 percent, retail sales in April are expected to rise 3.7 percent.
|
