|
The longer employment is solid, the longer the Federal Reserve can continue fighting inflation and push back a rate cut until after the November election. Yet the US labor market does appear to be cooling, though only slowly. Job openings in the JOLTS report actually edged higher in May to 8.1 million while layoffs and discharges rose only modestly to a tame 1.7 million. Workers voluntarily leaving their jobs – offering an indication of movement toward higher paying employment – has settled down, rising only fractionally to 3.5 million. And the number of layoff announcements as tracked by Challenger’s monthly report has eased through the year, to under 50,000 in June in another reading consistent with healthy demand for labor. Nevertheless, the most important measure of US employment, released at week’s end, does offer some support for rate-cut hopes.
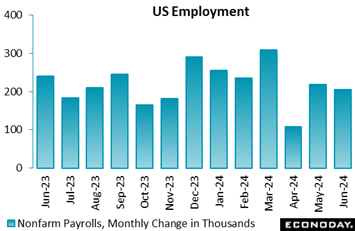 Although June’s payroll increase was above market expectations, steep downward revisions to the two prior months indicate that recent job gains have been weaker than previously thought. Nonfarm payrolls rose 206,000 in June compared to Econoday’s consensus for 189,000. However, the net revision for May and April was down 111,000. This puts the monthly average for nonfarm payroll growth at 177,000 in the second quarter, down substantially from 267,000 in the first quarter. This alone will excite expectations that the Fed could cut rates sooner rather than later. Although June’s payroll increase was above market expectations, steep downward revisions to the two prior months indicate that recent job gains have been weaker than previously thought. Nonfarm payrolls rose 206,000 in June compared to Econoday’s consensus for 189,000. However, the net revision for May and April was down 111,000. This puts the monthly average for nonfarm payroll growth at 177,000 in the second quarter, down substantially from 267,000 in the first quarter. This alone will excite expectations that the Fed could cut rates sooner rather than later.
Moreover, the increase in private payrolls in June was only 136,000 which was below expectations for 160,000. Jobs at goods-producers rose only 19,000, mainly from construction that added 27,000 jobs while manufacturers cut 8,000. Private service-producers added 117,000 new jobs with most of that in an 82,000 rise for private education and health services. June’s gains were centered in government which rose 70,000, with substantial hiring of 26,000 and 39,000 at the state and local levels.
The pace of increases for average hourly earnings held little changed in June. The month-over-month rise was 0.3 percent, down somewhat from 0.4 percent in May but consistent with a pace of modest rises. The same can be said for the year-over-year increase of 3.9 percent after 4.1 percent in May. Competitive pressures on compensation have been easing but are still tangible as businesses seek workers with the right skills and experience.
The unemployment rate rose a tenth to 4.1 percent for the highest level since November 2021. Yet historically, the rate remains relatively low. The U-6 rate of unemployment – the broadest measure of unemployment including discouraged workers and those marginally attached to the workforce– held unchanged at 7.4 percent. Labor force participation did rise a tenth to 62.6 percent but a one-month increase is not a trend for a rate that has been flat for the past year.
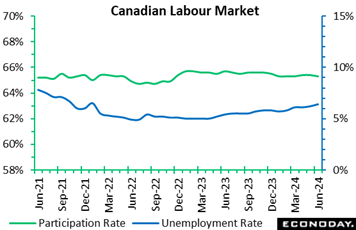 Employment growth in Canada fell 1,400 in June to miss Econoday's consensus for a 21,300 gain and following May's modest 27,000 rise. The unemployment rate jumped from 6.2 to 6.4 percent which exceeded the 6.3 percent consensus. Underscoring the weakness was a dip in the participation rate from 65.4 to 65.3 percent and a 0.4 percent fall in total hours worked. The soft results failed to cool average hourly wages which rose from an annual 5.1 to 5.4 percent. Employment growth in Canada fell 1,400 in June to miss Econoday's consensus for a 21,300 gain and following May's modest 27,000 rise. The unemployment rate jumped from 6.2 to 6.4 percent which exceeded the 6.3 percent consensus. Underscoring the weakness was a dip in the participation rate from 65.4 to 65.3 percent and a 0.4 percent fall in total hours worked. The soft results failed to cool average hourly wages which rose from an annual 5.1 to 5.4 percent.
By sector, employment in transportation and warehousing fell 12,000 and public administration fell 8,800. Employment rose 17,000 in accommodation and food services and rose 12,000 in agriculture.
Turning back to unemployment, the rate has now risen 1.3 percentage points over the last year. Only 21.4 percent of the unemployed in May found work in June, which is lower than the 26.7 percent average of the three years before the pandemic. StatCan notes this "may indicate that people are facing greater difficulties finding work in the current labour market".
The Bank of Canada cut rates last month for the first time this cycle and a second cut, given the combination of flat employment growth and rising wages, will be a clear topic of discussion at the bank's meeting later this month on Wednesday, July 24.
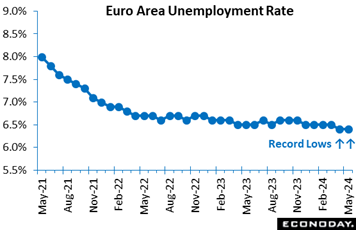 Joblessness increased 38,000 in May but unwound only a portion of April's 85,000 drop. Indeed, the rise was too small to lift the unemployment rate which, at 6.4 percent, remained at April’s record low and below Econoday’s consensus for 6.5 percent. Joblessness increased 38,000 in May but unwound only a portion of April's 85,000 drop. Indeed, the rise was too small to lift the unemployment rate which, at 6.4 percent, remained at April’s record low and below Econoday’s consensus for 6.5 percent.
The stable headline reflected no change in Germany (3.3 percent), Italy (6.8 percent) and Spain (11.7 percent) but masked a 0.1 percentage point increase in France (7.4 percent).
In an echo of the US, the Eurozone labour market remains tight enough to ensure that the European Central Bank will adopt a cautious approach to future rate cuts. Combined with June's rather mixed inflation report (see the Inflation section below), May’s jobless update should ensure that the central bank will be embarking on its summer recess with its policy stance unchanged.
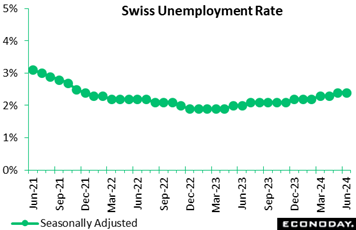 Switzerland’s labour market, by contrast, has been losing ground. Seasonally adjusted joblessness rose 2,750 or 2.5 percent on the month to 112,032. However, this was not enough to lift the unemployment rate which was unchanged at 2.4 percent, matching both the market consensus and its highest mark since December 2021. Unadjusted, the number of people out of work dipped 947 or 0.9 percent. The June update extends the trend increase in joblessness that began at the start of last year. As such, the data bolster the chances of inflation remaining below 2 percent and so support last month's decision by the Swiss National Bank to cut its policy rate for the second time this year. Switzerland’s labour market, by contrast, has been losing ground. Seasonally adjusted joblessness rose 2,750 or 2.5 percent on the month to 112,032. However, this was not enough to lift the unemployment rate which was unchanged at 2.4 percent, matching both the market consensus and its highest mark since December 2021. Unadjusted, the number of people out of work dipped 947 or 0.9 percent. The June update extends the trend increase in joblessness that began at the start of last year. As such, the data bolster the chances of inflation remaining below 2 percent and so support last month's decision by the Swiss National Bank to cut its policy rate for the second time this year.
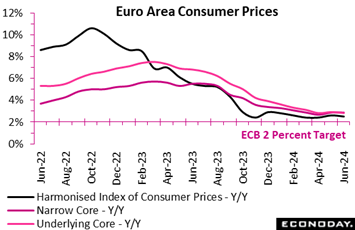 Following a bounce higher in May, inflation provisionally decelerated in June. A 0.2 percent monthly rise in the flash HICP put the annual rate at 2.5 percent, a tick lower than May’s 2.6 percent and in line with the market consensus. However, the dip failed to reverse all of May's gain from April’s 2.4 percent and leaves a broadly flat trend in place. Inflation is now 0.5 percentage points above the ECB’s medium-term target. Following a bounce higher in May, inflation provisionally decelerated in June. A 0.2 percent monthly rise in the flash HICP put the annual rate at 2.5 percent, a tick lower than May’s 2.6 percent and in line with the market consensus. However, the dip failed to reverse all of May's gain from April’s 2.4 percent and leaves a broadly flat trend in place. Inflation is now 0.5 percentage points above the ECB’s medium-term target.
Moreover, the core rates also showed signs of stickiness. The narrowest measure was only unchanged at 2.9 percent, a tick above expectations, while the measure excluding just energy and unprocessed food edged just 0.1 percentage point lower to 2.8 percent. Services were again an issue with the rate here holding steady at a solid 4.1 percent, some 0.4 percentage points above April's recent low. Elsewhere, non-energy industrial goods were similarly steady but at only 0.7 percent while energy (0.2 percent after 0.3 percent) and food, alcohol and tobacco (2.5 percent after 2.6 percent) both had a minor negative impact.
Regionally, headline inflation cooled in France (2.5 after 2.6 percent), Germany (2.5 after 2.8 percent), and Spain (3.5 after 3.8 percent) but edged firmer from an easily sub-target level in Italy (0.9 percent after 0.8 percent).
The flash June data are unlikely to prompt any real speculation about a second successive cut by the ECB this month. By and large, inflationary pressures still seem to be headed in the right direction but progress is clearly becoming increasingly hard. Governing Council members will need further reassurance that the medium-term trajectory remains on course before pulling the trigger on another ease.
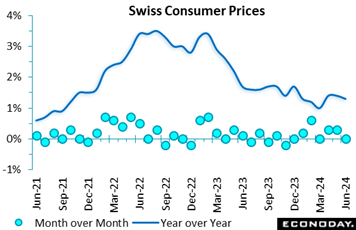 Consumer prices in Switzerland continued to undershoot expectations in June. A flat monthly performance was a couple of ticks short of the market consensus and soft enough to trim the annual inflation rate from 1.4 percent to 1.3 percent, a 3-month low. Consumer prices in Switzerland continued to undershoot expectations in June. A flat monthly performance was a couple of ticks short of the market consensus and soft enough to trim the annual inflation rate from 1.4 percent to 1.3 percent, a 3-month low.
The dip in overall inflation masked a 0.2 percent increase in domestic prices which left their yearly rate unchanged at 2.0 percent. Rather, it reflected a 0.5 percent fall in import prices which reduced their annual rate from minus 0.6 percent to minus 0.8 percent.
Within the CPI basket seasonal sales saw the prices of clothing and footwear tumble a sizeable 2.6 percent versus May. Household goods and services (minus 1.8 percent) were also sharply weaker as was petroleum products (minus 1.3 percent). However, recreation and culture (1.4 percent) posted a hefty gain and there were rises too in restaurants and hotels (0.5 percent), food and soft drink (0.4 percent) and alcohol and tobacco (0.3 percent). Core prices (ex-food and energy) eased 0.1 percent on the month, lowering the underlying yearly inflation rate from 1.2 percent to 1.1 percent, its lowest print since March.
The June inflation update provides further justification for last month's SNB policy rate cut. Both headline and core inflation have been consistently below 2 percent since June 2023 and with labour market pressures easing, would seem well placed to remain there over coming months.
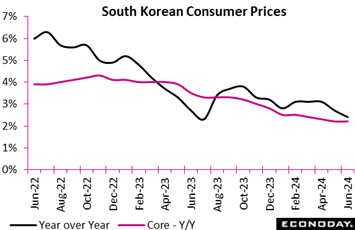 South Korea's consumer price index rose 2.4 percent on the year in June after an increase of 2.7 percent in May, moving closer to the Bank of Korea's 2.0 percent target. The index fell 0.2 percent on the month after advancing 0.1 previously. The fall in headline inflation was largely driven by food prices. These fell 1.0 percent on the month, with the year-over-year increase slowing from 5.1 percent to 3.8 percent. South Korea's consumer price index rose 2.4 percent on the year in June after an increase of 2.7 percent in May, moving closer to the Bank of Korea's 2.0 percent target. The index fell 0.2 percent on the month after advancing 0.1 previously. The fall in headline inflation was largely driven by food prices. These fell 1.0 percent on the month, with the year-over-year increase slowing from 5.1 percent to 3.8 percent.
Underlying price pressures were steady in June. Core CPI, excluding food and energy, rose 2.2 percent on the year, as it did previously, and was flat on the month after a previous increase of 0.2 percent. Core inflation has fallen only slightly from 2.5 percent at the start of the year to its current level. The year-year-over-year increase in prices was relatively steady for most major categories of spending.
At its most recent policy meeting, held late May, the BoK left policy rates on hold. Officials advised then that they had retained their forecast for core inflation to moderate but cautioned that "it is premature to be confident that inflation will converge on the target level". They advised that their restrictive monetary policy stance will continue "until such confidence is established". June's data showing little evidence that underlying price pressures are abating will likely reinforce officials' view that policy settings will need to remain restrictive in upcoming meetings. The BoK's next meets in the coming week.
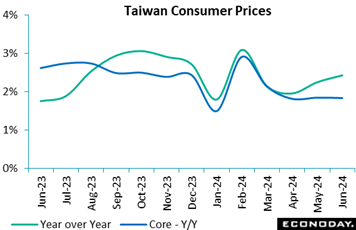 Taiwan's headline consumer price index rose 0.31 percent on the month in June after an increase of 0.20 percent in May, with the year-over-year increase picking up from 2.24 percent to 2.42 percent. Core CPI, which excludes fruits, vegetables, and energy prices, fell 0.01 percent on the month in June after falling 0.01 percent in May, with the year-over-year increase easing slightly from 1.84 percent to 1.83 percent. Taiwan's headline consumer price index rose 0.31 percent on the month in June after an increase of 0.20 percent in May, with the year-over-year increase picking up from 2.24 percent to 2.42 percent. Core CPI, which excludes fruits, vegetables, and energy prices, fell 0.01 percent on the month in June after falling 0.01 percent in May, with the year-over-year increase easing slightly from 1.84 percent to 1.83 percent.
The Central Bank of the Republic of China (Taiwan) left its main policy rate unchanged at 2.00 percent at its quarterly policy meeting held last month This follows an increase at its previous meeting in March which took the rate to its highest level since 2008. Forecasts published at that meeting show that officials were more confident that price pressures will moderate in the near-term, with their forecast for annual headline inflation in 2024 revised down from 2.49 percent to 2.12 percent and their forecast for annual core inflation revised down from 2.58 percent to 2.00 percent. Reflecting this assessment, officials concluded that current policy settings remained appropriate.
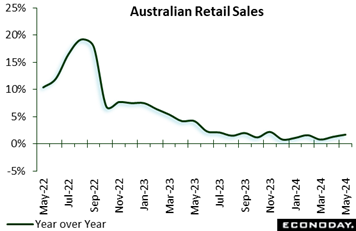 Retail sales in Australia rose 0.6 percent on the month in May after advancing 0.1 percent in April, with year-over-year growth picking up from 1.3 percent to 1.7 percent. With the Australian financial year ending at the end of June, officials noted that sales growth was supported by relatively large end-of-year promotions and discounts taking place relatively early this year. Retail sales in Australia rose 0.6 percent on the month in May after advancing 0.1 percent in April, with year-over-year growth picking up from 1.3 percent to 1.7 percent. With the Australian financial year ending at the end of June, officials noted that sales growth was supported by relatively large end-of-year promotions and discounts taking place relatively early this year.
Performance was mixed on a regional basis, with sales falling on the month in the most populous state, New South Wales, but increasing in the two next most populous states, Victoria and Queensland. Sales rose above the headline pace for food, clothing, and household goods, partly offset by a decline in department store sales.
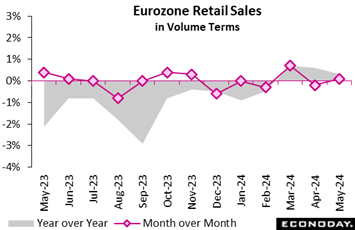
 Retail sales rose 0.2 percent on the month in May, compounding April's marginal 0.1 percent gain though still the fourth advance in the last five months. However, with base effects strongly negative, the latest increase reduced annual workday adjusted growth from 2.2 percent to just 0.4 percent. Retail sales rose 0.2 percent on the month in May, compounding April's marginal 0.1 percent gain though still the fourth advance in the last five months. However, with base effects strongly negative, the latest increase reduced annual workday adjusted growth from 2.2 percent to just 0.4 percent.
Purchases of food, drink and tobacco were unchanged having declined 1.0 percent in April while non-food, ex-auto fuel demand was just 0.1 percent firmer. Auto fuel was also down 0.4 percent.
May's update leaves an essentially flat trend in overall sales – indeed, May's reading matches exactly the level recorded at the start of the year. This is consistent with recent consumer confidence surveys where the improvement seen over the second half of 2023 seems to have run out of steam. A sluggish household sector will have been one factor behind the SNB's decision to cut its policy rate again last month.
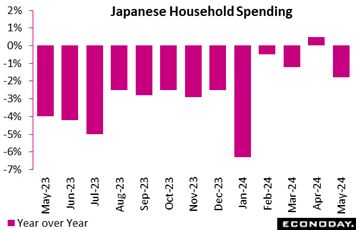 Japan's real household spending unexpectedly slumped 1.8 percent on the year in May, well below the consensus call of a 0.2 percent rise, as consumers slashed purchases of fresh vegetables whose prices had soared on bad weather while the weaker yen discouraged many people from booking overseas package tours. Japan's real household spending unexpectedly slumped 1.8 percent on the year in May, well below the consensus call of a 0.2 percent rise, as consumers slashed purchases of fresh vegetables whose prices had soared on bad weather while the weaker yen discouraged many people from booking overseas package tours.
The decrease, which followed a 0.5 percent rise in April for the first gain in 14 months, was also due to lower electricity bills paid in May after the northern region had mild weather in April. The widespread move among cell phone users to switch to discount plans also continued. Demand for domestic hotel stays has already waned after subsidies for hotels and transportation aimed at supporting the tourism industry were phased out late last year.
On the upside, resumed production and shipments at Toyota group firms in March led to smoother deliveries of vehicles, prompting higher auto purchases. Households also spent more on medical and dental treatment and gave more gift money at weddings and other ceremonies as the economy had entered a post-Covid phase.
The core measure of real average household spending (excluding housing, motor vehicles and remittance), a key indicator used in GDP calculation, fell a sharper 3.4 percent on the year in May after being flat in April and falling 2.0 percent in March.
On the month, real average expenditures by households with two or more people dipped a seasonally adjusted 0.3 percent, after slumping 1.2 percent in April for the first decline in three months and marking a 1.2 percent rise in March. It was weaker than the median forecast of a 0.7 percent rise (forecasts ranged from 0.5 percent to 1.0 percent gains).
In a positive development, the average real income of households with salaried workers posted the first year-over-year increase in 20 months in May, up 3.0 percent, after falling 0.6 percent in April. In nominal terms, the increase was a bigger 6.4 percent, accelerating from a 2.3 percent gain in April. Companies are raising wages at a higher pace this year but overall income was also up on a jump in regular pay in May, which was largely in reaction to an unusually low amount in May 2023.
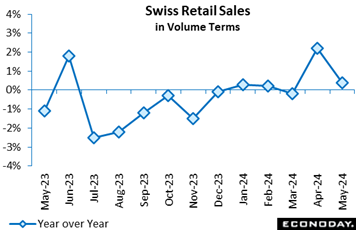
 Demand in the retail sector remained very sluggish in May. Volume sales edged just 0.1 percent higher on the month, matching the market consensus but not fully reversing a 0.2 percent drop in April. The increase reduced annual growth from 0.6 percent to 0.3 percent and means that purchases have risen just 0.5 percent since the end of 2024. Demand in the retail sector remained very sluggish in May. Volume sales edged just 0.1 percent higher on the month, matching the market consensus but not fully reversing a 0.2 percent drop in April. The increase reduced annual growth from 0.6 percent to 0.3 percent and means that purchases have risen just 0.5 percent since the end of 2024.
As it is, May's minimal monthly advance was wholly attributable to gains in food, drink and tobacco (0.7 percent) and auto fuel (0.4 percent). Excluding auto fuel, non-food sales fell 0.2 percent.
Regionally, both France (minus 0.2 percent) and Spain (minus 0.6 percent) posted fresh losses, the former recording a third straight drop. Italy (0.1 percent) matched the headline rise and elsewhere, the picture was again very mixed.
The May data leave Eurozone sales in the first two months of the quarter a modest 0.3 percent above their average level in the first quarter. Absent revisions, June will need a fall of at least 0.9 percent to prevent the sector from contributing positively to GDP growth. Nonetheless, in general spending remains subdued and with consumer confidence still historically soft and improving only very gradually, near-term prospects look little better.
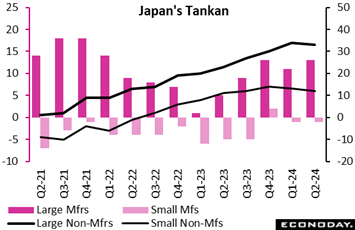 The Bank of Japan's quarterly Tankan business survey showed confidence among manufacturers (red columns in graph) was flat to slightly better in the second quarter, as the positive effects of resumed vehicle output in March after two months of suspension over safety issue were partially offset by concerns over rising costs. Sentiment among non-manufacturers (black lines) edged down after recent improvement as post-Covid spending and traveling has waned further. The Bank of Japan's quarterly Tankan business survey showed confidence among manufacturers (red columns in graph) was flat to slightly better in the second quarter, as the positive effects of resumed vehicle output in March after two months of suspension over safety issue were partially offset by concerns over rising costs. Sentiment among non-manufacturers (black lines) edged down after recent improvement as post-Covid spending and traveling has waned further.
The Tankan diffusion index showing sentiment among major manufacturers rose to 13 from 11 in the first quarter and was led by producers of textiles, refined petroleum products and general machinery. The index measuring sentiment among major non-manufacturers slipped a point to 33 reflecting declines in retailers, hotels and restaurants that were largely offset by gains for telecommunications.
The sentiment index for smaller manufacturers was at minus 1, unchanged from the first quarter. Non-ferrous metals and refineries over rising costs were weak while business machinery and lumber posted gains.
The index for their non-manufacturing counterparts slipped further to 12. Better sentiment among telecoms and utilities was offset by slightly less optimistic views among hotels, restaurants and retailers amid labor shortages.
Major firms projected their plans for business investment in equipment would rise a combined 11.1 percent on the year in fiscal 2024 ending on March 31, 2025, up sharply from a 4.0 percent increase planned in the first quarter amid widespread labor shortages and the need to digitize their operations.
Smaller firms also raised their combined capital spending plans to a 0.8 percent decrease in fiscal 2024 after projecting a sharper 3.6 percent drop in the prior quarter. Smaller firms tend to have conservative plans at the start of each fiscal year and revise them up later. Capex plans are generally supported by demand for automation amid labor shortages as well as government-led digital transformation and emission control.
BoJ policymakers will analyze this and other pieces of data ahead of their next policy meeting on July 30-31, when the board will update their medium-term growth and inflation forecasts. It will also provide specific plans on how the bank should reduce purchases of Japanese government bonds as part of its process to normalize policy and revive market functions. Some market participants expect the BoJ to raise the overnight rate again in July or September, and possibly one more time by year-end or early next year, but the outlook for a steady increase in service prices, the key to anchoring inflation around the bank's 2 percent target, remains uncertain as regulated wages for medical, welfare workers and educators have been kept low.
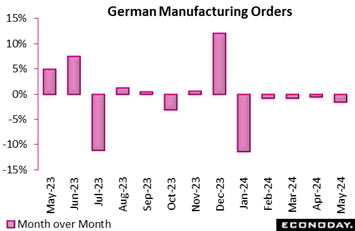 German manufacturing orders took another noticeable dip in May 2024, sliding 1.6 percent from the previous month. This marked the fifth consecutive month of decline, signaling ongoing challenges in the sector. Year-over-year, the decline in manufacturing orders was steeper, falling to minus 8.6 percent in May from minus 1.3 percent in April. April 2024's figures were downwardly revised, showing a 0.6 percent decrease in new orders, steeper than the initially reported 0.2 percent. German manufacturing orders took another noticeable dip in May 2024, sliding 1.6 percent from the previous month. This marked the fifth consecutive month of decline, signaling ongoing challenges in the sector. Year-over-year, the decline in manufacturing orders was steeper, falling to minus 8.6 percent in May from minus 1.3 percent in April. April 2024's figures were downwardly revised, showing a 0.6 percent decrease in new orders, steeper than the initially reported 0.2 percent.
The manufacture of other transport equipment sectors, encompassing aircraft, ships, and trains, experienced a significant nosedive, with new orders plummeting by 19.2 percent. This sharp decline can be traced back to a lower volume of large-scale orders in aircraft construction compared to the previous month. The automotive industry didn't fare much better, with a 2.9 percent drop in new orders, further dragging down the overall performance. On the other hand, the manufacture of computer, electronic, and optical products sector shone brightly, boasting an impressive 11.2 percent increase in new orders, providing a much-needed boost.
The monthly orders data remain very volatile but an ongoing weakening trend remains clear. Manufacturing continues to navigate through a turbulent period, facing persistent headwinds. Near-term prospects for industrial production are not good.
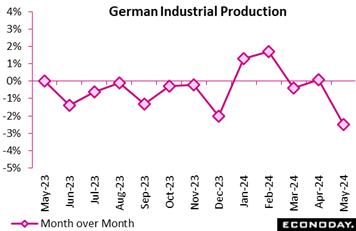 Production follows orders and latest industrial production report paints a somber picture of stagnation. Month-over-month, industrial production dropped by 2.5 percent in May compared to April. This decline signals a concerning reversal from the previous month's marginal 0.1 percent gain which marked a brief, albeit weak, respite from the downward trend. Production follows orders and latest industrial production report paints a somber picture of stagnation. Month-over-month, industrial production dropped by 2.5 percent in May compared to April. This decline signals a concerning reversal from the previous month's marginal 0.1 percent gain which marked a brief, albeit weak, respite from the downward trend.
Year-over-year figures are also striking. May 2024 production was down 6.7 percent compared to May 2023, marking a substantial decline in industrial output. April’s decline was 3.7 percent.
Several factors contributing to this decline include a significant drop in the automotive industry, capital goods, and intermediate goods sectors, which are particularly sensitive to supply chain disruptions.
The overall trend points towards a need for strategic interventions to rejuvenate industrial production. Policies aimed at boosting energy efficiency, enhancing supply chain resilience, and fostering innovation could play pivotal roles in reversing the current downturn.
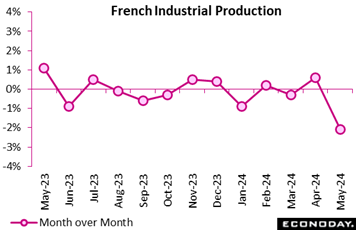 Likie Germany, France's industrial output experienced a significant decline in May, falling 2.1 percent month-over-month following April’s 0.6 percent increase, while manufacturing output dropped by 2.7 percent after a 0.5 percent rise. Year-over-year, industrial production decreased by 3.1 percent. Likie Germany, France's industrial output experienced a significant decline in May, falling 2.1 percent month-over-month following April’s 0.6 percent increase, while manufacturing output dropped by 2.7 percent after a 0.5 percent rise. Year-over-year, industrial production decreased by 3.1 percent.
Sector performance varied. Other manufacturing industries fell by 3.5 percent, machinery and equipment goods plummeted by 4.6 percent, and food products and beverages continued their decline at 0.6 percent. The transport equipment sector decreased by 0.7 percent, with motor vehicles, trailers, and semi-trailers dropping sharply by 6.6 percent, though other transport equipment rebounded by 3.3 percent. Conversely, mining, quarrying, energy, and water supply grew by 1.1 percent, and coke and refined petroleum saw a robust recovery with a 3.9 percent increase.
Overall, France’s manufacturing sector is facing volatility and economic challenges, with significant drops in key areas. However, growth in energy-related sectors offers some stability. A strategic focus on strengthening supply chains and investing in innovation is crucial for recovery and sustainable growth.
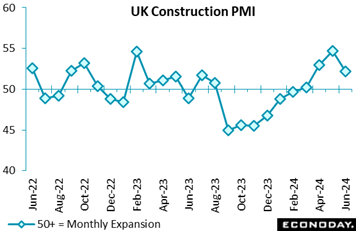 Construction activity expanded in the UK at a moderate pace in June. However, at 52.2, the sector PMI was down more than 2 points versus May and also short of the market consensus. Growth was positive for a fourth straight month but there were some signs that election uncertainty may have had a limited negative impact. Construction activity expanded in the UK at a moderate pace in June. However, at 52.2, the sector PMI was down more than 2 points versus May and also short of the market consensus. Growth was positive for a fourth straight month but there were some signs that election uncertainty may have had a limited negative impact.
The deceleration was largely attributable to the housing market which saw a renewed contraction following its first expansion in 19 months in May. Commercial building was again the best performing subsector ahead of civil engineering.
Aggregate new orders increased for a fifth successive month but by the least since February amidst reports that the July 4 election had deferred some demand. Even so, overall headcount continued to rise, posting its largest increase since August last year. Purchasing activity expanded at much the same rate as in May and business confidence remained optimistic and also little changed on the month.
Input costs rose but the inflation rate was still below the series norm as supply chain conditions remained favourable.
In sum, while on the soft side of expectations, the June data still paint a reasonably positive picture of the UK construction sector. Moreover, with the election safely out the way, July could well see further improvement.
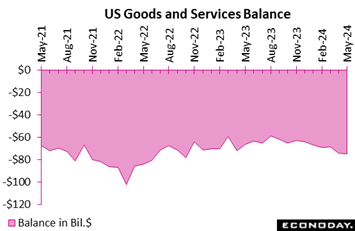 The US trade balance continued to worsen in May, to a deficit of $75.1 billion which is $0.6 billion deeper than April and a sizable $6.9 billion deeper than the first-quarter average. Unless the balance substantially improves in June, net exports look to be a significant negative for second-quarter GDP. The US trade balance continued to worsen in May, to a deficit of $75.1 billion which is $0.6 billion deeper than April and a sizable $6.9 billion deeper than the first-quarter average. Unless the balance substantially improves in June, net exports look to be a significant negative for second-quarter GDP.
May's report included new data for services where the US balance is strongly positive, at a surplus of $25.1 billion. Exports of services, led by travel, rose $1.1 billion in the month to $92.1 billion for year-over-year growth of 7.7 percent.
It's in goods that the US suffers. Here the red ink is heavy at $100.2 billion in the month. Exports of goods fell $2.9 billion for year-over-year growth of 2.5 percent. Details include declines of $2.1 billion for industrial supplies (nonmonetary gold, petroleum products, fuel oil) and a $0.5 billion decline for vehicles (mostly heavy trucks and auto parts).
But it's really imports of goods that torpedoes the US trade balance. These did fall $2.0 billion in May but were 5.6 percent above May last year. Imports of crude oil rose $1.0 billion in the month with nuclear fuel materials up $0.9 billion. Yet consumer goods did decline by $2.0 billion led by a sharp drop of $4.2 billion in pharmaceuticals that was offset in part by a $1.0 billion rise for cell phones and other household goods. Auto-related imports, which had been climbing, fell $1.5 billion.
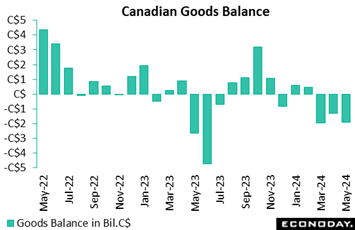 Canada's goods balance moved deeper into deficit with a C$1.927 billion shortfall in May after a $1.323 billion deficit in April. Forecasters in an Econoday survey looked for a deficit of C$1.6 billion. Canada's goods balance moved deeper into deficit with a C$1.927 billion shortfall in May after a $1.323 billion deficit in April. Forecasters in an Econoday survey looked for a deficit of C$1.6 billion.
Exports fell back 2.6 percent on the month to their lowest level since July 2023, with decreases across 8 of 11 sectors, after a revised gain of 2.1 percent in April. In volume terms, exports fell 1.7 percent in May from April.
The exports decline was driven by metal and non-metal mineral products which fell 7.0 percent in May after a big jump in April. The May fall was mostly due to lower exports of copper ores and concentrates. Exports of unwrought gold, silver and platinum group metals and alloys, a category dominated by unwrought gold, fell by 17.1 percent. This largely reflected a lower volume of exports to the UK. Another big downer for exports was energy products, down 2.4 percent in May, mostly due to lower oil prices.
For imports, a decrease of 1.6 percent in May followed an increase of 1.3 percent in April, with declines in 6 of 11 sectors. The biggest movers in imports were a 10 percent drop in imports of metal and non-metallic mineral products and a 4.4 percent decline in imports of motor vehicles and parts. Passenger cars and light trucks were down 7.1 percent. This mostly reflected lower imports from the US due to production and shipment delays which have disrupted deliveries to Canadian dealerships.
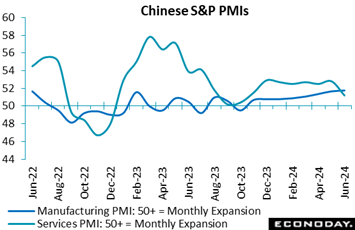 S&P’s services PMI for China fell very sharply in June, to 51.2 from 54.0 to badly miss Econoday’s consensus for 53.4. Respondents reported weaker growth in output, new orders, and new export orders in June, after all had risen in May at the fastest pace in several months. Payrolls were reported to have been cut slightly and the survey's measure of confidence fell to its lowest level since March 2020. Respondents also reported weaker growth in input costs and a smaller increase in selling prices. S&P’s services PMI for China fell very sharply in June, to 51.2 from 54.0 to badly miss Econoday’s consensus for 53.4. Respondents reported weaker growth in output, new orders, and new export orders in June, after all had risen in May at the fastest pace in several months. Payrolls were reported to have been cut slightly and the survey's measure of confidence fell to its lowest level since March 2020. Respondents also reported weaker growth in input costs and a smaller increase in selling prices.
S&P’s PMI for manufacturing, in contrast, edged higher in June, to 51.8 from May’s 51.7. This index has been above breakeven 50 since late last year and has been trending higher since late 2023; it is now at its highest level. however subdued, in just over three years. Respondents reported output grew in June at the fastest pace in two years, though new orders and new export orders were reported to have risen at a less pronounced pace. Payrolls were reported to have stabilized in June after several months of contraction and the survey's measure of business confidence fell to its lowest level in more than two years. The survey also shows stronger price pressures, with its measure of input costs growth at a two-year high and selling costs rising at the fastest paced in eight months.
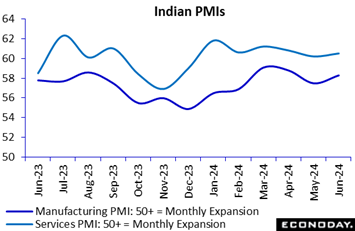 No country’s PMs are higher than India’s. S&P’s manufacturing PMI indicates activity in the sector gained further momentum in June, with the headline index increasing to 58.3 from 57.5 in May. Less timely industrial production data published last month showed solid growth in the manufacturing sector in April, with May data scheduled to be published in the coming week. No country’s PMs are higher than India’s. S&P’s manufacturing PMI indicates activity in the sector gained further momentum in June, with the headline index increasing to 58.3 from 57.5 in May. Less timely industrial production data published last month showed solid growth in the manufacturing sector in April, with May data scheduled to be published in the coming week.
PMI respondents reported stronger growth in output, new orders, and new export orders in June. The survey also shows payrolls were increased at the fastest pace since data collection began in 2005 while the survey's measure of business confidence rose to the highest in nearly ten years. Respondents also reported another month of strong growth in input costs and the biggest increase in selling prices in more than two years.
For services, June’s PMI rose to 60.5 from 60.2 in May. These respondents reported output and new orders grew at a faster pace in June, while new export orders rose at the fastest pace since the series was introduced in 2014. The survey also showed the biggest increase in payrolls in nearly two years while its measure of business confidence fell but continues to indicate respondents expect further growth in output over the next twelve months. Respondents reported some easing in price pressures, with the survey showing a smaller increase in both input costs and selling prices.
With these PMI surveys showing very robust conditions in the Indian economy, the Reserve Bank of India's focus at upcoming policy meetings will likely remain on risks to the inflation outlook.
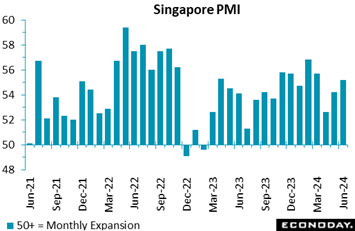 Singapore PMI indicates growth in the aggregate economy gained further momentum in June, with the survey's index increasing to a four-month high of 55.2 from 54.2 in May. Respondents reported stronger domestic demand, greater optimism about the outlook, but tighter margins. Singapore PMI indicates growth in the aggregate economy gained further momentum in June, with the survey's index increasing to a four-month high of 55.2 from 54.2 in May. Respondents reported stronger domestic demand, greater optimism about the outlook, but tighter margins.
June's survey shows output rose at the fastest pace in twenty months in June in response to stronger new orders, with payrolls also increasing for the second consecutive month after a small decline in April. The survey's measure of business confidence rose to an eight-month high and continues to indicate that firms expect solid growth in output over the next twelve months. Respondents also reported faster growth in input costs but a smaller increase in selling prices.
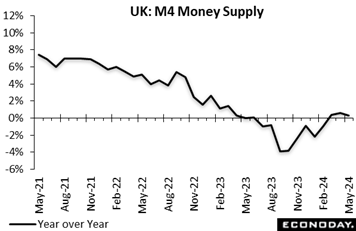 Broad money dipped 0.1 percent on the month in May having been flat in April. This was the first contraction in M4 since January and halved yearly growth as tracked in the graph to 0.3 percent, a 3-month low. Quarterly growth was 2.8 percent, well down on the 5.5 percent posted in the period to April. M4 lending also fell a monthly 0.1 percent but remained 1.0 percent higher on the year. Broad money dipped 0.1 percent on the month in May having been flat in April. This was the first contraction in M4 since January and halved yearly growth as tracked in the graph to 0.3 percent, a 3-month low. Quarterly growth was 2.8 percent, well down on the 5.5 percent posted in the period to April. M4 lending also fell a monthly 0.1 percent but remained 1.0 percent higher on the year.
By contrast, excluding intermediate other financial institutions, M4 rose 0.1 percent versus April, its fourth straight advance. Similarly-adjusted lending was only stable but 3-monthly annualised growth still picked up to 2.0 percent.
Elsewhere the financial data were again mixed. In the housing market, mortgage approvals slipped from 60,821 to a 4-month low of 59,990 while lending cooled from £2.23 billion to £1.21 billion. However, overall consumer credit rose £1.513 billion, nearly double the £0.79 billion posted in April.
Once again, the data are mixed but overall would seem to be consistent with a gradual recovery in economic activity.
Global economic data have been missing expectations since the end of May, a sustained trend that points to central-bank rate cuts and a decline for Econoday’s Global Policy Rate (a weighted average of the major central banks) that currently stands at 4.29 percent. The global Relative Performance Index is at minus 16 and falls slightly further to minus 18 less inflation data (RPI-P), the latter offering a specific reading on real economic activity.
US data in the week mostly underperformed, leaving this country’s RPI and RPI-P both at minus 17 to indicate underperformance but not severe enough underperformance, at least yet, to push the Federal Reserve into a rate cut at its July 31 announcement. Canada, by contrast, is at 21 on the RPI though this slips to 8 when excluding inflation. The Bank of Canada next meets on July 24 and continued outperformance, despite June’s soft labour force survey, would ease talk of a second consecutive rate cut.
In the Eurozone, the RPI (8) and RPI-P (2) both moved back above zero for the first time since the end of May. Even so, the latest readings only really show economic activity in general performing much as expected, which means growth remains sluggish. That said, the latest inflation data were too firm to open the door to another cut in ECB interest rates next week.
In the UK, the bias towards underperformance continued, albeit only modestly. Closing out the week at minus 4 and minus 5 respectively, the RPI and RPI-P show only limited net downside misses that provide little fresh guidance for speculators ahead of the August Bank of England meeting.
In Switzerland, the shortfall in economic activity is more acute and reflected in an RPI of minus 36 and an RPI-P of minus 25. With negative readings in part attributable to downside surprises on inflation, recent data have been supportive of the Swiss National Bank’s decision last month to cut its policy rate for a second time this year.
In Japan, economic news continued mixed but, with the RPI at 1 and the RPI-P at minus 7, on balance much as expected. However, the data still lack the momentum needed to provide the ailing yen with any real support and currency developments will be a major focus at the Bank of Japan meeting at the end of the month.
In China, early signs that economic activity slowed more sharply than expected last month trimmed the RPI to minus 43 and the RPI-P to minus 42. The economy is moving forward but recent data have generally disappointed and the 5 percent growth target set by the government for this year still looks ambitious.
**Contributing to this article were Jeremy Hawkins, Brian Jackson, Mace News, Max Sato, Olajide Oyadeyi, and Theresa Sheehan
Fed Chair Jerome Powell will speak Tuesday on Capitol Hill in his semiannual monetary policy testimony. His assessment on disinflation, whether it is resuming, will be the central focus. His testimony will be followed on Thursday by US consumer prices where monthly rates are expected to remain cool but not the annual ex-food ex-energy core which is seen rising to 3.5 from 3.4 percent.
The Reserve Bank of New Zealand is expected to hold policy steady on Wednesday as is the Bank of Korea on Thursday.
Chinese consumer prices on Wednesday are expected to be quiet and flat while Chinese merchandise trade, estimated for Friday, is expected to show a strong rise for exports and also a rise for imports. Monthly UK GDP on Thursday is expected to remain flat, while India’s consumer prices on Friday are expected to remain steady and high.
German Merchandise Trade for May (Mon 0800 CEST; Mon 0700 GMT; Mon 0200 EDT)
Consensus Forecast, Balance: +€20.3 billion
May’s goods balance is expected to narrow to a €20.3 billion surplus versus a surplus of €22.1 billion in April.
Chinese CPI for June (Wed 0930 CST; Wed 0130 GMT; Tue 2130 EDT)
Consensus Forecast, Year over Year: 0.4%
June’s year-over-year rate is expected to edge to 0.4 percent versus May’s 0.3 percent rate. China’s CPI last peaked in January last year at 2.1 percent.
Reserve Bank of New Zealand Announcement (Wed 1400 NZST; Wed 0200 GMT; Tue 2200 EDT)
Consensus Forecast, Change: 0 basis points
Consensus Forecast, Level: 5.50%
Though inflation has remained high, the Reserve Bank of New Zealand has been keeping policy steady. Consensus for July’s meeting is once again no change for the RBNZ’s policy rate at 5.50 percent.
Japanese Machinery Orders for May (Thu 0850 JST; Wed 2350 GMT; Wed 1950 EDT)
Consensus Forecast, Month over Month: 0.7%
Consensus Forecast, Year over Year: 7.1%
Machinery orders are expected to rebound a modest 0.7 percent in May for year-over-year growth of 7.1 percent. Orders are often volatile, falling 2.9 percent on the month in April after rising 2.9 percent in March. Despite April’s decline, government maintained its assessment that machinery orders were “showing signs of a pickup".
Bank of Korea Announcement (Thu 1000 KST; Thu 0100 GMT; Wed 2100 EDT)
Consensus Forecast, Change: 0 basis points
Consensus Forecast, Level: 3.50%
Reflecting moderation in consumer prices, the Bank of Korea has kept policy unchanged since early 2023. For its July meeting, the bank is expected to hold steady once again.
UK GDP for May (Thu 0700 BST; Thu 0600 GMT; Thu 0200 EDT)
Consensus Forecast, Month over Month: 0.0%
Consensus Forecast, 3-Months over 3-Months: 0.7%
GDP in the month of May is expected to come in unchanged like it did in an April report that was held down by weakness in manufacturing.
UK Industrial Production for May (Thu 0700 BST; Thu 0600 GMT; Thu 0200 EDT)
Consensus Forecast, Year-over-Year: 0.5%
Industrial production is expected to rise an annual 0.5 percent in May after contracting 0.4 percent in April.
US CPI for June (Thu 1230 GMT; Thu 0830 EDT)
Consensus Forecast, Month over Month: 0.1%
Consensus Forecast, Year over Year: 3.1%
US CPI Core, Less Food & Energy
Consensus Forecast, Month over Month: 0.2%
Consensus Forecast, Year over Year: 3.5%
Overall prices are expected to rise 0.1 percent in June after coming in unchanged in May which was way below expectations. Core prices increased 0.2 percent in May which was slightly below expectations with June’s consensus also at 0.2 percent. Annual rates, which in May were 3.3 percent overall and 3.4 percent for the core, are expected at 3.1 and 3.5 percent, respectively.
Chinese Merchandise Trade Balance for June (Estimated for Friday, release time not set)
Consensus Forecast: US$84.7 billion
Consensus Forecast: Imports - Y/Y: 2.9%
Consensus Forecast: Exports - Y/Y: 8.0%
China's trade surplus for June is expected to widen to US$84.7 billion versus a larger-than-expected surplus of US$82.62 billion in a May report that benefited from a 7.6 percent annual surge in exports.
Indian CPI for June (Fri 1730 IST; Fri 1200 GMT; Fri 0800 EDT)
Consensus Forecast, Year over Year: 4.8%
Consumer prices are expected to hold steady in June at an annual 4.80 percent versus 4.75 and 4.83 percent in the two prior months.
Indian Industrial Production for May (Fri 1730 IST; Fri 1200 GMT; Fri 0800 EDT)
Consensus Forecast, Year over Year: 5.0%
Year-over-year industrial production growth is expected to rise 5.0 May versus 5.0 percent growth in April which compared with expectations for 4.6 percent growth.
US Consumer Sentiment Index, Preliminary July (Fri 1000 EDT; Fri 1400 GMT)
Consensus Forecast: 68.2
Year-Ahead Inflation Expectations
Consensus Forecast: 3.0
In the first indication for July, consumer sentiment is expected to hold unchanged at June’s 68.2. Year-ahead inflation expectations are also expected to hold unchanged, at 3.0 percent.
|
