|
With the current crop of economic data showing cooling payroll growth and a resumption of disinflation, it is reasonable to expect the Federal Reserve may well begin cutting rates. The Fed’s next policy meeting is July 30-31, but that is probably too soon to expect the first change in the fed funds rate. The bank is being cautious and patient, and will want several more data points before loosening policy. This puts the stronger possibility of a rate cut at the September 17-18 meeting, and, if the data continue to be favorable, for another at either the November 6-8 meeting, or more likely the December 17-18 meeting.
Whether or not the FOMC cuts rates in the coming months, Fed policymakers are going to work hard to get the message out that monetary policy is data dependent and that they are the ones who make the decision. This is exactly what Jerome Powell spent much of his time doing at his semi-annual testimony in the week. History indicates that the FOMC rarely changes interest rates during national election seasons, and when it does happen, it is usually -- but not always -- the result of a crisis like the period of the Great Recession (December 2007-June 2009) or in response to elevated inflation in the second half of 2022.
 Cooler-than-expected consumer price data have heated up rate-cut talk. The CPI fell 0.1 percent on the month in June for the first decline in four years. The dip was mainly tied to a 2.0 percent fall in energy prices, while food and beverage costs rose 0.2 percent. The CPI excluding food and energy edged 0.1 percent higher which, like the headline, was also lower than expected. The results may be enough to make the Fed think about lowering rates, but not enough to prompt a cut at the July 30-31 meeting. Cooler-than-expected consumer price data have heated up rate-cut talk. The CPI fell 0.1 percent on the month in June for the first decline in four years. The dip was mainly tied to a 2.0 percent fall in energy prices, while food and beverage costs rose 0.2 percent. The CPI excluding food and energy edged 0.1 percent higher which, like the headline, was also lower than expected. The results may be enough to make the Fed think about lowering rates, but not enough to prompt a cut at the July 30-31 meeting.
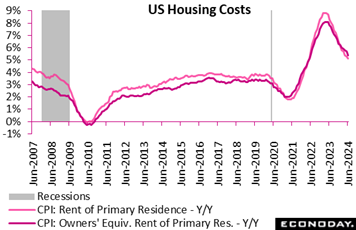
No detail is likely to get more attention than shelter costs which are easing but remain substantially elevated. Month-over-month shelter costs moderated from May’s 0.4 percent to 0.2 percent for the lowest monthly increase in nearly three years. Year-over-year, shelter prices edged down to 5.2 percent from 5.4 percent for a two year low. The bulk of shelter prices are tied both to rent, which slowed from 5.3 to 5.1 percent, and to the equivalent reading for homeowners which slowed from 5.7 to 5.4 percent. Shelter prices – about 1/3 of the CPI basket of goods and services – remain swollen and ultimately reflect high home values.
The CPI excluding shelter fell 0.2 percent month-over-month and was up a benign 1.8 percent year-over-year. The CPI excluding food, energy, and shelter was flat in June and also up only 1.8 percent on the year. Taken together, there's a good hint here that the Fed's two percent inflation objective is reachable. However, it is also important to remember that so far much of the improvement lies in commodities prices while upward pressure on services prices has yet to yield.
The CPI for commodities-only fell 0.4 percent in June and was also down 0.4 percent year-over-year. The CPI for services rose 0.1 percent in June and was up 5.0 percent compared to June 2023. Though upward price pressures are easing for services, significant gains remain. The special aggregate for CPI services less rent of shelter was unchanged on the month both in June and May though its annual rate is 4.8 percent.
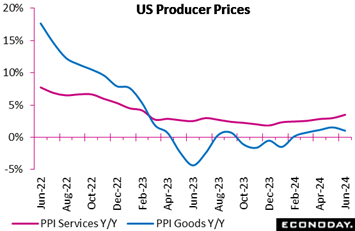 But unlike prices at the consumer level, disinflation can't be said for producer prices which are, though tame, back on the climb. Headline prices rose 0.2 percent in June for a 2.6 percent annual rate that's the highest since March last year. Ex-food ex-energy prices rose 0.4 percent on the month for a 3.0 percent annual rate that's the highest since April last year. All these readings exceeded Econoday's consensus estimates. But unlike prices at the consumer level, disinflation can't be said for producer prices which are, though tame, back on the climb. Headline prices rose 0.2 percent in June for a 2.6 percent annual rate that's the highest since March last year. Ex-food ex-energy prices rose 0.4 percent on the month for a 3.0 percent annual rate that's the highest since April last year. All these readings exceeded Econoday's consensus estimates.
Service prices, to the frustration of Fed, are the area that's slowing price normalization. Services in total rose 0.6 percent on the month to double May's 0.3 percent pace. This yearly rate, which has climbed for the last seven months in a row, is at 3.5 percent versus May's 3.0 percent. "Nearly all of the June increase", according to the text of the report, is tied to trade services which jumped a monthly 1.9 percent. When excluding trade services (wholesale and retail), prices were unchanged on the month which was below Econoday's consensus for a 0.2 percent rise.
Goods prices fell 0.5 percent in the month after falling 0.8 percent in May. The yearly rate for goods, which has been flat, is 1.0 percent versus May's 1.6 percent. Energy (mostly gasoline) pulled goods lower in June, falling 2.6 percent on the month. Foods declined 0.3 percent.
It's reports like these that will keep the Fed on its toes and will push against chances for an early rate cut.
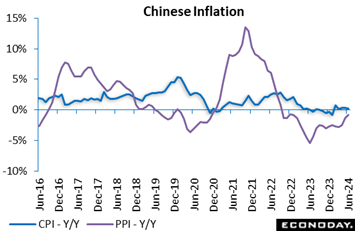 One positive for the global inflation outlook remains lack of any pressures at all in China. The country’s headline consumer price index edged only 0.2 percent higher on the year in June, moderating from the 0.3 increase recorded in May. On the month, the index fell 0.2 percent after falling 0.1 percent previously. June's data were weaker than the consensus forecast for a year-over-year increase of 0.4 percent. One positive for the global inflation outlook remains lack of any pressures at all in China. The country’s headline consumer price index edged only 0.2 percent higher on the year in June, moderating from the 0.3 increase recorded in May. On the month, the index fell 0.2 percent after falling 0.1 percent previously. June's data were weaker than the consensus forecast for a year-over-year increase of 0.4 percent.
China's producer price index fell 0.8 percent on the year in June after dropping 1.4 percent on the year in May. Headline PPI inflation has been in negative territory since late 2022 but this is the smallest year-over-year decline in the index since January 2023. The index fell 0.2 percent on the month after a previous increase of 0.2 percent.
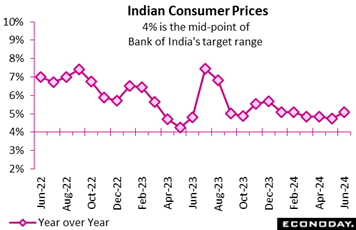 By contrast, consumer inflation in India has been very hot, at 5.08 percent on the year in June and picking up from an increase of 4.75 percent in May. This is the first increase in headline inflation in six months and takes it further above the mid-point of the Reserve Bank of India's target range of two to six percent. By contrast, consumer inflation in India has been very hot, at 5.08 percent on the year in June and picking up from an increase of 4.75 percent in May. This is the first increase in headline inflation in six months and takes it further above the mid-point of the Reserve Bank of India's target range of two to six percent.
Pressures in this country are largely tied to food. Food and beverage prices rose 8.36 percent on the year, up from the 7.87 percent increase recorded previously, while fuel and light charges fell 3.66 percent on the year after a previous decline of 3.83 percent. Inflation in urban areas rose from 4.21 percent in May to 4.39 percent in June, while inflation in rural areas picked up from 5.34 percent to 5.66 percent.
At the RBI's most recent policy meeting, held last month, officials left policy rates on hold at 6.50 percent. They advised then that they expect base effects will send inflation lower in the near-term before it increases again. They note, however, that the path of disinflation toward the midpoint of their target range will depend heavily on the potential impact of weather events on food prices. June's data showing an increase in headline inflation suggest that upside risks to the inflation outlook will remain the RBI's primary concern at upcoming policy meetings.
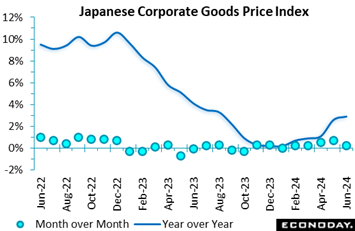 Producer inflation in Japan continued to accelerate in June, to an annual 2.9 percent from May’s 2.6 percent on firmer global energy and commodities markets, higher import costs aggravated by the weak yen, and lower subsidies for electricity and natural gas. On the month, prices rose 0.2 percent following a 0.7 percent rise in May. Producer inflation in Japan continued to accelerate in June, to an annual 2.9 percent from May’s 2.6 percent on firmer global energy and commodities markets, higher import costs aggravated by the weak yen, and lower subsidies for electricity and natural gas. On the month, prices rose 0.2 percent following a 0.7 percent rise in May.
June’s increase was led by utilities where, after a 7.2 percent annual drop in May, prices rose 0.1 percent. Prices of non-ferrous metals rose 19.4 percent amid global supply concerns, while metal products and general machinery showed slightly faster gains. Prices for food and beverages have stabilized at the annual rate of just under 3 percent while those for transport equipment continued showing a smaller gain and lumber prices were still down.
In yen terms, import prices rose 9.5 percent in June, which was the highest since a 15.0 percent rise in February 2023 and followed a 7.1 percent rise in May. The yen depreciated to an average ¥157.82 against the dollar in May during Tokyo trading hours from ¥156.13 in May. Last year, the yen's relative strength in a range of ¥130 to ¥134 in the first four months of 2023 helped lower import costs. This month, the dollar hit a fresh 38-year high above ¥161.70 in the absence of intervention by Japanese authorities.
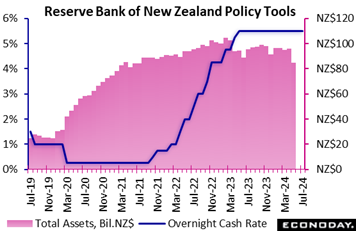 The Reserve Bank of New Zealand left its official cash rate unchanged at 5.50 percent for the eighth consecutive meeting, in line with the consensus forecast. Prior to this pause, officials had increased policy rates by a cumulative 525 basis points as part of efforts to return inflation to their target range of one to three percent. The Reserve Bank of New Zealand left its official cash rate unchanged at 5.50 percent for the eighth consecutive meeting, in line with the consensus forecast. Prior to this pause, officials had increased policy rates by a cumulative 525 basis points as part of efforts to return inflation to their target range of one to three percent.
Headline CPI inflation fell to 4.0 percent in the three months to March from 4.7 percent in the three months to December, with core inflation falling from 4.4 percent to 4.1 percent. In their accompanying statement, RBNZ officials advised that they still expect inflation to fall within their target range by the end of this year, noting that capacity pressures and conditions in the labour market have eased.
Despite their optimism that price pressures will moderate, officials concluded that monetary policy needs to remain restrictive for now. However, they also indicated that rate cuts may be considered at upcoming meetings, noting that "the extent of this restraint will be tempered over time with the expected decline in inflation pressures".
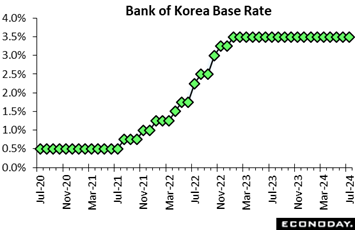 Bank of Korea officials left the main policy rate unchanged at 3.50 percent but also advised that they may consider a rate cut in coming months. Officials have left this rate on hold since the start of 2023 after tightening policy aggressively over 2022 as part of efforts to return headline inflation to their target level of two percent. Bank of Korea officials left the main policy rate unchanged at 3.50 percent but also advised that they may consider a rate cut in coming months. Officials have left this rate on hold since the start of 2023 after tightening policy aggressively over 2022 as part of efforts to return headline inflation to their target level of two percent.
Since the previous BoK meeting in late May, data have shown a fall in headline inflation from 2.9 percent in April to 2.7 percent in May and 2.4 percent in June, with core inflation moderating further to 2.2 percent. In their statement, officials retained their forecast for core inflation to average 2.2 percent this year but noted uncertainties about the inflation outlook and highlighted that "it is necessary to further assess whether inflation will continue its slowing trend". Officials also expressed confidence about the growth outlook and retained their forecast for GDP to expand by 2.5 percent this year.
Officials reaffirmed that their priority is "to conduct monetary policy in order to stabilize consumer price inflation at the target level over the medium-term horizon". Although they concluded that monetary policy should remain restrictive "for a sufficient period of time", they also noted for the first time this cycle that they are open to considering a loosening in policy settings, advising that they "will examine the timing of a rate cut". Incoming inflation data will likely be the key factor that determines whether such a cut will take place in upcoming meetings.
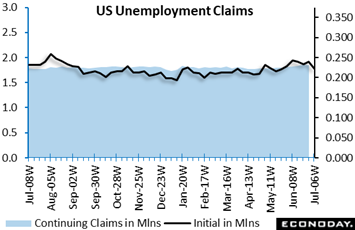 In line with cooling US payroll growth, jobless claims had been climbing noticeably higher, that is until a surprising 17,000 drop in the July 6 week to 222,000. This is the lowest level since late May. One week, however, is only one week as the 4-week average remains noticeably high at 233,500, though down more than 5,000 from the prior week. In line with cooling US payroll growth, jobless claims had been climbing noticeably higher, that is until a surprising 17,000 drop in the July 6 week to 222,000. This is the lowest level since late May. One week, however, is only one week as the 4-week average remains noticeably high at 233,500, though down more than 5,000 from the prior week.
Continuing claims in lagging data for the June 29 week fell 4,000 to 1,852 million with this 4-week average continuing to climb, up nearly 10,000 to 1.840 million for the highest level since early December 2021. Yet the unemployment rate for insured workers remains where it has been since March last year, at a very low 1.2 percent and consistent with strong demand for labor.
The combination of a cooling jobs market with a resumption of disinflation has pulled forward expectations for a Federal Reserve rate cut. Yet the latest drop in initial claims doesn't quite fit in with the first half of this proposition.
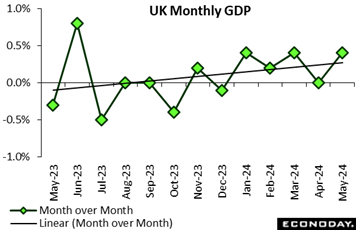 The UK economy was surprisingly robust in May. A 0.4 percent monthly rise in GDP was double the market consensus and matched its best performance since June last year. The advance boosted 3-monthly growth from 0.8 percent to a very respectable 0.9 percent while the annual rate doubled to 1.4 percent, equalling its highest print since October 2022. The UK economy was surprisingly robust in May. A 0.4 percent monthly rise in GDP was double the market consensus and matched its best performance since June last year. The advance boosted 3-monthly growth from 0.8 percent to a very respectable 0.9 percent while the annual rate doubled to 1.4 percent, equalling its highest print since October 2022.
The headline monthly gain was broad-based, reflecting a 0.3 percent increase in services output together with a 0.2 percent rise in industrial production (manufacturing 0.4 percent) and a 1.9 percent jump in construction. Services have now expanded for five consecutive months with the May increase attributable to advances in eight of the 14 subsectors, notably accommodation and food (2.4 percent) and arts, recreation and entertainment (1.2 percent).
The May report leaves total output well set for a good second quarter. As the data currently stand, average GDP in April/May stands 0.6 percent above its first quarter mean and, ignoring revisions, June would need at least a 1.8 percent monthly slump to prevent positive second-quarter growth. May's update will help to ease pressure on the BoE MPC to ease in August.
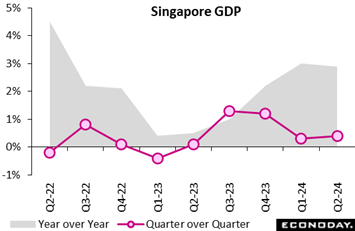 Advance estimates for Singapore's gross domestic product in the three months to June show the economy expanded by 0.4 percent on the quarter after advancing 0.3 percent in the three months to March. GDP rose 2.9 percent on the year in the three months to June, little changed from the 3.0 percent increase recorded in the three months to March. Monthly PMI survey data indicated solid growth in the Singapore economy over this period. Advance estimates for Singapore's gross domestic product in the three months to June show the economy expanded by 0.4 percent on the quarter after advancing 0.3 percent in the three months to March. GDP rose 2.9 percent on the year in the three months to June, little changed from the 3.0 percent increase recorded in the three months to March. Monthly PMI survey data indicated solid growth in the Singapore economy over this period.
Steady headline quarter-over-quarter GDP growth in the latest quarter reflects offsetting moves across major sectors. Manufacturing output rebounded with an increase of 0.6 percent after falling 5.3 percent previously, while activity in the construction sector rose 2.4 percent after a previous decline of 1.9 percent. Service sector output, in contrast, weakened, with output flat on the quarter after advancing 2.2 percent previously.
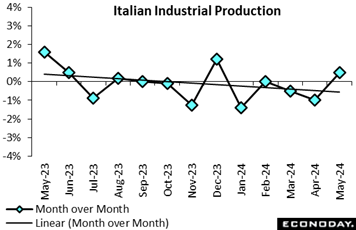 Industrial production in Italy experienced a notable increase in May, rising 0.5 percent compared to April, thereby breaking a two-month downward trend. Energy sectors powered ahead with a 3.0 percent monthly increase, buoyed by consumer and intermediate goods both rising by 0.7 percent. However, capital goods lagged, shrinking by 1.0 percent. Industrial production in Italy experienced a notable increase in May, rising 0.5 percent compared to April, thereby breaking a two-month downward trend. Energy sectors powered ahead with a 3.0 percent monthly increase, buoyed by consumer and intermediate goods both rising by 0.7 percent. However, capital goods lagged, shrinking by 1.0 percent.
Year-over-year, the production figures reveal deeper challenges with an overall 3.3 percent decline. Energy remained a bright spot, growing by 2.5 percent, but there were significant drops in intermediate goods by 1.8 percent, consumer goods by 2.7 percent, and capital goods by 6.4 percent. Sectors like electrical equipment had 4.8 percent growth, coke and refined petroleum products grew by 3.0 percent, and utilities rose by 2.6 percent. In stark contrast, the transport equipment sector plummeted by 11.1 percent, while textiles, clothing, and leather industries fell by 7.0 percent, and machinery and equipment manufacturing declined by 5.7 percent.
The mixed performance across various sectors, with notable growth in electrical equipment and utilities but sharp declines in transport equipment and textiles, suggests that the industrial recovery is uneven and fragile, necessitating targeted policy interventions to sustain and broaden the nascent recovery.
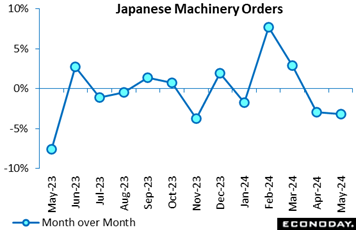 Japanese core machinery orders unexpectedly posted a second straight drop in May, down 3.2 percent on the month, on a pullback for computers from the communications and financial industries. Orders came in much weaker than the median forecast of a 0.7 percent increase and followed a 2.9 percent drop in April. The three-month moving average fell 1.1 percent in the March-May period after rising 2.4 percent in February-April. Japanese core machinery orders unexpectedly posted a second straight drop in May, down 3.2 percent on the month, on a pullback for computers from the communications and financial industries. Orders came in much weaker than the median forecast of a 0.7 percent increase and followed a 2.9 percent drop in April. The three-month moving average fell 1.1 percent in the March-May period after rising 2.4 percent in February-April.
As a result, the Cabinet Office downgraded its assessment for the first time in four months and only two months after upgrading it, saying, "The pickup in machinery orders is pausing." Last month, it said, "Machinery orders are showing signs of a pickup."
Nevertheless, companies in general have solid plans for investing in automation amid labor shortages and in digitization and emission control. The Bank of Japan's quarterly Tankan survey for June released in the prior week showed firms revising up their capital investment plans for fiscal 2024 that began in April.
Orders from manufacturers rose 1.0 percent on the month in May after slumping 11.3 percent in April and soaring 19.4 percent in March, led by computers and X-ray equipment from electric machine makers as well as cranes and conveyors from producers of information communications equipment. Orders from non-manufacturers fell 7.5 percent after rebounding 5.9 percent in April and dipping 11.3 percent in March due to declines for communications equipment and computers from telecommunications firms and for boilers and turbines from the real-estate industry.
On the year, core orders were up 10.8 percent in May after increases of 0.7 percent in April and 2.7 percent in March, which was the first rise in 13 months. It was higher than the consensus forecast of a 7.1 percent increase.
In May, the Cabinet Office forecast that core orders were likely to slip back 1.6 percent in the April-June quarter for the first drop in two quarters, which are expected to be pulled down by both the manufacturing and non-manufacturing sectors in payback for recent gains. In order for core orders to meet the official projection, they must not fall more than 2.4 percent on the month in June.
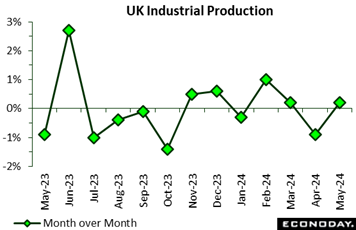 Industrial production rose 0.2 percent on the month in May, marginally less than the market consensus and only partially reversing April's 0.9 percent fall. Still, this was its third advance in the last three months and, with base effects positive, enough to lift annual growth from minus 0.7 percent to 0.4 percent, a 3-month high. Industrial production rose 0.2 percent on the month in May, marginally less than the market consensus and only partially reversing April's 0.9 percent fall. Still, this was its third advance in the last three months and, with base effects positive, enough to lift annual growth from minus 0.7 percent to 0.4 percent, a 3-month high.
Manufacturing performed rather better with a 0.4 percent monthly increase although this too only dented April's 1.6 percent decline. Output was up in seven of the 13 subsectors with food, drink and tobacco (1.7 percent) posting the sharpest gain. The main area of weakness was transport which saw a 0.7 percent drop as motor vehicles, trailers and semi-trailers declined 1.8 percent.
Elsewhere, overall production was boosted by stronger mining and quarrying (0.1 percent) and water supply (0.4 percent) but hit by weaker electricity and gas (minus 1.9 percent)
The May report leaves average industrial production in the first two months of the quarter 0.4 percent below its first quarter mean. Absent revisions, June will need at least a 1.1 percent monthly increase just to keep the period flat. As such, the sector looks likely to have a small negative impact on second-quarter GDP growth.
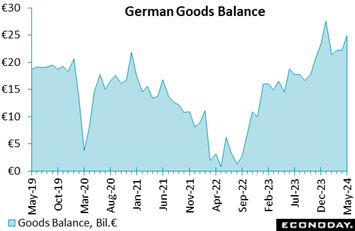 Germany’s seasonally adjusted merchandise trade balance recorded a robust surplus of €24.9 billion in May, up from €22.2 billion in April 2024 and €16.8 billion in May 2023. Exports fell by 3.6 percent in May compared to April, while imports dropped a steep 6.6 percent. Germany’s seasonally adjusted merchandise trade balance recorded a robust surplus of €24.9 billion in May, up from €22.2 billion in April 2024 and €16.8 billion in May 2023. Exports fell by 3.6 percent in May compared to April, while imports dropped a steep 6.6 percent.
Unadjusted, the surplus stood at €22 billion, up from the €15.2 billion posted in May 2023. Nominal exports totalled €129.0 billion, down 3.8 percent from May 2023, while imports fell 10.0 percent to €107.0 billion.
This surplus growth, despite declining trade volumes, underscores Germany's resilient trade dynamics amid global economic fluctuations.
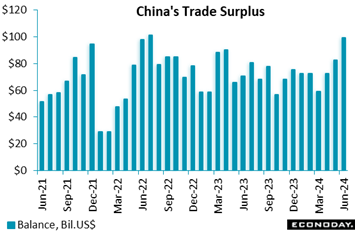 China's trade surplus in US dollar terms widened to $99.05 billion in June from $82.62 billion in May. This was much higher than Econoday’s consensus for $84.7 billion. Exports rose 8.6 percent on the year in June after increasing 7.6 percent in May and compared to expectations for 8.0 percent. And imports did their share to boost the balance, falling 2.3 percent on the year after a previous increase of 1.8 percent. Imports were expected to rise 2.9 percent on the month. China's trade surplus in US dollar terms widened to $99.05 billion in June from $82.62 billion in May. This was much higher than Econoday’s consensus for $84.7 billion. Exports rose 8.6 percent on the year in June after increasing 7.6 percent in May and compared to expectations for 8.0 percent. And imports did their share to boost the balance, falling 2.3 percent on the year after a previous increase of 1.8 percent. Imports were expected to rise 2.9 percent on the month.
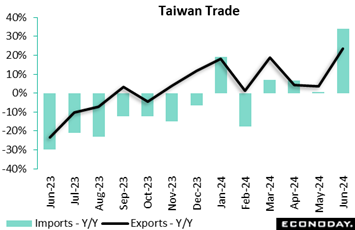 Taiwan's trade surplus narrowed from $6.05 billion in May to $4.68 billion in June. Exports surged 23.5 percent after increasing 3.5 percent previously, while imports rose even faster, up 33.9 percent after a previous increase of 0.6 percent. Taiwan's trade surplus narrowed from $6.05 billion in May to $4.68 billion in June. Exports surged 23.5 percent after increasing 3.5 percent previously, while imports rose even faster, up 33.9 percent after a previous increase of 0.6 percent.
Strong headline growth in exports was largely driven by exports of information, communication and audio-video products, up 114.1 percent on the year, with exports of electronic components advancing 7.3 percent. Exports to the United States increased 74.2 percent on the year, while exports to mainland China and Hong Kong rose 7.3 percent. Petroleum imports also surged higher, increasing 82.4 percent on the year after a previous decline, while imports from mainland China and Hong Kong recorded solid growth.
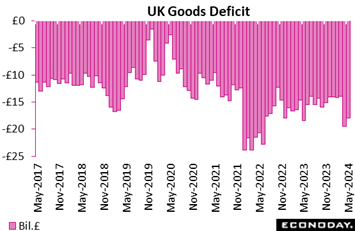 The UK trade deficit narrowed but by less than expected in May. At £17.92 billion, the shortfall was down from April's £19.44 billion but still nearly £2 billion above the market consensus. Moreover, the headline improvement simply reflected a sharper monthly fall in imports (4.6 percent) than exports (2.5 percent). Indeed, due to sizeable declines in sales of machinery and transport equipment to the EU and in non-EU purchases of fuel, exports now stand at their weakest level since January 2022. The UK trade deficit narrowed but by less than expected in May. At £17.92 billion, the shortfall was down from April's £19.44 billion but still nearly £2 billion above the market consensus. Moreover, the headline improvement simply reflected a sharper monthly fall in imports (4.6 percent) than exports (2.5 percent). Indeed, due to sizeable declines in sales of machinery and transport equipment to the EU and in non-EU purchases of fuel, exports now stand at their weakest level since January 2022.
The red ink with the EU fell from £12.48 billion to £11.06 billion as exports dropped 3.3 percent and imports a much steeper 7.0 percent. At the same time, the shortfall with the rest of the world was little changed at £6.86 billion with exports down 1.8 percent and imports 1.7 percent.
The May report leaves a deteriorating trend in the goods balance which, combined with the marked weakness of exports, cannot be good news for the pound's medium-term outlook.
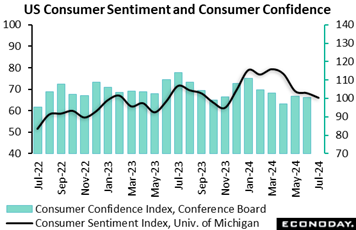 In the lowest score since last November, consumer sentiment in the US fell more than 2 points to 66.0. Assessments of both current and future conditions eased, down nearly 2 points for the former to 64.1 and down more than 2-1/2 points for the latter to 67.2. In the lowest score since last November, consumer sentiment in the US fell more than 2 points to 66.0. Assessments of both current and future conditions eased, down nearly 2 points for the former to 64.1 and down more than 2-1/2 points for the latter to 67.2.
The report cites high prices as a negative though inflation expectations are cooling, down a tenth for both the 1-year and 5-year outlooks to 2.9 percent for each. This, along with the weakening in the headline index, are favorable points for a Federal Reserve rate cut. The report also cites uncertainty tied to the presidential election as a negative, though it notes there was no significant reaction to the June 27 presidential debate.
July’s preliminary results will have forecasters marking down their estimates for the month-end consumer confidence index which in June fell nearly a point to 100.4.
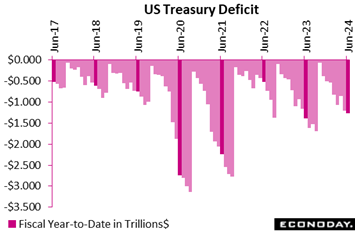 Talking about rate cuts ahead of an election is routine enough, as is heavy government spending. But the Treasury’s deficit is actually lower than it was this time last year. June’s deficit of $66.0 billion lifted the fiscal year-to-date deficit to $1.268 trillion which is $125 billion lower than it was in June 2023, at $1.393 trillion. This improvement narrows to $29.0 billion when adjusted for calendar variations, at $1.340 trillion versus $1.369 trillion a year ago, down 2 percent. The latest monthly outlays totaled $532.2 billion compared with receipts at $466.3 billion. Talking about rate cuts ahead of an election is routine enough, as is heavy government spending. But the Treasury’s deficit is actually lower than it was this time last year. June’s deficit of $66.0 billion lifted the fiscal year-to-date deficit to $1.268 trillion which is $125 billion lower than it was in June 2023, at $1.393 trillion. This improvement narrows to $29.0 billion when adjusted for calendar variations, at $1.340 trillion versus $1.369 trillion a year ago, down 2 percent. The latest monthly outlays totaled $532.2 billion compared with receipts at $466.3 billion.
Global economic data in the week came in a bit nearer to forecasts, improving to minus 8 on the Relative Performance Index (RPI) and minus 11 less prices (RPI-P). These scores are only slightly negative and aren’t signaling any immediate bias for Econoday’s Global Policy Rate (a weighted average of major central banks) which stands at 4.29 percent.
In the Eurozone, an essentially empty data calendar saw the RPI hold steady at 8 and the RPI-P at 2, both close enough to zero to indicate economic activity is performing much as expected and financial markets are confident of no change in policy from the ECB on Thursday.
Similarly, there was no significant data released from Canada. This left the RPI at 21 and the RPI-P at 8. While both readings are currently in positive surprise territory, there has been a clear bias toward sub-zero readings since mid-April. Consequently, there is still considerable speculation about another easing at the Bank of Canada’s next policy meeting on July 24. Tuesday’s June CPI update could be the deciding factor.
In the UK, unexpectedly strong GDP for the month of May kept the RPI (6) and RPI-P (11) modestly in positive surprise territory but all eyes this week will be on Wednesday’s inflation update and Thursday’s labour market report. Developments here will be key to the outcome of Bank of England’s next policy meeting in August.
In Japan, weakness in machinery orders helped to trim the RPI to minus 10 and RPI-P to minus 22. The Bank of Japan is still widely seen tapering its QE programme at the end of the month but with overall economic activity underperforming, the timing of the next increase in central bank interest rates remains uncertain. To this end, Friday’s CPI report will have an important impact on market sentiment.
In China, further signs that domestic prices are not keeping up with expectations left both the RPI (minus 29) and RPI-P (minus 30) well below zero. Recent policy measures may mean that another cut in key interest rates will not be necessary but with any monetary tightening a long way down the road, the yuan is likely to remain under pressure.
Helped by an unexpected fall in jobless claims, both the RPI and RPI-P for the US improved to minus 4 each, indicating that forecasters are correctly gauging the degree of the country’s slowdown and price cooling.
**Contributing to this article were Jeremy Hawkins, Brian Jackson, Mace News, Max Sato, Olajide Oyadeyi, and Theresa Sheehan
A heavy run of Chinese data including quarterly GDP kicks off the week on Monday. Incremental slowing is the call across all indicators including GDP which is seen at 5.1 percent in the second quarter versus 5.3 percent in the first quarter.
The European Central Bank will be another of the week’s features in what is widely expected to be a no-move decision on Thursday. It’s uncertain what the Bank of Canada will do at its meeting in the following week though Tuesday’s consumer price report will go a long way to settle expectations -- June’s headline CPI is expected to slow to 2.8 percent from May’s 2.9 percent.
A Wednesday CPI report in the UK will inform expectations for the Bank of England’s August meeting with no change at an on-target 2.0 percent the consensus. June retail sales in the US, at a consensus decline of 0.2 percent, are expected to wind up a dismal quarter for consumer spending.
Chinese Fixed Asset Investment for June (Mon 1000 CST; Mon 0200 GMT; Sun 2200 EDT)
Consensus Forecast, Year-to-Date on Y/Y Basis: 3.9%
Fixed asset investment for the year-to-date to June is expected to rise 3.9 percent. This would compare with 4.0 percent growth in May.
Chinese Second-Quarter GDP (Mon 1000 CST; Mon 0200 GMT; Sun 2200 EDT)
Consensus Forecast, Quarter over Quarter: 1.0%
Consensus Forecast, Year over Year: 5.1%
Second-quarter GDP is expected to rise 1.0 percent versus the first quarter which would compare with 1.6 percent sequential growth from the fourth quarter. The year-over-year expectation in the second quarter is growth of 5.1 percent which would compare with 5.3 percent growth in the first quarter.
Chinese Industrial Production for June (Mon 1000 CST; Mon 0200 GMT; Sun 2200 EDT)
Consensus Forecast, Year over Year: 5.0%
Year-over-year growth in industrial production rose a lower-than-expected 5.6 percent in May with expectations for June at 5.0 percent.
Chinese Retail Sales for June (Mon 1000 CST; Mon 0200 GMT; Sun 2200 EDT)
Consensus Forecast, Year over Year: 3.4%
After rising 3.7 percent year-over-year in May, sales in June are expected to slow to 3.4 percent.
German Retail Sales for May (Mon 0800 CEST; Mon 0600 GMT; Mon 0200 EDT)
Consensus Forecast, Month over Month: 0.0%
Sales volumes are expected to come in unchanged on the month in May versus April’s unexpectedly steep 1.2 percent downturn.
Eurozone Industrial Production for May (Mon 1100 CEST; Mon 0900 GMT; Mon 0500 EDT)
Consensus Forecast, Month over Month: -1.0%
Consensus Forecast, Year over Year: -2.8%
Production in May is expected to fall a monthly 1.0 percent after slipping 0.1 percent in April. A meaningful recovery for Eurozone industrial production has been elusive.
Canadian Manufacturing Sales for May (Mon 08:30 EDT; Mon 1230 GMT)
Consensus Forecast, Month over Month: 0.2%
Manufacturing sales in May are expected to rise 0.2 percent on the month. This would compare with a 1.1 percent gain in April and 1.8 percent fall in March.
Germany: ZEW Survey for July (Tue 1100 CEST; Tue 0900 GMT; Tue 0500 EDT)
Consensus Forecast, Current Conditions: -73.5
Consensus Forecast, Economic Sentiment: 42.7
Current conditions are expected to hold steady at minus 73.5 in July versus June’s minus 73.8 which was sharply lower than expected. By contrast, the report’s expectations component (economic sentiment) is seen falling to 42.7 from June’s 47.5 which also fell short of the consensus.
Canadian Housing Starts for June (Tue 0815 EDT; Tue 1215 GMT)
Consensus Forecast, Annual Rate: 255,000
Housing starts are expected to slow to 255,000 in June versus May’s higher-than-expected 264,506 rate.
US Retail Sales for June (Tue 0830 EDT; Tue 1230 GMT)
Consensus Forecast, Month over Month: -0.2%
Consensus Forecast, Ex-Vehicles - M/M: 0.1%
Consensus Forecast, Ex-Vehicles, Ex-Gas - M/M: 0.1%
June sales are expected to fall 0.2 percent versus up 0.1 and down 0.2 percent in the two prior months. Such a result would wind up a dismal second quarter. May’s ex-auto sales decreased 0.1 percent with June expected to rise 0.1 percent. June ex-auto ex-gas are also expected at plus 0.1 percent.
Canadian CPI for June (Tue 0830 EDT; Tue 1230 GMT)
Consensus Forecast, Month over Month: 0.1%
Consensus Forecast, Year over Year: 2.8%
After May’s more heated-than-expected 2.9 percent rate that was up from April’s 2.7 percent, consumer prices in June are expected to split the difference at 2.8 percent.
New Zealand Second-Quarter CPI (Wed 1045 NZDT; Tue 2145 GMT; Tue 1845 EDT)
Consensus Forecast, Quarter over Quarter: 0.5%
Consensus Forecast, Year over Year: 3.5%
Consumer prices are expected to rise a quarterly 0.5 percent in the second quarter for a year-over-year rate of 3.5 percent. These would compare with respective first-quarter rates of 0.6 and 4.0 percent, the latter down from 4.7 percent in the fourth quarter.
UK CPI for June (Wed 0700 BST; Wed 0600 GMT; Wed 0200 EDT)
Consensus Forecast, Month over Month: 0.1%
Consensus Forecast, Year over Year: 2.0%
At 2.0 percent versus expectations for 2.1 percent and against 2.3 percent in April, consumer prices in May returned to the Bank of England’s target for the first time in three years. June’s consensus is steady at 2.0 percent.
US Industrial Production for June (Wed 1315 GMT; Wed 0915 EDT)
Consensus Forecast, Month over Month: 0.3%
Consensus Forecast, Manufacturing Output - M/M: 0.0%
Consensus Forecast, Capacity Utilization Rate: 78.5%
After May’s unexpected and widespread 0.9 percent jump, industrial production in July is expected to rise a further 0.3 percent. Manufacturing output, which also jumped 0.9 percent in May, is expected to be unchanged. Capacity utilization is expected to ease back to 78.5 percent following May’s 0.5 percentage point jump to a higher-than-expected 78.7 percent.
Japanese Merchandise Trade for June (Thu 0850 JST; Wed 2350 GMT; Wed 1950 EDT)
Consensus Forecast: -Y142.3 billion
Consensus Forecast, Imports Y/Y: 6.4%
Consensus Forecast, Exports Y/Y: 6.1%
With the weak yen pushing up import costs, a deficit of ¥142.3 billion is the consensus for June’s trade balance versus a deficit of ¥1,220.1 billion in May. Both imports and also exports posted sharp year-over-year gains in May, up 9.5 and 13.5 percent respectively.
Australian Labour Force Survey for June (Thu 1130 AEST; Thu 0130 GMT; Wed 2130 EDT)
Consensus Forecast, Employment: 19,000
Consensus Forecast, Unemployment Rate: 4.1
Employment growth in June is expected to slow to 19,000 versus gains of 39,700 and 37,400 in the prior two months which were both higher than expected. Unemployment is expected to rise to 4.1 percent from May’s 4.0 percent rate.
UK Labour Market Report (Thu 0700 BST; Thu 0600 GMT; Thu 0200 EDT)
Consensus Forecast, ILO Unemployment Rate for three months to June: 4.4%
The ILO unemployment rate for the three months to June is expected to hold steady at 4.4 percent.
European Central Bank Announcement (Thu 1215 GMT; Thu 1415 CEST; Thu 0815 EST)
Consensus Forecast, Change: 0 basis points
Consensus Forecast, Refi Rate: 4.25%
Speculation about a possible back-to-back cut in key ECB interest rates has faded since the June ease and no change in policy is now widely expected.
Japanese CPI for June (Fri 0830 JST; Thu 2330 GMT; Thu 1930 EDT)
Consensus Forecast, Year over Year: 2.9%
Consensus Forecast, Ex-Fresh Food; Y/Y: 2.7%
Consensus Forecast, Ex-Fresh Food Ex-Energy; Y/Y: 2.2%
Consumer inflation in June is expected to move further higher to a year-over-year 2.9 percent versus 2.8 percent in May which compared with 2.5 percent in April. Excluding fresh food, the rate is seen at 2.7 percent versus 2.5 percent in May. When also excluding energy, the rate is seen at 2.2 percent versus May’s 2.1 percent which, in contrast to the other two readings which both accelerated, was down from April’s 2.4 percent
UK Retail Sales for June (Fri 0700 BST; Fri 0600 GMT; Fri 0200 EDT)
Consensus Forecast, Month over Month: -0.4%
Consensus Forecast, Year over Year: 0.3%
Sales rebounded a sharp 2.9 percent on the month in May after slumping 1.8 percent in April and recording close to growth in the prior two months. Forecasters see June falling back with a 0.4 percent decline.
German PPI for June (Fri 0800 CEST; Fri 0600 GMT; Fri 0200 EDT)
Consensus Forecast, Month over Month: 0.2%
After no change on the month in May, June’s PPI is seen edging 0.2 percent higher.
Canadian Retail Sales for May (Fri 0830 EDT; Fri 1230 GMT)
Consensus Forecast, Month over Month: -0.6%
Retail sales in May are expected to fall 0.6 percent on the month to nearly reverse April’s as-expected 0.7 percent gain.
|
