|
The attempted assassination of Donald Trump followed by the former president’s sweeping nomination at the Republican convention, contrasted against loud calls from leading Democrats for Joe Biden to quit, make evident for the global investor the deepening intensity of the 2024 election. How the week’s events will affect US business investment and US consumer spending will begin to unfold in anecdotal reports: the former with the flash PMIs on Wednesday, July 24 followed by the ISM manufacturing and services reports in the first week of August; the latter with consumer sentiment on Friday, July 26 followed on Tuesday, July 30 by consumer confidence. Hard evidence on the consumer side will begin with motor vehicle sales on Friday, August 2 with the clearest evidence on the business side having to wait for durable goods orders in the last week of August. Economic data do unfold with a lag but that shouldn’t diminish the importance of the latest week’s numbers which will help offer a benchmark to gauge the coming election effects.
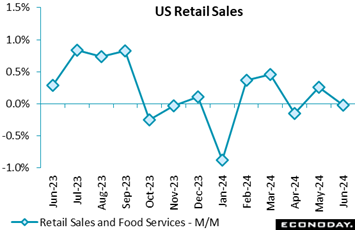 The dollar value of US retail and food services sales came in unchanged in June after a 2-tenths upward revision in May to plus 0.3 percent. Though flat, June's reading did beat Econoday's consensus for a decline of 0.3 percent. The dollar value of US retail and food services sales came in unchanged in June after a 2-tenths upward revision in May to plus 0.3 percent. Though flat, June's reading did beat Econoday's consensus for a decline of 0.3 percent.
Sales of motor vehicles fell 2.3 percent in June much as expected. Similarly, sales at gasoline stations fell 3.0 percent in June reflecting lower pump prices. However, sales in other categories proved stronger than anticipated.
Sales excluding vehicles rose 0.4 percent in June and, like the headline, were revised 2 tenths higher in May to up 0.1 percent. Retail and food sales excluding vehicles and gasoline rose a strong 0.8 percent and were revised higher in May to up 0.3 percent.
The modest upward revision in May and no revision to April suggest that second-quarter consumer spending will be a bit stronger than previously thought. This could mean some revisions higher for second-quarter GDP when the advance report is released on Thursday, July 25.
Outside of vehicle and gasoline sales, three categories stand out. Sales at nonstore retailers rose 1.9 percent in June, accounting for 17.4 percent of all sales. Sales were 1.4 percent higher for building materials and garden centers, accounting for 5.8 percent of all sales. Sales in health and personal care gained 0.9 percent, accounting for 5.2 percent of sales. And, although only a small share of total sales, furniture and home furnishings rose 0.6 percent in June and clothing was also up 0.6 percent. These contributed shares of 1.6 percent and 3.7 percent, respectively.
It is likely that retailers were getting ahead of some summer sales with heavy discounting, but also that consumers were willing to purchase summer merchandise in anticipation that shelves will soon clear as retailers bring in fall merchandise.
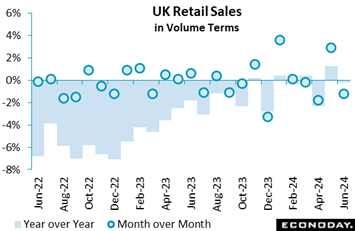 Following a 2.9 percent monthly jump in May, retail sales in the UK gave back more ground than expected at quarter-end. Volumes declined 1.2 percent on the month, three times the market consensus and their third fall in the last four months. Annual growth was cut from 1.7 percent to minus 0.2 percent but purchases only stand at a 2-month low. Excluding auto fuel, the picture was rather weaker with sales down 1.5 percent versus May. Following a 2.9 percent monthly jump in May, retail sales in the UK gave back more ground than expected at quarter-end. Volumes declined 1.2 percent on the month, three times the market consensus and their third fall in the last four months. Annual growth was cut from 1.7 percent to minus 0.2 percent but purchases only stand at a 2-month low. Excluding auto fuel, the picture was rather weaker with sales down 1.5 percent versus May.
June's monthly setback was broad-based as food fell 1.1 percent, fully reversing May's bounce, and non-food 2.1 percent. Within the latter, there were sizeable declines in all of the main categories, notably non-specialised stores (3.4 percent) and household goods (2.1 percent). Elsewhere, non-store retailing also decreased 1.1 percent but auto fuel advanced 2,2 percent.
June's update may have been biased down by poor weather and some loss was all but guaranteed after the May surge. Still, with overall volumes dipping 0.1 percent on the quarter, the underlying picture looks rather soft.
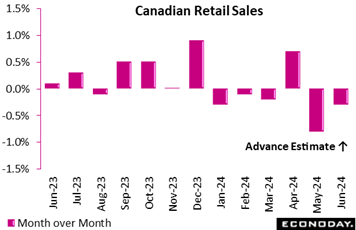 Retail sales in Canada fell a somewhat larger than expected 0.8 percent in May from April as the consensus forecast saw a 0.6 percent decline. Volumes were down 0.7 percent on the month. Sales rose 1.0 percent year-over-year. The advance estimate for June sales showed a decline of 0.3 percent. Retail sales in Canada fell a somewhat larger than expected 0.8 percent in May from April as the consensus forecast saw a 0.6 percent decline. Volumes were down 0.7 percent on the month. Sales rose 1.0 percent year-over-year. The advance estimate for June sales showed a decline of 0.3 percent.
In May, when consumer prices appreciated 2.9 percent year-over-year, retail sales decreases were evident in eight of nine subsectors, led by weakness in sales at food and beverage retailers.
Core retail sales, which omit gasoline and motor vehicles, fell by 1.4 percent on the month in May and were down 0.4 percent from a year ago. Sales fell in all core retail sectors. Food and beverage was down 1.9 percent, paced by a 2.1 percent drop at grocery stores and a 3.3 percent decline in sales of beer, wine and liquor.
The only sector to show a month-over-month month gain was autos and parts, up 0.3 percent, the third rise in four months, led by an increase of 1.6 percent at new car dealers and 1.8 percent at used car dealers. Gas station sales dipped 0.6 percent, reflecting lower prices. Gas sales in volume terms rose 1.0 percent.
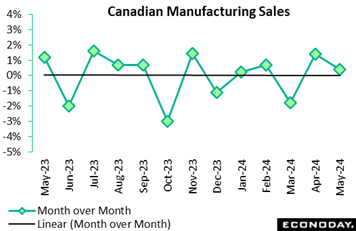 Canadian manufacturing sales continued to rise in May, up 0.4 percent but well down from a 1.4 percent increase in April. The May increase topped expectations for a 0.2 percent gain. Real sales also gained 0.4 percent on the month, which means a higher volume of goods was sold. In year-over-year terms, nominal sales were down 1.8 percent and declined a bigger 3.0 percent in real terms. Canadian manufacturing sales continued to rise in May, up 0.4 percent but well down from a 1.4 percent increase in April. The May increase topped expectations for a 0.2 percent gain. Real sales also gained 0.4 percent on the month, which means a higher volume of goods was sold. In year-over-year terms, nominal sales were down 1.8 percent and declined a bigger 3.0 percent in real terms.
Looking ahead, indicators generally suggest further recovery, as new orders rose 1.0 percent on the month and unfilled orders rose 0.8 percent. Inventories rose 0.2 percent, and the inventory-to-sales ratio was unchanged at 1.70 in May from April and versus 1.69 a year ago.
The unadjusted capacity utilization rate was up a big 1.9 points to 80.3 percent in May from 78.4 percent in April and 80.4 percent in May a year ago.
Aerospace was the big driver of May's increase with a gain of 11.2 percent after a decline of 6.1 percent in April as the sector continues to recover from weakness during the pandemic. Aerospace orders at $2.7 billion were the highest on record. Food products were a big winner too, up 1.4 percent.
On the downside, motor vehicle sales fell back by 4.2 percent in May after jumping by 5.1 percent in April. A retooling of an auto assembly plant in Ontario accounted for most of the decline. On the positive side, exports of motor vehicles rose 3.8 percent, mostly due to rising light truck sales to US customers.
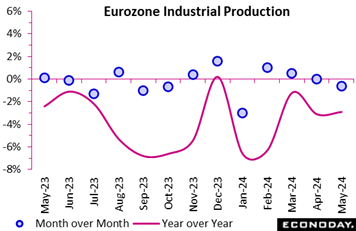 Industrial production fell 0.6 percent on the month in May, the first fall since January and steep enough to see output hit its lowest level since October 2020. Base effects meant that annual workday adjusted growth edged up from minus 3.1 percent to minus 2.9 percent but this was its fifth consecutive sub-zero outturn. Industrial production fell 0.6 percent on the month in May, the first fall since January and steep enough to see output hit its lowest level since October 2020. Base effects meant that annual workday adjusted growth edged up from minus 3.1 percent to minus 2.9 percent but this was its fifth consecutive sub-zero outturn.
The monthly setback reflected renewed decreases in intermediates (1.0 percent), capital goods (1.2 percent) and consumer durables (1.8 percent). Gains in non-durables (1.6 percent) and energy (0.8 percent) provided partial offsets.
Regionally the headline slide was led by Germany where production was down fully 2.4 percent versus April. France (minus 2.1 percent) and Spain (minus 0.2 percent) also had a poor month but Italy (0.5 percent) posted positive growth for the first time since last December.
The May data leave average Eurozone industrial production in the first two months of the quarter unchanged from their mean level in the first quarter when it contracted 0.9 percent. However, absent any revisions, June will need at least a 3.3 percent monthly gain just to keep second quarter output flat. The region's goods producing sector continues to struggle and almost certainly subtracted from GDP growth last quarter.
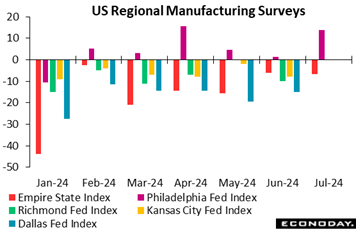 The Philadelphia Fed's manufacturing index rose more than a dozen points to a higher-than-expected 13.9 in data for July. This is the sixth straight score in the positive column and the highest of the streak next only to April's 15.5. The reading contrasts with a minus 6.6 showing for the Empire State index. Other regional reports for the month of July will follow in the coming weeks. The Philadelphia Fed's manufacturing index rose more than a dozen points to a higher-than-expected 13.9 in data for July. This is the sixth straight score in the positive column and the highest of the streak next only to April's 15.5. The reading contrasts with a minus 6.6 showing for the Empire State index. Other regional reports for the month of July will follow in the coming weeks.
For Philadelphia, the next headline for August may well again hold in positive ground judging by a more than 20-point jump in new orders to 20.7. This is the best reading for new orders since March 2022. Unfilled orders also rose, climbing a couple of tenths to 9.1 which is the highest for this reading since May 2022. Employment followed suit, jumping nearly 18 points to 15.2 for the best since October 2022.
Inventories are being drawn down this month, delivery times are increasing, and selling prices are rising sharply, the latter up more than 10 points to 24.2 which is the highest reading since January last year. Input costs, however, are easing this month, down nearly 3 points to 19.8.
Lower costs, higher selling prices and rising orders are certain to make respondents happy, evident in the 6-month outlook which jolted nearly 25 points higher to 38.7 to nudge out March's 38.6 for its best score since June 2021.
This report had been badly depressed through much of last year making the current run, topped off by July's results, a positive indication for needed improvement in the US manufacturing sector. These results will have forecasters lifting their estimates for the ISM manufacturing index which has been stuck in contraction since late 2022.
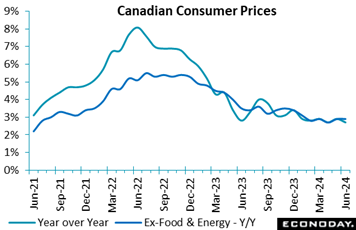 Consumer prices in Canada fell 0.1 percent in June from May, not seasonally adjusted, for a 12-month increase of 2.7 percent from 2.9 percent in May. Forecasters in an Econoday survey looked for increases of 0.1 percent on the month and 2.8 percent from a year ago. Consumer prices in Canada fell 0.1 percent in June from May, not seasonally adjusted, for a 12-month increase of 2.7 percent from 2.9 percent in May. Forecasters in an Econoday survey looked for increases of 0.1 percent on the month and 2.8 percent from a year ago.
Excluding food and energy, the consumer price index was flat on the month and up 2.9 percent year-over-year. The seasonally adjusted CPI rose a slight 0.1 percent in June from May.
Statistics Canada attributed the slower year-over-year rise to gasoline prices, which rose 0.5 percent in June from a year ago. That compares with a jump of 5.6 percent in May. Excluding gasoline, consumer prices in June rose 2.8 percent on the year.
On the other hand, prices were lifted by a 2.1 percent rise for food purchased in stores from a year ago, and a slower decline in cellular services, minus 12.8 percent in June versus minus 19.4 percent in May.
The Bank of Canada's own core measures of inflation came in at 2.6 percent year-over-year on average in June versus 2.7 percent in May, with all three measures still below 3.0 percent.
The latest update puts inflation on track to land well within the Bank of Canada's one percent to three percent target range. Prior to the CPI report, expectations for the Bank of Canada's July 24 meeting were split between calls for no action and a 25 basis point cut. June’s soft showing bolsters the case for an early move.
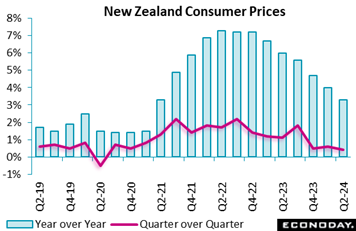 New Zealand consumer prices rose 3.3 percent on the year in the second quarter, down from 4.0 percent in the first quarter and below the consensus forecast of 3.5 percent. Headline inflation has been above the Reserve Bank of New Zealand's target range of one percent to three percent for 13 consecutive quarters but has now fallen for six consecutive quarters and is at its lowest level since early 2021. The index advanced 0.4 percent on the quarter after increasing 0.6 previously, also below the consensus forecast for an increase of 0.5 percent. New Zealand consumer prices rose 3.3 percent on the year in the second quarter, down from 4.0 percent in the first quarter and below the consensus forecast of 3.5 percent. Headline inflation has been above the Reserve Bank of New Zealand's target range of one percent to three percent for 13 consecutive quarters but has now fallen for six consecutive quarters and is at its lowest level since early 2021. The index advanced 0.4 percent on the quarter after increasing 0.6 previously, also below the consensus forecast for an increase of 0.5 percent.
The fall in headline inflation was largely driven by the year-over-year increase in food prices slowing from 2.4 percent to just 0.2 percent. Prices for clothing also rose at a slower pace, while the price of several household goods fell at a sharper pace. Other categories, however, recorded steady or sharper price increases. The year-over-year increase in transport costs picked up from 2.0 percent to 3.5 percent, while communication prices rose 5.2 percent on the year after previous increase of 3.2 percent.
The RBNZ left the official cash rate unchanged at 5.50 percent at its most recent meeting earlier in the month. In the statement accompanying that decision, officials advised that they still expect inflation will continue to trend lower towards their target range. They also indicated that rate cuts may be considered in upcoming meetings, noting that "the extent of this restraint will be tempered over time with the expected decline in inflation pressures". The second quarter’s fall in headline inflation may be enough to prompt officials to consider a rate cut at their next policy meeting in mid-August.
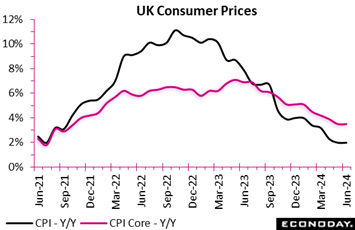 Having finally fallen back to target in May, UK inflation stabilised in line with expectations in June. Prices increased a monthly 0.1 percent, matching the market consensus and leaving the annual inflation rate unchanged at 2.0 percent. This equals its lowest mark since July 2021. Having finally fallen back to target in May, UK inflation stabilised in line with expectations in June. Prices increased a monthly 0.1 percent, matching the market consensus and leaving the annual inflation rate unchanged at 2.0 percent. This equals its lowest mark since July 2021.
The main upward pressure on the annual rate came from restaurants and hotels where inflation accelerated from 5.8 percent to 6.2 percent. Furniture and households goods (minus 1.6 percent after minus 1.9 percent) and transport (0.9 percent after 0.5 percent) also provided a modest boost. However, there were offsets from clothing and footwear (1.6 percent after 3.0 percent) and food and soft drink (1.5 percent after 1.7 percent). Consequently, the core rate was also steady as a 0.2 percent monthly gain in prices left the yearly change at 3.5 percent, a tick above the market call. Overall goods inflation dipped from minus 1.3 percent to minus 1.4 percent but its services counterpart held firm at a high 5.7 percent.
June's update is unlikely to be particularly well received at the Bank of England. Inflation has fallen significantly in recent months but with the core rate still a firm 3.5 percent and services nearly three times the target, most MPC members will probably vote to keep Bank Rate at 5.25 percent next month.
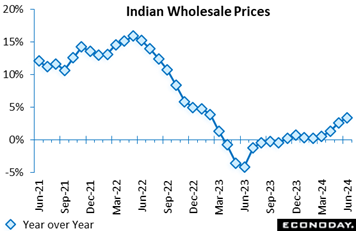 India's wholesale price index rose 3.36 percent on the year in June after increasing 2.61 percent in May. This has extended the recent acceleration in WPI inflation and takes it to its highest level since February 2023. Consumer price data published last week showed headline inflation rising from 4.75 percent in May to 5.08 percent in June, further above the mid-point of the Reserve Bank of India's target range of two percent to six percent. India's wholesale price index rose 3.36 percent on the year in June after increasing 2.61 percent in May. This has extended the recent acceleration in WPI inflation and takes it to its highest level since February 2023. Consumer price data published last week showed headline inflation rising from 4.75 percent in May to 5.08 percent in June, further above the mid-point of the Reserve Bank of India's target range of two percent to six percent.
The bigger year-over-year increase in wholesale prices in June was driven by food and manufacturing prices. Food prices, which account for around 15 percent of the index, rose 8.68 percent on the year after increasing 7.4 percent previously, while manufacturing prices, around 64 percent of the index, rose 1.43 percent on the year after a previous increase of 0.78 percent. In contrast, fuel prices, around 13 percent of the index, rose 1.03 percent on the year, moderating from the previous increase of 1.35 percent.
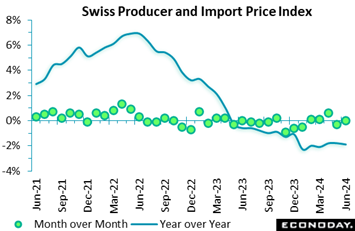 Having surprisingly fallen in May for the first time since January, Switzerland’s combined producer and import price index was unchanged on the month in June. The flat reading was slightly softer than the market consensus and weak enough to reduce the annual inflation rate from minus 1.8 percent to minus 1.9 percent, a 3-month low. Having surprisingly fallen in May for the first time since January, Switzerland’s combined producer and import price index was unchanged on the month in June. The flat reading was slightly softer than the market consensus and weak enough to reduce the annual inflation rate from minus 1.8 percent to minus 1.9 percent, a 3-month low.
Domestic prices were up 0.1 percent versus May, lifting their yearly rate from minus 1.3 percent to minus 1.2 percent. However, import prices fell 0.2 percent, reducing their annual rate from minus 2.9 percent to minus 3.2 percent.
Within the PPI, a 3.2 percent monthly slide in petroleum products was more than offset by smaller gains elsewhere with food, drink and tobacco (0.8 percent) as well as textiles and footwear (also 0.8 percent) notably robust. Import prices were driven lower by a 5.2 percent slump in petroleum charges. As a result, overall core prices were 0.1 percent firmer, nudging up the annual underlying rate from minus 2.2 percent to minus 2.1 percent, its first increase since March last year.
Pipeline price pressures are probably past their weakest point but current trends offer little threat to the Swiss National Bank's price stability goals.
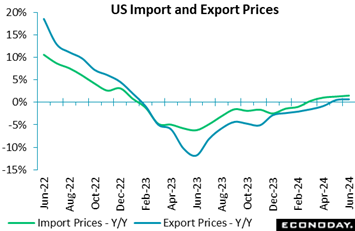 US import prices were unchanged on the month in June after falling 0.2 percent in May for an annual inflation rate of 1.6 percent. Though subdued and up only slightly from 1.4 percent in May, June's annual rate is the highest since December 2022. Export prices fell 0.5 percent on the month in June with this annual rate up slightly from May's 0.5 percent to 0.7 percent. US import prices were unchanged on the month in June after falling 0.2 percent in May for an annual inflation rate of 1.6 percent. Though subdued and up only slightly from 1.4 percent in May, June's annual rate is the highest since December 2022. Export prices fell 0.5 percent on the month in June with this annual rate up slightly from May's 0.5 percent to 0.7 percent.
Looking first at imports, energy isn't skewing the results as the monthly reading excluding fuels increased 0.2 percent for an annual rate of 1.0 percent. Petroleum prices fell 1.2 percent in June for the first monthly decline since December 2023. Import prices for agricultural commodities have been showing the most pressure, up 0.8 percent on the month for a 9.0 percent annual rate. Vegetables and green coffee rose in June offsetting a decline for fruits. Prices for imported finished goods were mostly flat yet prices of imported autos, though only 0.1 percent higher on the month, are up 2.5 percent on the year.
Export prices for agricultural commodities did rise 0.6 percent in June though this annual rate, in contrast to the import side, is down 4.8 percent on the year. Nonagricultural commodities fell 0.6 percent on the month for a 1.4 percent annual inflation rate. Finished goods were flat on the month with autos showing the highest annual rate at 4.0 percent.
After emerging from contraction earlier in the year both import and export prices are holding near the zero-line with only a slight upside bias, pointing to steady cross-border trade with no striking imbalances and not posing much risk to the inflation outlook.
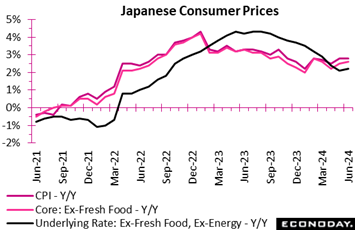 Consumer inflation in Japan inched up in two of the three key measures in June on reduced subsidies for electricity and natural gas supply, following a sharp rise in May when a hike in renewable energy fees was reflected in utility bills. Consumer inflation in Japan inched up in two of the three key measures in June on reduced subsidies for electricity and natural gas supply, following a sharp rise in May when a hike in renewable energy fees was reflected in utility bills.
The core CPI (excluding fresh food prices), closely watched by the Bank of Japan for its policy stance, rose 2.6 percent on year in June after the pace of increase picked up to 2.5 percent in May from 2.2 percent in April. The year-over-year increase in the total CPI was steady at 2.8 percent. The core-core underlying CPI (excluding fresh food and energy) edged up to 2.2 percent, as expected, after easing to a 20-month low of 2.1 percent in May. The annual rate for this narrow indicator had been at or above 3.0 percent from December 2022 until February 2024.
The combined upward pressure from energy and durable goods in June, the latter of which was boosted by a jump in air conditioners amid hot weather, offset the downward effect of easing markups for processed foods. Goods prices excluding fresh food gained 3.5 percent on the year in June, while service prices excluding owners' equivalent rent rose 2.4 percent.
Services costs, in contrast to many other economies, have lost some steam after having led overall inflation earlier. Large firms are raising wages to secure workers amid labor shortages but some smaller firms cannot afford to catch up; regulated wages for medical, welfare and education workers remain low, which is keeping underlying inflation tame and thus leaving the Bank of Japan cautious about raising interest rates.
The BoJ is expected to cautiously raise the overnight interest rate target, with its next move possibly in September but not likely in July. At its meeting in June, the nine-member board decided in a unanimous vote to hold the overnight interest rate target steady in a range of 0 percent to 0.1 percent for the second straight meeting. The board also decided in an 8 to 1 vote to set the stage for gradually reducing the bank's large purchases of Japanese government bonds for the next year or two years "to ensure long-term interest rates would be formed more freely in financial markets." It will work out a specific plan at its July 30-31 meeting after bank officials have compared notes with market participants.
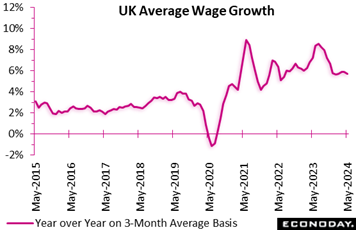 The latest UK labour survey shows a gradual cooling of overall market conditions but, while weaker, still high earnings growth. The latest UK labour survey shows a gradual cooling of overall market conditions but, while weaker, still high earnings growth.
Claimant count unemployment rose a surprisingly steep 32,300 on the month to 1.663 million in June following a 51,900 increase in May. The advance was the third in as many months and the ninth since last September. It was also large enough to lift the jobless rate by a tick to 4.4 percent, matching its highest mark since February 2022.
Meantime, the ILO data for March-May showed the number of people out of work climbing 88,000 to 1.528 million. This left the jobless rate also at 4.4 percent, matching the market consensus. Employment was up 19,000 to 32,999 but, at 74.4 percent, the rate was still 0.1 percentage point lower than in the previous 3-month period. It was also down 1.1 percentage points on the year.
Other data were equally mixed. Payroll data showed a 15,513 increase to 30.424 million in June, its second rise in three months and a new high. However, vacancies last quarter dropped a further 30,000 on the quarter although were still up 93,000 on the year and were above their pre-Covid levels.
Wage growth eased but only in line with market expectations and remained high. At a 5.7 percent rate, average annual growth in the three months to May was down a couple of ticks versus the previous month and at its lowest mark since the three months to January. Nonetheless, with regular earnings matching that rate, albeit down a sharper 0.3 percentage points, wages will need to slow more to be consistent with the two percent inflation target.
The labour market is moving in the right direction for the Bank of England, yet conditions remain quite tight as reflected in the only gentle deceleration in wage growth. As such, the August MPC will probably want to see additional evidence of cooling inflationary pressures before finally pulling the trigger on an interest rate cut.
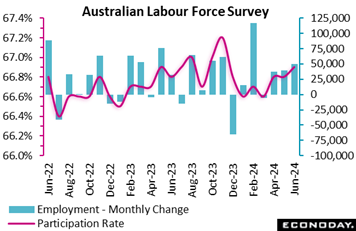 Labour market conditions in Australia tightened further in June, with employment up more strongly than the consensus forecast and the participation rate moving higher. This strength will likely keep the focus at the Reserve Bank of Australia on risks to the inflation outlook, suggesting officials will again seriously consider a rate hike at their meeting scheduled for next month. Labour market conditions in Australia tightened further in June, with employment up more strongly than the consensus forecast and the participation rate moving higher. This strength will likely keep the focus at the Reserve Bank of Australia on risks to the inflation outlook, suggesting officials will again seriously consider a rate hike at their meeting scheduled for next month.
The number of people employed in Australia rose by 50,200 in June, up from an increase of 39,700 in May. This was well above the consensus forecast for an increase of 19,000. Full-time employment rose by 43,300 persons after a previous increase of 41,700, while part-time employment rebounded with an increase of 6,800 persons after a previous decline of 2,100. Hours worked rose 0.3 percent on the month after falling 0.5 percent previously.
The unemployment rate rose a notch from 4.0 percent in May to 4.1 percent in June. Yet the participation rate also rose slightly from 66.8 percent to 66.9 percent, just below the record high of 67.0 percent recorded in November 2023.
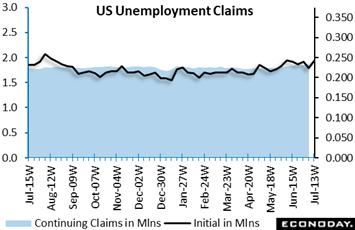 The prior week's sharp decline in US jobless claims proved to be a one-week wonder. Initial claims in the latest week jumped 20,000 to more than reverse the 16,000 drop of the July 6 week. The swings did little to move the 4-week average which edged 1,000 higher in the July 13 week to 234,750. Note that the 16,000 drop in the prior week was the largest since the September 16 week last year. The prior week's sharp decline in US jobless claims proved to be a one-week wonder. Initial claims in the latest week jumped 20,000 to more than reverse the 16,000 drop of the July 6 week. The swings did little to move the 4-week average which edged 1,000 higher in the July 13 week to 234,750. Note that the 16,000 drop in the prior week was the largest since the September 16 week last year.
Continuing claims also rose 20,000 in lagging data for the July 6 week to lift this 4-week average by more than 10,000 to 1.851 million for the highest level since late November 2021. Nevertheless, the unemployment rate for uninsured workers remains at only 1.2 percent.
The week's rise in initial claims re-establishes a recent break above 230,000 versus a trend closer to 210,000 going back to late last year. Nevertheless, a 230,000 level still indicates a tight labor market though the shift higher does offer debating points, at least to a degree, for cutting interest rates.
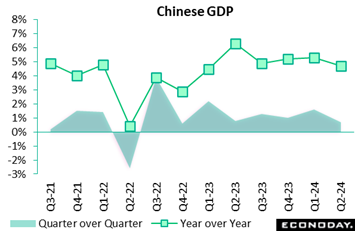 China's GDP rose 0.7 percent on the quarter in the three months to June, slowing sharply from growth of 1.6 percent in the three months to March with year-over-year growth also moderating, from 5.3 percent to 4.7 percent. This was weaker than the consensus forecast for quarter-over-quarter growth of 1.0 percent and year-over-year growth of 5.1 percent. Monthly data also published along with GDP showed weaker growth in key activity indicators and a sharper decline in house prices, though growth in industrial production, at 5.3 percent, moderated less than expected. China's GDP rose 0.7 percent on the quarter in the three months to June, slowing sharply from growth of 1.6 percent in the three months to March with year-over-year growth also moderating, from 5.3 percent to 4.7 percent. This was weaker than the consensus forecast for quarter-over-quarter growth of 1.0 percent and year-over-year growth of 5.1 percent. Monthly data also published along with GDP showed weaker growth in key activity indicators and a sharper decline in house prices, though growth in industrial production, at 5.3 percent, moderated less than expected.
Officials characterised the data as showing that "the national economy was generally stable with steady progress". However, they also cautioned that "the external environment is intertwined and complex, the domestic effective demand remains insufficient and the foundation for sound economic recovery and growth still needs to be strengthened". After noting in recent months that they will seek to "frontload and effectively implement" macroeconomic policies that have already been introduced, the latest statement dropped this language, perhaps indicating that some adjustment to policy settings may be considered in the near-term.
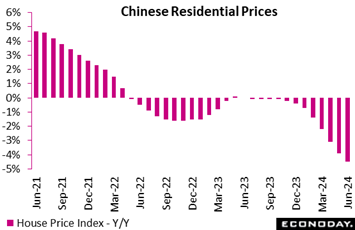 China's residential property prices fell 4.5 percent on the year in June, worsening from a decline of 3.9 percent in May. This is the biggest year-over-year decline in house prices since 2015 and may prompt additional policy measures to support conditions in the property market. China's property market has been very weak for nearly two years, representing a major drag on investment and consumer spending. China's residential property prices fell 4.5 percent on the year in June, worsening from a decline of 3.9 percent in May. This is the biggest year-over-year decline in house prices since 2015 and may prompt additional policy measures to support conditions in the property market. China's property market has been very weak for nearly two years, representing a major drag on investment and consumer spending.
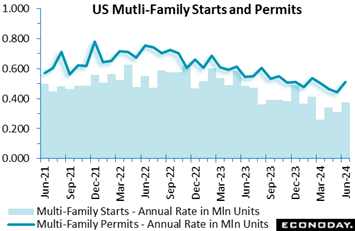 Driven by multi-unit demand, US housing starts jumped 3.0 percent in June to a higher-than-expected 1.353 million annual rate with permits also beating expectations, up 3.4 percent to 1.446 million. Adding further to starts were sharp upward revisions to the two prior months, to 1.314 from 1.277 million for May and to 1.377 from 1.352 for April. Driven by multi-unit demand, US housing starts jumped 3.0 percent in June to a higher-than-expected 1.353 million annual rate with permits also beating expectations, up 3.4 percent to 1.446 million. Adding further to starts were sharp upward revisions to the two prior months, to 1.314 from 1.277 million for May and to 1.377 from 1.352 for April.
The prospect that mortgage rates had peaked and that Federal Reserve rate cuts were on the horizon likely gave a push to builder activity in June. Yet even with the gains, starts continue to trend near four-year lows with permits near year-and-a-half lows. Year-over-year, starts are down 4.4 percent and permits down 3.1 percent.
And June readings for the key single-family category were less than favorable, down 2.2 percent on the month for starts to a 980,000 rate and down 2.3 percent to 934,000 for permits. High prices for single units are at play, raising relative demand for more affordable multi-unit structures. Permits for the 5-unit-plus category jumped 19.2 percent to a 460,000 rate from May's 386,000. When adding in the 2- to 4-unit category as tracked in the blue line of the accompanying graph, permits jumped 15.6 percent to 512,000 from 443,000.
And prices for the 5-unit category may become even more affordable given a surge of completions for this category coming on the market, to a 656,000 rate from May' 520,000. Single-family completions rose less spectacularly, to 1.037 from 1.019 million.
June's report gives a general lift to the US housing outlook suggesting that builders are positioning themselves for a more favorable rate environment.
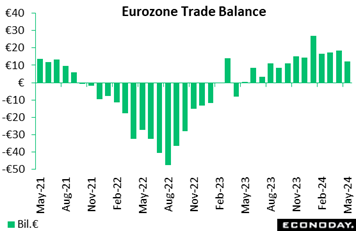 The Eurozone’s seasonally adjusted merchandise trade balance deteriorated in May. At €12.3 billion, the surplus was well short of €18.5 billion in April and the smallest since last October. The decline was driven by exports which fell 2.6 percent on the month to touch a 5-month low. Imports dipped just 0.1 percent. However, unadjusted, the black ink stood at €13.9 billion, a marked improvement on the €0.4 billion deficit posted in May last year. The Eurozone’s seasonally adjusted merchandise trade balance deteriorated in May. At €12.3 billion, the surplus was well short of €18.5 billion in April and the smallest since last October. The decline was driven by exports which fell 2.6 percent on the month to touch a 5-month low. Imports dipped just 0.1 percent. However, unadjusted, the black ink stood at €13.9 billion, a marked improvement on the €0.4 billion deficit posted in May last year.
The monthly drop in the adjusted balance leaves a worsening trend with exports at best only flat and imports rising modestly. That said, the balance remains well in the black and the unadjusted data show yearly export growth of minus 0.5 percent versus minus 6.4 percent for their import counterpart.
Both sides of the balance sheet remain impacted by the war in Ukraine. For the EU as a whole, exports to Russia were down 16.3 percent on the year while imports were off 18.3 percent.
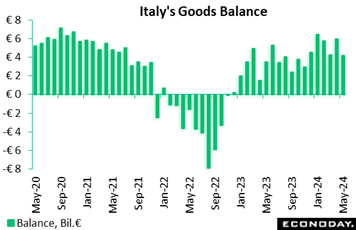 May's merchandise trade balance showed solid performance with a €4.16 billion surplus, though this marked a decline from April's €5.97 billion surplus. Exports declined by 3.8 percent and imports by 0.5 percent compared to April 2024. Exports to EU and non-EU countries fell for both EU countries by 3.3 percent and non-EU countries by 4.4 percent, while imports fell for the EU by 1.9 percent but rose for non-EU countries by 1.5 percent. Despite these monthly declines, quarterly data showed a modest rise in exports by 0.1 percent and a notable increase in imports by 1.9 percent. May’s balance comprised a €742 million deficit for EU countries and a €4.9 billion surplus for non-EU countries. Excluding energy, the trade surplus was €10.45 billion. May's merchandise trade balance showed solid performance with a €4.16 billion surplus, though this marked a decline from April's €5.97 billion surplus. Exports declined by 3.8 percent and imports by 0.5 percent compared to April 2024. Exports to EU and non-EU countries fell for both EU countries by 3.3 percent and non-EU countries by 4.4 percent, while imports fell for the EU by 1.9 percent but rose for non-EU countries by 1.5 percent. Despite these monthly declines, quarterly data showed a modest rise in exports by 0.1 percent and a notable increase in imports by 1.9 percent. May’s balance comprised a €742 million deficit for EU countries and a €4.9 billion surplus for non-EU countries. Excluding energy, the trade surplus was €10.45 billion.
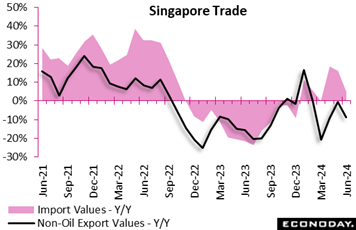 Singapore's non-oil domestic exports fell 8.7 percent on the year in June after falling 0.7 percent in May and fell 0.4 percent on the month after a previous decline of 0.7 percent. Imports rose 4.7 percent on the year in June after advancing 16.0 in May and fell 3.2 percent on the month after dropping 2.4 percent previously. Singapore's non-oil domestic exports fell 8.7 percent on the year in June after falling 0.7 percent in May and fell 0.4 percent on the month after a previous decline of 0.7 percent. Imports rose 4.7 percent on the year in June after advancing 16.0 in May and fell 3.2 percent on the month after dropping 2.4 percent previously.
Weakness in external demand was broad-based. Exports of electronics products fell 9.5 percent on the year in June after increasing 19.6 percent in May, while exports of non-electronic products fell 8.5 percent after dropping 6.1 percent previously. Exports to China, the US, Hong Kong, Taiwan and South Korea all fell on the year, offset by increases in exports to European Union and some south-east Asian trading partners.
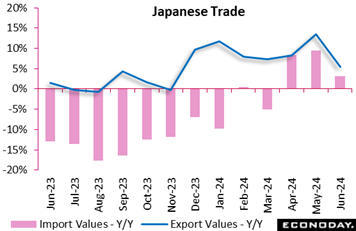 Japanese exports rose 5.4 percent for the seventh straight year-over-year increase in June, led by solid demand for chip equipment, non-ferrous metals and plastics though the pace of increase slowed from 13.5 percent in May. The pace of export growth came in below Econoday’s consensus forecast of a 6.1 percent gain. Japanese exports rose 5.4 percent for the seventh straight year-over-year increase in June, led by solid demand for chip equipment, non-ferrous metals and plastics though the pace of increase slowed from 13.5 percent in May. The pace of export growth came in below Econoday’s consensus forecast of a 6.1 percent gain.
Import values rose 3.2 percent in June versus expectations for 6.4 percent. The increase was led by strong demand for computers, engines and telecom equipment (smartphones). Purchases of coal remained below year-earlier levels.
The trade balance recorded a ¥224.0 billion surplus, coming in stronger than the median forecast of a ¥142.3 billion deficit. It followed a ¥1,220.1 billion (¥1.22 trillion) deficit in May and compared with a ¥36.5 billion surplus in June last year.
Shipments to China, a key export market for Japanese goods, posted their seventh straight increase thanks to recovering demand for chip-making equipment and non-ferrous metals amid a gradual pickup in the world's second-largest economy. Japanese exports to the European Union fell on year for the third straight month, hit by lower demand for automobiles and steel as seen in the prior month. Exports to the US remained robust, up for the 33rd straight month on autos and auto parts, after hitting a record high in December 2023.
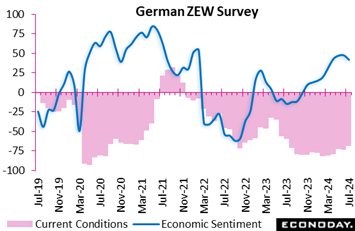 The ZEW economic sentiment indicator for Germany experienced its first decline in a year, plummeting by 5.7 points to 41.8 in July. Despite this decline, the assessment of Germany's economic situation improved marginally, rising 4.9 points to minus 68.9. Negative factors include uncertainty over ECB policy, political instability in France, and unexpectedly weak May exports. These data indicate that there is a growing sense of pessimism regarding the future of the German economy in the face of persistent obstacles. The ZEW economic sentiment indicator for Germany experienced its first decline in a year, plummeting by 5.7 points to 41.8 in July. Despite this decline, the assessment of Germany's economic situation improved marginally, rising 4.9 points to minus 68.9. Negative factors include uncertainty over ECB policy, political instability in France, and unexpectedly weak May exports. These data indicate that there is a growing sense of pessimism regarding the future of the German economy in the face of persistent obstacles.
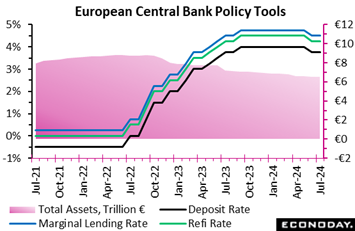 Having cut key interest rates at its last meeting in June, the ECB again matched market expectations by leaving policy on hold. The refi rate remains at 4.25 percent, the (still key) deposit rate at 3.75 percent and the rate on the marginal lending facility at 4.50 percent. Having cut key interest rates at its last meeting in June, the ECB again matched market expectations by leaving policy on hold. The refi rate remains at 4.25 percent, the (still key) deposit rate at 3.75 percent and the rate on the marginal lending facility at 4.50 percent.
The previous forward guidance was also unamended and so still says that the bank will "keep policy rates sufficiently restrictive for as long as necessary…" to achieve the inflation target. In other words, the ECB refuses to commit to further easing in the absence of fresh data that, from an inflation point of view, suggest that it is safe to do so. Indeed, the bank remains data-dependent, effectively meaning that policy continues to be tied to developments in the HICP in general and in the core HICP measures in particular.
Still, non-standard policy measures are now tightening policy more aggressively than earlier as, in line with pre-announced plans, the €1.7 trillion pandemic emergency purchase programme (PEPP) has been brought into the QT fold. The move will bolster the net asset sales already underway from longstanding asset purchase programme (APP) by a targeted €7.5 billion a month through December.
In summary, there were no major surprises in either the official statement or press conference. Policy remains geared towards lower interest rates but only if inflation developments permit. Following the mixed June report which underlined the stickiness of prices in some key areas, most Governing Council members will want reassurance that inflation is still thought to be on track to sustainably meet its target. To this end, the next meeting on September 12, when the bank is due to issue updated economic forecasts, could see the next cut – but only so long as the projections show policy is working.
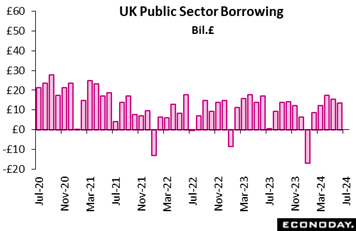 Public sector finances were in worse shape than expected in June. Overall net borrowing (PSNB) was £13.59 billion, well above the market consensus and following an upwardly revised £15.57 billion in May. However, compared with a year ago, the shortfall declined £3.24 billion. Excluding public sector banks (PSNB-X), the red ink stood at £14.51 after a larger revised £16.50 billion in mid-quarter and £17.75 billion in June 2023. Public sector finances were in worse shape than expected in June. Overall net borrowing (PSNB) was £13.59 billion, well above the market consensus and following an upwardly revised £15.57 billion in May. However, compared with a year ago, the shortfall declined £3.24 billion. Excluding public sector banks (PSNB-X), the red ink stood at £14.51 after a larger revised £16.50 billion in mid-quarter and £17.75 billion in June 2023.
Total public sector spending fell £1.3 billion versus last June helped by a large drop in debt interest payments. Receipts were up £1.6 billion on the year on the back of higher tax inflows. Net debt was 99.5 percent of GDP, up from 99.1 percent in May but down 2.8 percentage points versus June 2023. Broadly speaking, it remains in line with the levels last seen in the early 1960s.
The June PSNB-X was £2.9 billion more than forecast by the Office for Budget Responsibility (OBR) and so underlines fiscal problems facing the new Labour government. Achieving the targeted fully funded current budget will not be easy, especially should economic activity in general continue to fall short of market expectations (see Bottom Line below for details).
Econoday’s Relative Performance Index moved from slightly negative ground in the prior week to slightly positive ground, to plus 4 and to plus 8 less price data (RPI-P). Though more neutral than positive, the latest levels are the best since mid-May to indicate that results are now coming in above economic forecasts.
In the Eurozone, after a surprisingly soft run of data through June, early July reports have been firm enough to boost the region’s RPI to 23 and the RPI to 28. Both measures show a moderate degree of overall economic outperformance and, with confirmation of sticky core inflation last month, help to justify the ECB’s decision to keep policy rates on hold.
Lifted by better-than-expected retail sales and housing starts data, the US moved into positive ground at 16 both overall and at 16 for the RPI-P for some of the best scores of the last several months. Yet given how subdued forecasts have been, modest outperformance isn't likely to quiet talk of a Federal Reserve rate cut.
Based on economic underperformance, a rate cut at Wednesday’s Bank of Canada meeting would be no surprise. Pulled lower by weak retail sales data, the country’s RPI is at minus 30 and, when excluding what have been lower-than-expected inflation results, the RPI-P is at minus 21.
Stable inflation and a mixed jobs report have left investors uncertain about the outcome of the August Bank of England meeting. However, at minus 30 and minus 32 respectively, the RPI and RPI-P for the UK show overall economic activity currently falling quite well short of the consensus which almost certainly means that at least two board members will want an immediate cut.
In Switzerland, pipeline inflation pressures were slightly less than expected in June and ensured that both the RPI at minus 36 and RPI-P at minus 25 remained well below zero. Economic activity in general has been unexpectedly weak for most of the period since the middle of March.
In Japan, June’s inflation report was a little softer than anticipated and probably reduces the likelihood of a hike in BoJ interest rates at the end of the month. To this end, overall, economic data have also typically surprised modestly on the downside since mid-May and, at currently minus 17 and minus 12 respectively, the RPI and RPI-P both show activity still running a little behind market expectations.
Chinese GDP moderated a bit more than expected though monthly data on industrial production beat the consensus, leaving the country’s RPI at minus 7 and the RPI-P at exactly zero. Overall economic activity is now moving in line with forecasts but only after surprising mainly on the downside over the last couple of months.
**Contributing to this article were Jeremy Hawkins, Brian Jackson, Mace News, Max Sato, Olajide Oyadeyi, and Theresa Sheehan
The People’s Bank of China is expected to keep its loan prime rates unchanged on Monday. For the Bank of Canada on Wednesday, though views are split, a second rate cut is expected by most forecasters. Both banks are facing underperforming economies.
The first estimate for second-quarter US GDP on Thursday is expected to show an uptick in growth to an annualized 1.8 percent from the first quarter’s 1.4 percent. Consumption expenditures are seen at 2.0 percent versus 1.5 percent. Friday will see the PCE price indexes as part of the personal income and outlays report; marginal slowing to 2.5 percent is seen for both the overall and ex-food ex-energy core rates. And despite two week’s of intense political drama, no change is expected for the month-end consumer sentiment report on Friday.
Wednesday will see the round of July PMI flashes with modest improvement expected for Germany, the Eurozone, and the UK. The PMIs for the US are expected to be little changed to slightly lower.
China Loan Prime Rates (Mon 0915 CST; Mon 0115 GMT; Sun 2115 EDT)
Consensus Change: 1-Year Rate: 0 basis points
Consensus Level: 3.45%
Consensus Change: 5-Year Rate: 0 basis points
Consensus Level: 3.95%
Officials are expected to hold rates unchanged at July’s announcement: at 3.45 percent for the 1-year rate and 3.95 percent for the 5-year. The last time either of these rates were changed was in February with a 25-basis-point cut for the 5-year.
Singapore CPI for June (Tue 1300 SGT; Tue 0500 GMT; Tue 0100 EDT)
Consensus Forecast, Year over Year: 2.7%
Consumer prices in June are expected to slow back to 2.7 percent versus May’s higher-than-expected 3.1 percent rate that, fed by transportation costs, was up from April’s 2.7 percent.
Eurozone: EC Consumer Confidence Flash for July (Tue 1600 CEST; Tue 1400 GMT; Tue 1000 EDT)
Consensus Forecast: -13.5
Consumer confidence in July is expected to rise to minus 13.5 versus June’s minus 14.0. This index has been slowly improving.
Germany: GfK Consumer Climate for August (Wed 0800 CEST; Wed 0600 GMT; Wed 0200 EDT)
Consensus Forecast: -21.0
After July’s decline to minus 21.8 from June’s minus 21.0, which was the first decline in five months, the consumer climate index in August is expected to rise back to minus 21.0.
German PMI Flashes for July (Wed 0930 CEST; Wed 0730 GMT; Wed 0330 EDT)
Consensus Forecast, Composite: 50.8
Consensus Forecast, Manufacturing: 44.0
Consensus Forecast, Services: 53.5
Manufacturing in June remained deeply depressed at 43.5 and only limited improvement is expected for July where the consensus is 44.0. Services, which in June slowed more than a point to a lower-than-expected 53.1, are seen rising to 53.5. Consensus for July’s composite is 50.8 following June’s 50.4.
Eurozone PMI Flashes for July (Wed 1000 CEST; Wed 0800 GMT; Wed 0400 EDT)
Consensus Forecast, Composite: 51.0
Consensus Forecast, Manufacturing: 46.1
Consensus Forecast, Services: 53.0
The composite is expected to edge higher in July to 51.0 versus 50.9 in June and 52.2 in May. Manufacturing in July is expected to rise slightly to 46.1 versus June’s 45.8 that was down from May’s 47.3, with services expected to inch ahead to 53.0 from June’s 52.8.
UK PMI Flashes for July (Wed 0930 BST; Wed 0830 GMT; Wed 0430 EDT)
Consensus Forecast, Composite: 52.6
Consensus Forecast, Manufacturing: 51.2
Consensus Forecast, Services: 52.5
Manufacturing, at 50.9 in June, has held over the 50 line in three of the last four reports with July seen at 51.2. Services, at 52.1 in June, has held over 50 for the last eight reports with July’s consensus at 52.5. The composite is expected to rise to 52.6 from 52.3.
Bank of Canada Announcement (Wed 0945 EDT; Wed 1345 GMT)
Consensus Forecast, Change: 25 basis points
Consensus Forecast, Level: 4.50%
Economists are split with more seeing a second straight 25-basis-point rate cut rather than no action. Inflation has been easing and economic data have been underperforming.
Korean Second-Quarter GDP, First Estimate (Thu 0800 KST; Wed 2300 GMT; Wed 1900 EDT)
Consensus Forecast, Quarter over Quarter: 0.1%
Consensus Forecast, Year over Year: 2.7%
Second-quarter GDP is expected to edge 0.1 percent higher on the quarter and rise 2.7 percent on the year. These would compare respectively with growth of 1.3 and 3.3 percent in the first quarter and 0.6 and 2.2 percent in the fourth quarter.
French Business Climate Indicator for July (Thu 0845 CEST; Thu 0645 GMT; Thu 0245 EDT)
Consensus Forecast: 99
Sentiment in French manufacturing is expected to hold unchanged at 99 in July.
German Ifo for July (Thu 1000 CEST; Thu 0900 GMT; Thu 0400 EDT)
Consensus Forecast, Business Climate: 89.0
Consensus Forecast, Current Conditions: 88.5
Consensus Forecast, Business Expectations: 89.5
The business climate index in June fell to a lower-than-expected 88.6 from May’s 89.3. July’s consensus is partial recovery to 89.0.
Eurozone M3 Money Supply for June (Thu 1000 CEST; Thu 0800 GMT; Thu 0400 EST)
Consensus Forecast, Year-over-Year: 1.9%
The 3-month moving average is expected to increase 1.9 percent in June following May’s 1.3 percent rise that extended a trend of gains.
US Durable Goods Orders for June (Thu 0830 EDT; Thu 1230 GMT)
Consensus Forecast: Month over Month: 0.5%
Consensus Forecast: Ex-Transportation - M/M: 0.2%
Consensus Forecast: Core Capital Goods Orders - M/M: 0.1%
Forecasters see durable goods orders rising 0.5 percent in June following a flat 0.1 percent rise in May. Ex-transportation orders are seen up 0.2 percent in June with core capital goods, which dropped a sharp 0.6 percent in May, expected to recover only 0.1 percent.
US Second-Quarter GDP, First Estimate (Thu 0830 EDT, Thu 1230 GMT)
Consensus Forecast, Annualized Rate: 1.8%
US Real Personal Consumption Expenditures
Consensus Forecast: 2.0%
Second-quarter GDP is expected to improve to 2.0 percent annualized growth versus first quarter growth of 1.4 percent. Personal consumption expenditures, after the first quarter's 1.5 percent rate, are expected to rise 2.0 percent.
US International Trade in Goods (Advance) for June (Thu 0830 EDT; Thu 1230 GMT)
Consensus Forecast, Balance: -$98.0 billion
The US goods deficit (Census basis) is expected to narrow by $1.4 billion to $98.0 billion in June after deepening by $1.2 billion in May to $99.4 billion.
Tokyo Consumer Price Index for July (Fri 0830 JST; Thu 2330 GMT; Thu 1930 EDT)
Consensus Forecast, Year over Year: 2.3%
Ex-Fresh Food, Consensus Forecast: 2.2%
Ex-Fresh Food & Energy, Consensus Forecast: 1.6%
Overall inflation in Tokyo is expected to hold steady at 2.3 percent rate. Underlying rates are expected at 2.2 percent for the ex-fresh food core versus June’s 2.1 percent and at 1.6 percent for the ex-fresh food ex-energy rate versus 1.8 percent.
US Personal Income for June (Fri 0830 EDT; Fri 1230 GMT)
Consensus Forecast, Month over Month: 0.4%
US Consumption Expenditures
Consensus Forecast, Month over Month: 0.3%
US PCE Price Index
Consensus Forecast, Month over Month: 0.1%
Consensus Forecast, Year over Year: 2.5%
US Core PCE Price Index
Consensus Forecast, Month over Month: 0.1%
Consensus Forecast, Year over Year: 2.5%
Personal income is expected to rise 0.4 percent in June with consumption expenditures expected to increase 0.3 percent. These would compare with May’s increases of 0.5 percent for income and 0.2 percent for consumption. Inflation readings for June are expected at monthly increases of 0.1 percent both overall and for the core (versus 0.0 and 0.1 percent in May) with annual rates expected at 2.5 percent for both (versus 2.6 percent for both).
US Consumer Sentiment Index, Final July (Fri 1000 EDT; Fri 1400 GMT)
Consensus Forecast: 66.0
Year-Ahead Inflation Expectations
Consensus Forecast: 2.9
Two weeks of high political drama are not expected to affect July’s final reading for consumer sentiment, which is expected to hold at the preliminary reading of 66.0 that was more than 2 points below June. Year-ahead inflation expectations for final July are expected at 2.9 percent, also unchanged from the preliminary report.
|
