|
Jerome Powell was firmly neutral at Wednesday’s press conference, stressing that policy is data dependent and that a rate cut would depend on how economic data unfold. And unravel the data did on Friday as nonfarm payrolls came in well below expectations as did wage growth at the same time that the unemployment rate jumped 2 tenths. Expectations for a rate cut are well-founded between a rebalanced job market and disinflation not only for commodities but for services and wages as well. The payroll results sent Econoday’s Relative Performance Index to one of its lowest levels of the year, at minus 30 to indicate that US data are now decidedly underperforming relative to expectations. Election or not, action at the September 17-18 policy meeting would be no surprise from today’s vantage point nor would accommodative commentary at the Fed’s Jackson Hole Conference on August 22-24.
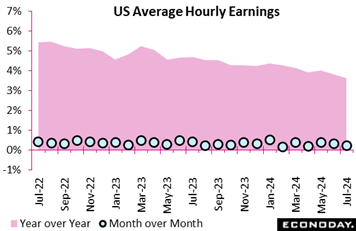 July nonfarm payrolls rose 114,000, well below Econoday’s consensus for 180,000 and included a net downward revision of 29,000 in the two prior months. Average hourly earnings rose a modest 0.2 percent on the month while the year-over-year rate fell from a downwardly revised 3.8 percent to 3.6 percent for the lowest reading in more than three years. July nonfarm payrolls rose 114,000, well below Econoday’s consensus for 180,000 and included a net downward revision of 29,000 in the two prior months. Average hourly earnings rose a modest 0.2 percent on the month while the year-over-year rate fell from a downwardly revised 3.8 percent to 3.6 percent for the lowest reading in more than three years.
The report suggests that the US labor market has now normalized and that the balance between labor supply and demand has been restored. Yes, the numbers are softer than expected but not exceptionally so. Nevertheless, it may well put the seal on expectations for a rate cut at the September meeting.
Yet the details are far from grim. The goods-producing sector added 25,000 new payroll jobs in July led by an increase of 25,000 in construction where a 1,000 decline in mining offset a 1,000 increase in manufacturing. Service-providers' payrolls rose 72,000, lifted by a 64,000 rise for health care and social assistance. Payrolls in the government sector rose 17,000 led by local education.
The softening in wages reflects easing competitive pressures. Retail earnings, for example, fell 0.1 percent and were up only 2.0 percent year-over-year – the latter hitting the Fed’s general target. Yet construction offers a counter example, with wages up 0.4 percent on the month and 4.3 percent on the year.
At his Wednesday press conference, Jerome Powell highlighted progress on inflation saying nominal wage growth had eased and that the PCE and PCE core indexes, at 2.5 and 2.6 percent respectively, are now closer to the Fed's 2.0 percent goal.
He said the labor market is in "better balance" citing an increase in the supply of workers as a special positive, specifically gains for the 25-54 age group as well as a "strong pace of immigration". Like his June press conference, Powell characterized the labor market as "strong but not overheated". These comments, again, were before August’s data were posted.
In Wednesday’s policy statement, the FOMC said inflation was only "somewhat" elevated, indicating renewed progress in disinflation. In a pivotal move, the word "highly" was removed from the phrase "highly attentive to inflation risks" that has been present since May 2022. Attention is now shifted to "both sides of its dual mandate", that is a more even balance between inflation and employment.
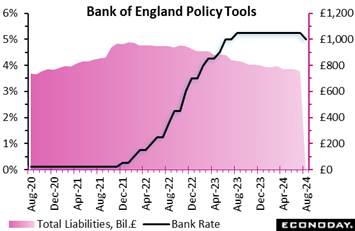 Unlike the Fed, the Bank of England cut its policy rate, by 25 basis points to 5.0 percent for the first reduction since March 2020 and matching its lowest level since May last year. Yet, split at 5-4, it was the tightest of votes as fully four members (Catherine Mann, Megan Greene, Jonathan Haskel and Huw Pill) all again opted for no change. Unlike the Fed, the Bank of England cut its policy rate, by 25 basis points to 5.0 percent for the first reduction since March 2020 and matching its lowest level since May last year. Yet, split at 5-4, it was the tightest of votes as fully four members (Catherine Mann, Megan Greene, Jonathan Haskel and Huw Pill) all again opted for no change.
The ease reflects increased confidence on the part of the majority that inflation is now headed in the right direction on a sustainable basis. That said, even for those calling for a cut, the decision will not have been taken lightly. Although CPI inflation was on target at 2.0 percent in both May and June, at 3.5 percent the core rate was still worryingly high while, at 5.7 percent, the rate in services was nearly three times the target.
Crucially though, most MPC members expect the fall in headline inflation and the normalisation in inflation expectations to feed through to weaker pay and price-setting dynamics. In addition, spare capacity should emerge as GDP falls below potential and the labour market eases further. Consequently, domestic inflationary persistence is expected to fade away over the next few years, aided by what is still a restrictive stance of monetary policy.
Even so, there are general concerns that inflationary pressures from second-round effects will prove more enduring. In particular, those voting to keep Bank Rate at 5.25 percent remain worried about still elevated wage growth. Some also think there’s a greater risk of more enduring structural shifts, such as a rise in the medium-term equilibrium rate of employment, a fall in potential growth and a rise in the long-run neutral interest rate.
Prior to the announcement, financial markets had already fully priced in two 25-basis-point cuts by year-end and speculation now will focus on the next policy announcement on September 19. By then, the MPC will have available the next two CPI and labour market reports. Given the closeness of the latest vote, all these updates will probably need to show clearly diminishing underlying inflation pressures for Bank Rate to be lowered again.
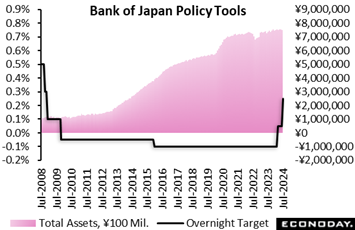 Unlike other major central banks, the Bank of Japan is raising rates, voting 7-2 to lift its overnight rate target to 0.25 percent from a range of 0.0 to 0.1 percent, citing gradually rising inflation expectations among households and businesses and high but slightly easing uncertainties for the economy. It also warned of upside risks to its GDP and CPI forecasts, specifically pointing out that the impact of currency fluctuations on domestic prices is greater than in the past. Unlike other major central banks, the Bank of Japan is raising rates, voting 7-2 to lift its overnight rate target to 0.25 percent from a range of 0.0 to 0.1 percent, citing gradually rising inflation expectations among households and businesses and high but slightly easing uncertainties for the economy. It also warned of upside risks to its GDP and CPI forecasts, specifically pointing out that the impact of currency fluctuations on domestic prices is greater than in the past.
If growth and inflation evolve around the bank's medium-term forecasts provided in its quarterly Outlook Report for July, the bank will "continue raising the policy interest rate and adjust the degree of monetary accommodation." The board left its policy stance steady at the last two meetings after conducting its first rate hike in 17 years in March and ending its yield-curve control framework.
The board decided in a unanimous vote to start reducing the pace of its purchases of Japanese government bonds (JGBs) gradually to around ¥3 trillion in the January-March quarter of 2026 from about ¥6 trillion now. In principle, it will reduce the pace by roughly ¥400 billion every quarter.
BoJ officials are trying to ensure that price increases will be accompanied by sustained wage hikes in coming years. That's why they quote their own estimate for "underlying inflation," which has been slow to rise due to weak services prices which are closely tied to wage growth. Government officials still warned that the economy, despite increases in goods and materials prices, has not completely recovered from decades of deflation.
The BoJ has been under pressure from some politicians to raise rates to help turn around the protracted depreciation of the yen that has kept import costs high, one of many reasons for sluggish voter support for the Kishida administration that has been rocked by the political donation scandal at his ruling party. But for the currency to post a sustained recovery against the dollar, the wide gap in interest rates between the US and Japan must narrow significantly. The dollar hit a 38-year high above ¥161.70 in early July but has since eased to under ¥150.
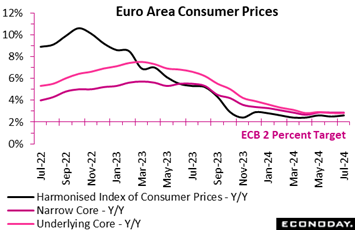 European inflation provisionally accelerated in July. Prices were only flat on the month but this was still strong enough to lift the yearly inflation rate from June's 2.5 percent to 2.6 percent, a couple of ticks above Econoday’s consensus and 0.6 percentage points higher than its medium-term target. European inflation provisionally accelerated in July. Prices were only flat on the month but this was still strong enough to lift the yearly inflation rate from June's 2.5 percent to 2.6 percent, a couple of ticks above Econoday’s consensus and 0.6 percentage points higher than its medium-term target.
The key core rates were slightly better behaved but remain over target. The narrowest measure was again unchanged at 2.9 percent, a tick the consensus, while the measure excluding just energy and unprocessed food was steady at 2.8 percent. Services posted a 0.1 percentage point dip to 4.0 percent, still high but at least a 3-month low, while the non-energy industrial goods rate was a tick firmer at 0.8 percent. Energy (1.3 percent after 0.2 percent) provided a moderate boost but food, alcohol and tobacco (2.3 after 2.4 percent) was broadly stable.
Regionally, headline inflation rose in France (2.6 after 2.5 percent), Germany (also 2.6 after 2.5 percent) and Italy (1.7 after 0.9 percent) but fell again in Spain (2.9 after 3.6 percent).
July’s flash report will leave financial markets guessing about the outcome of the September ECB meeting. Key to the decision will be the core rates, which were again disappointingly high, and services, where inflation has fallen but remains double the target. The flash data for August will probably need to show a softer tone if investors are to be convinced that another cut in interest rates is just around the corner.
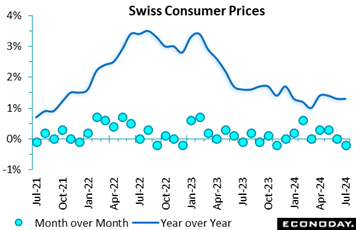 Swiss consumer prices were a little stronger than expected in July. A 0.2 percent decline on the month was shallow enough to leave the annual inflation rate unchanged at 1.3 percent, a tick higher than the consensus. That said, it still matched a four-month low. Swiss consumer prices were a little stronger than expected in July. A 0.2 percent decline on the month was shallow enough to leave the annual inflation rate unchanged at 1.3 percent, a tick higher than the consensus. That said, it still matched a four-month low.
The steady headline rate reflected a 0.2 percent monthly increase in domestic prices that held their yearly rate stable at 2.0 percent but masked a 1.3 percent drop in import prices which reduced their annual change from minus 0.8 percent to minus 1.0 percent.
On the month, clothing and footwear posted a largely seasonal 6.3 percent drop, alone subtracting nearly 0.2 percentage points. Recreation and culture (minus 1.5 percent) and transport (minus 0.8 percent) also saw sizeable declines. On the upside, the steepest increase was in restaurants and hotels (1.3 percent) ahead of food and soft drink (0.9 percent) and alcohol and tobacco (0.5 percent). As a result, core prices were down 0.3 percent versus June, keeping the annual underlying inflation rate flat at just 1.1 percent.
The July update leaves Swiss inflation well within the SNB's definition of price stability. Indeed, with the core rate still so low and the labour market showing signs of cooling, speculation about what would be a third consecutive cut in the central bank's policy rate next month is likely to become all the more intense.
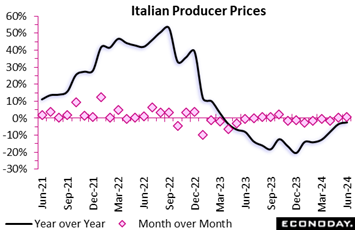 Industrial producer prices in Italy saw a modest June increase of 0.3 percent from the previous month, reflecting consistent growth in both domestic and non-domestic markets. Year over year, prices were down 3.5 percent, driven by a 4.9 percent drop domestically. Industrial producer prices in Italy saw a modest June increase of 0.3 percent from the previous month, reflecting consistent growth in both domestic and non-domestic markets. Year over year, prices were down 3.5 percent, driven by a 4.9 percent drop domestically.
Among manufacturing activities, significant annual declines were observed in metallurgy and metal products by 3.2 percent, while chemicals also declined by 3.4 percent in the domestic market. However, notable annual increases were seen in coke and refined petroleum products by 3.5 percent, while basic pharmaceuticals also rose by 2.7 percent in the domestic market. The price decline in the electricity and gas supply sector remained significant but fell further by 9.4 percent, compared to the steeper fall of 13.5 percent in May.
In the construction sector, prices for residential and non-residential buildings inched up by 0.1 percent monthly but fell by 1.5 percent annually. Prices for roads and railways remained stable month-over-month but declined by 1.4 percent over the year.
Short-term growth, evidenced by a modest 0.3 percent monthly increase in industrial producer prices, indicates some stability and potential resilience in the domestic market. However, the year-over-year decline of 3.5 percent, particularly with a 4.9 percent drop domestically, underscores ongoing challenges and a potential slowdown in domestic economic activity.
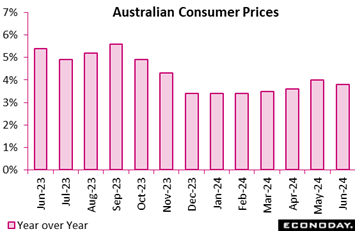 Monthly CPI data show headline inflation in Australia moderated from 4.0 percent in May to 3.8 percent in June, matching the consensus forecast. This decline follows three consecutive increases in headline inflation and takes the level closer to the Reserve Bank of Australia's target range of 2.0 to 3.0 percent. Monthly CPI data show headline inflation in Australia moderated from 4.0 percent in May to 3.8 percent in June, matching the consensus forecast. This decline follows three consecutive increases in headline inflation and takes the level closer to the Reserve Bank of Australia's target range of 2.0 to 3.0 percent.
Lower headline inflation was largely driven by transport costs, with the year-over-year increase in automotive fuel prices falling from 9.3 percent to 6.6 percent. Health costs also moderated, while food price inflation was steady. Other spending categories, however, recorded stronger year-over-year price increases, including clothing and footwear, communications, housing and electricity.
June's data provide mixed signals on underlying price pressures. The measure of inflation that excludes volatile items – including fuel and holiday travel – was unchanged at 4.0 percent in June but the monthly trimmed mean measure fell from 4.4 percent to 4.1 percent.
Despite headline moderation, price pressures remain uncomfortably strong. At the RBA's most recent meeting, held mid-June, officials highlighted uncertainties impacting the inflation outlook and again reiterated that returning inflation to target remains their highest priority. This suggests that a cut in policy rates remains unlikely in upcoming meetings and that officials will again consider a rate increase at their meeting scheduled for the coming week.
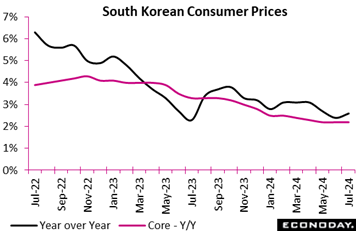 South Korea's headline consumer price index rose 2.6 percent on the year in July after an increase of 2.4 percent in June, moving further above the Bank of Korea's 2.0 percent target. This is the first increase in headline inflation since February. The index rose 0.3 percent on the month after decreasing 0.2 percent previously. The increase in headline inflation was largely driven by transport prices. These rose 1.7 percent on the month after a sharp decline previously, with the year-over-year increase accelerating from 3.8 percent to 5.2 percent. South Korea's headline consumer price index rose 2.6 percent on the year in July after an increase of 2.4 percent in June, moving further above the Bank of Korea's 2.0 percent target. This is the first increase in headline inflation since February. The index rose 0.3 percent on the month after decreasing 0.2 percent previously. The increase in headline inflation was largely driven by transport prices. These rose 1.7 percent on the month after a sharp decline previously, with the year-over-year increase accelerating from 3.8 percent to 5.2 percent.
Underlying price pressures, in contrast, were steady in July. Core CPI, excluding food and energy, rose 2.2 percent on the year for the third consecutive month, and rose 0.3 percent on the month versus no change previously. Core inflation has fallen only slightly from 2.5 percent at the start of the year to its current level. The year-year-over-year increase in prices was relatively steady for most major categories of spending.
At its most recent policy meeting, held last month, the BoK left policy rates on hold. Officials advised then that they had retained their forecast for core inflation to average 2.2 percent this year but noted uncertainties about the inflation outlook and highlighted that "it is necessary to further assess whether inflation will continue its slowing trend".
Although officials concluded that monetary policy should remain restrictive "for a sufficient period of time", they also noted for the first time this cycle that they are open to considering a loosening in policy settings, advising that they "will examine the timing of a rate cut". July's data, however, suggest that their focus will remain on the inflation outlook at their next meeting, scheduled for later this month.
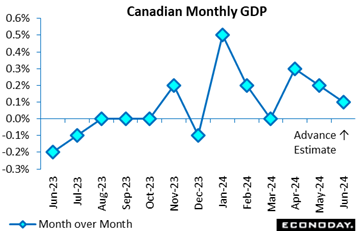 The Canadian economy was up 0.2 percent in May, just above the modest 0.1 percent rise expected in the Econoday survey and Statistics Canada’s 0.1 percent estimate. April was unrevised from the 0.3 percent showing initially reported. Year over year, the economy expanded by 1.1 percent in May. The Canadian economy was up 0.2 percent in May, just above the modest 0.1 percent rise expected in the Econoday survey and Statistics Canada’s 0.1 percent estimate. April was unrevised from the 0.3 percent showing initially reported. Year over year, the economy expanded by 1.1 percent in May.
The advance estimate for June points to an increase of 0.1 percent suggesting that growth remained muted at the end of the second quarter. For the quarter as a whole, Statistics Canada sees 0.5 percent growth.
For May versus April, services were up 0.1 percent while goods-producing industries were up a better 0.4 percent. For April versus March, goods-producing industries were up 0.3 percent and services up 0.4 percent.
In May, 15 of 20 sectors increased on the month. Manufacturing led the way for a second straight month with a gain of 1.0 percent. This is the biggest climb since January 2023 as durable and non-durable manufacturing both showed gains. Non-durables manufacturing jumped by 1.4 percent on the month, its largest since November 2023, propelled by oil and coal products, up 7.3 percent as refineries returned from maintenance shutdowns in April.
On the downside, mining, quarrying and gas extraction retreated by 0.6 percent in May after rising 2.1 percent in April. Oil and gas extraction, down 2.1 percent, accounted for most of the decline, due mostly to maintenance at oil sands facilities in Alberta.
Retail trade was the biggest downer in May with a contraction of 0.9 percent after an uptick of 0.6 percent in April. Most retail subsectors declined, paced by a drop of 2.3 percent in food and beverage stores and 1.4 percent decreases in personal care stores and general merchandise. Wholesale trade also fell back by 0.8 percent in May after a 1.4 percent gain in April.
The public sector rose 0.4 percent in May, its fifth straight gain, after rising 0.2 percent in April.
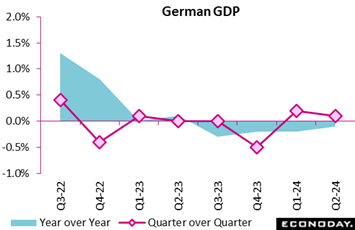 German GDP dipped a quarter-over-quarter 0.1 percent in the second quarter following a modest 0.2 percent rise in the first quarter. Year-over-year, GDP saw a marginal 0.1 percent decline. German GDP dipped a quarter-over-quarter 0.1 percent in the second quarter following a modest 0.2 percent rise in the first quarter. Year-over-year, GDP saw a marginal 0.1 percent decline.
The fall in growth was attributed to a fall in investments in equipment and construction. The earlier growth momentum from the first quarter was not sustained, highlighting vulnerabilities in the economy, particularly as it relates to new investments in the economy.
Despite the slight overall decrease, the performance highlights the fragility of Germany’s economic recovery, underscoring the critical role of investment dynamics in shaping the broader economic landscape.
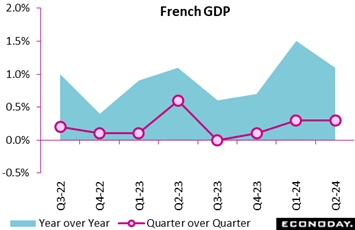 In the second quarter of the year, French GDP maintained its growth trajectory with a steady increase of 0.3 percent, mirroring the growth rate of the previous quarter. Year-over-year, GDP grew by 1.1 percent, albeit at a slightly slower pace compared to the 1.5 percent rise seen in the prior quarter. In the second quarter of the year, French GDP maintained its growth trajectory with a steady increase of 0.3 percent, mirroring the growth rate of the previous quarter. Year-over-year, GDP grew by 1.1 percent, albeit at a slightly slower pace compared to the 1.5 percent rise seen in the prior quarter.
Domestic demand picked up slightly, contributing plus 0.1 percentage points to GDP growth, an improvement from the stagnant first quarter. This uptick was largely due to a modest recovery in gross fixed capital formation, which edged up 0.1 percent following a 0.4 percent decline previously. Household consumption remained stable, showing no change from the previous quarter's slight decrease.
Foreign trade also played a role, contributing 0.2 percentage points to GDP growth. This was supported by stable imports and dynamic export performance, which grew by 0.6 percent following a 0.7 percent rise in the first quarter. Changes in inventories had no impact on GDP growth for the second consecutive quarter.
Overall, French GDP displayed a balanced economic growth pattern, driven by slight improvements in domestic demand and strong export activity.
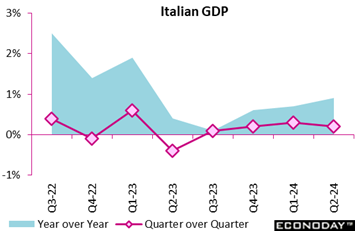 Italy's economy grew by 0.2 percent in the second quarter, marking the fourth consecutive quarter of positive growth after a slight dip in the second quarter of the previous year. This consistent, albeit modest, expansion boosted the year-over-year growth rate to 0.9 percent. Italy's economy grew by 0.2 percent in the second quarter, marking the fourth consecutive quarter of positive growth after a slight dip in the second quarter of the previous year. This consistent, albeit modest, expansion boosted the year-over-year growth rate to 0.9 percent.
This provisional estimate is largely fueled by the robust services sector, which significantly contributed to GDP growth. Conversely, the agriculture, forestry, fishing, and industrial sectors posted negative contributions, highlighting sectoral disparities. On the demand side, domestic consumption, including inventories, positively impacted GDP, while the net foreign component had a negative effect.
The data underscore a cautiously optimistic economic outlook, driven primarily by domestic demand and resilience in the services sector. The mixed performance across sectors emphasizes the need to strengthen weaker sectors, particularly agriculture and industry while leveraging the resilience of the services sector. Fostering balanced growth across all sectors is crucial for maintaining and enhancing Italy's economic stability and expansion.
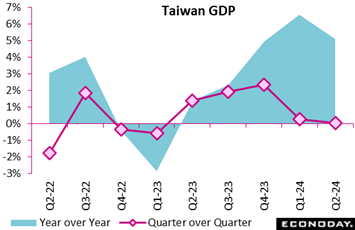 Advance estimates for Taiwan GDP show the economy stagnated in the three months of June, increasing just 0.03 percent on the quarter after an increase of 0.27 percent in the three months to March. Advance estimates for Taiwan GDP show the economy stagnated in the three months of June, increasing just 0.03 percent on the quarter after an increase of 0.27 percent in the three months to March.
GDP growth also slowed in year-over-year terms, increasing 5.09 percent in the three months to June after growth of 6.56 percent in the three months to March. This slowdown was largely driven by weaker growth in exports and a surge in imports, resulting in a sharply weaker contribution of net exports to headline GDP growth. The contribution to growth from domestic demand, in contrast, picked up, with growth in consumer spending slowing but investment spending rebounding from a previous decline to a strong increase.
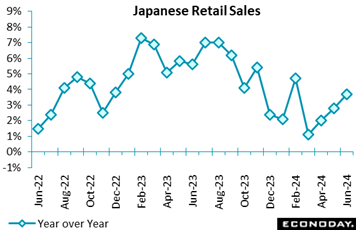 Japanese retail sales rose 3.7 percent on year in June, above the consensus call of a 3.0 percent rise, with the pace of increase accelerating from a 2.8 percent gain in May as the lingering heat wave boosted demand for air conditioners and other seasonal goods. Strong inbound spending and high demand for luxury brand goods continued to drive department store sales higher. Resumed vehicle production in March after two months of suspension over a safety scandal led to smoother deliveries and thus a smaller decline in auto sales. Japanese retail sales rose 3.7 percent on year in June, above the consensus call of a 3.0 percent rise, with the pace of increase accelerating from a 2.8 percent gain in May as the lingering heat wave boosted demand for air conditioners and other seasonal goods. Strong inbound spending and high demand for luxury brand goods continued to drive department store sales higher. Resumed vehicle production in March after two months of suspension over a safety scandal led to smoother deliveries and thus a smaller decline in auto sales.
On the month, retail sales rose a seasonally adjusted 0.6 percent on solid department store sales, strong demand for summer clothing and a second straight monthly rise in auto sales. Those factors more than offset lower sales of fuels and drugs/cosmetics. It was the third consecutive increase following a 1.1 percent gain in May and a 0.8 percent rebound in April.
The government upgraded its assessment for the second month in a row, saying retail sales are "on an uptrend." Last month it said they were "on a gradual uptrend" in what was the first upgrade in 15 months. Previously, sales were "taking one step forward and one step back."
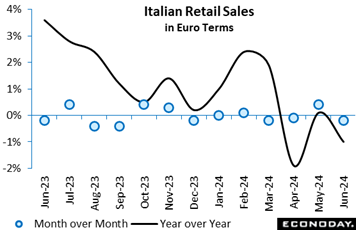 Italian retail trade dipped slightly in June compared to May, with the seasonally adjusted index decreasing by 0.2 percent in both value and volume from the previous month. This decline reflects a cautious consumer environment, balancing modest gains in some areas against broader market challenges. Italian retail trade dipped slightly in June compared to May, with the seasonally adjusted index decreasing by 0.2 percent in both value and volume from the previous month. This decline reflects a cautious consumer environment, balancing modest gains in some areas against broader market challenges.
Year-over-year, retail sales painted a more concerning picture as the value of retail trade dropped by 1.0 percent, and volume fell more sharply by 1.8 percent. Large-scale retailers managed a 0.5 percent increase, but small-scale outlets were not as fortunate, experiencing a 2.0 percent decline. Non-store retail sales suffered significantly, with sales plummeting by 4.2 percent, while online sales continued their downward trend for the second month, contracting by 3.9 percent compared to a year earlier.
A closer look at non-food product sales reveals mixed performance. Cosmetics and toiletries enjoyed a 3.3 percent boost, and optical instruments and photographic equipment saw a 2.5 percent rise. In contrast, shoes, leather goods, and travel items were hit hardest, dropping by 5.1 percent, followed closely by furniture and household furnishings, which fell by 5.0 percent.
This suggests that consumer preferences may be transitioning towards essential and wellness-related purchases, while discretionary spending on items such as home furnishings and travel products is tightening.
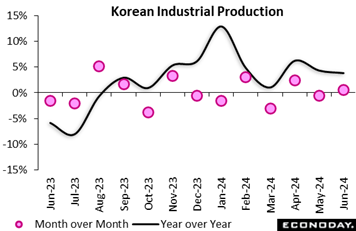 South Korea's index of industrial production rose 0.5 percent on the month in June after falling 0.6 percent in May, while year-over-year growth slowed from 4.3 percent to 3.8 percent. Within the industrial sector, manufacturing output rose 0.6 percent on the month after a previous decline of 0.6 percent, with year-over-year growth moderating from 4.4 percent to 3.9 percent. South Korea's index of industrial production rose 0.5 percent on the month in June after falling 0.6 percent in May, while year-over-year growth slowed from 4.3 percent to 3.8 percent. Within the industrial sector, manufacturing output rose 0.6 percent on the month after a previous decline of 0.6 percent, with year-over-year growth moderating from 4.4 percent to 3.9 percent.
Activity was mixed in other sectors. Service sector output rose 0.2 percent on the month in June after falling 0.8 percent in May, while construction sector activity contracted at a less pronounced rate, down 0.3 percent after a previous drop of 4.4 percent. Output in the public administration sector weakened sharply with a fall of 5.1 percent after a previous increase of 2.0 percent. Aggregating across all sectors, output fell 0.1 percent on the month after a previous decline of 0.8 percent, with year-over-year growth slowing from 2.3 percent to 0.5 percent.
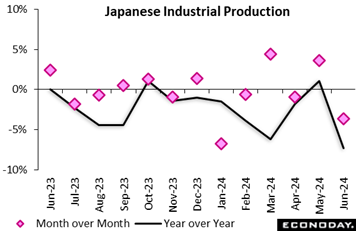 Japan's industrial production slipped a seasonally adjusted 3.6 percent on the month in June, reversing all of the 3.6 percent rebound in May but still beating expectations for a 4.9 percent decline. Production in June was hit by more revelations of false safety testing, this time at Toyota Motor itself, instead of its subsidiaries, as well as at other major automakers. June was also pulled down by lower output of production machinery (chip equipment and excavators) and general machinery such as conveyors and turbines. Japan's industrial production slipped a seasonally adjusted 3.6 percent on the month in June, reversing all of the 3.6 percent rebound in May but still beating expectations for a 4.9 percent decline. Production in June was hit by more revelations of false safety testing, this time at Toyota Motor itself, instead of its subsidiaries, as well as at other major automakers. June was also pulled down by lower output of production machinery (chip equipment and excavators) and general machinery such as conveyors and turbines.
From a year earlier, factory output slipped back 7.3 percent after rising a solid 1.1 percent in May for the first increase in seven months. On the quarter, production rose 2.9 percent in the April-June period after plunging 5.2 percent in January-March on earlier safety scandals.
The government’s survey of producers indicates that output is expected to rise 4.0 percent in July led by a rebound in production machinery and electronic parts/devices, before rising a further 0.7 percent in August on higher output of telecom equipment which may include lithium-ion rechargeable batteries.
Shipments of capital goods excluding transport equipment -- a key indicator of business investment in equipment in GDP data -- rose 0.5 percent on quarter in April-June after slipping 2.0 percent in January-March. This indicates a possible rebound in business equipment, which fell 0.4 percent on quarter in January-March in payback for a sharp 2.0 percent rebound in October-December. Capex made a negative 0.1-point contribution to first-quarter GDP after providing a positive 0.3-point contribution the previous quarter.
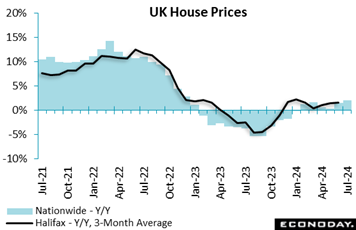 House prices in the UK rose for a third straight month in July. A 0.3 percent monthly advance was again a little stronger than expected and, following an unrevised 0.2 percent increase in June, lifted the yearly inflation rate from 1.5 percent to 2.1 percent, its highest mark since December 2022. However, prices are still 28 percent below the all-time peak recorded in summer 2022. House prices in the UK rose for a third straight month in July. A 0.3 percent monthly advance was again a little stronger than expected and, following an unrevised 0.2 percent increase in June, lifted the yearly inflation rate from 1.5 percent to 2.1 percent, its highest mark since December 2022. However, prices are still 28 percent below the all-time peak recorded in summer 2022.
The 3-monthly change also accelerated for the first time since March, suggesting a modest strengthening in the underlying trend. At 0.4 percent, the rate was up from 0.1 percent in the second quarter and has been above zero every month since October last year. Market activity remains relatively subdued, albeit still respectable given the high cost of mortgage borrowing. Yet given the Bank of England’s rate cut this month and perhaps a further cut later this year, affordability should gradually improve. That said, Nationwide only sees house prices broadly flat over the rest of 2024. Note that Halifax data (black line in accompanying graph) will be posted in the coming week.
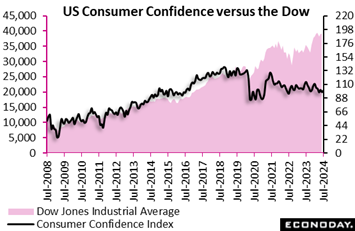 Consumer confidence did come in nearly a point higher than expected, at 100.3 in July, but the level remains subdued if not depressed with June revised 2.6 points lower to 97.8. Consumer confidence did come in nearly a point higher than expected, at 100.3 in July, but the level remains subdued if not depressed with June revised 2.6 points lower to 97.8.
The assessment of July's jobs market was less favorable than June: jobs were described as hard to get by 16.0 percent of the sample, which was up 0.3 percentage points, while jobs plentiful were down 1.4 points to 34.1 percent. These results, released on Tuesday, largely foreshadowed the moderation seen in Friday’s employment report.
On the plus side, the assessment of the jobs market six months from now was actually higher: “more jobs” up 1.4 points to 14.5 percent, “fewer jobs” down 1.6 points to 16.7 percent. Expectations for future income were mixed with fewer seeing an increase (15.6 vs 16.2 percent) but fewer also seeing a decrease (11.6 vs 12.3 percent).
Future buying plans, however, weakened across the board especially for homes, to a noticeably low 4.2 percent of the sample expecting to buy a house in the next six months versus 5.1 percent in June. High home prices along with still high mortgage rates are at play.
Year-ahead rate expectations were declining with fewer seeing higher rates and more seeing lower rates. The bulls-and-bears split on the stock market is little changed with the former ahead of the latter by more than two to one, 49.1 vs 23.5 percent.
Though July's readings on the whole were generally more favorable than June, the gist of this report is flat at best. July's 100.3 reading is more than 10 points lower than it was in January this year (110.9) and is 25 points lower than July 2021 (125.1).
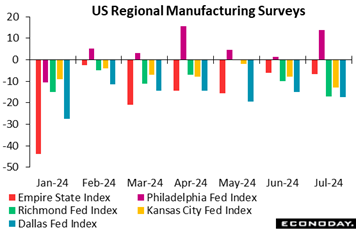 The Dallas Fed’s manufacturing index sank a bit further into contraction in July, falling 2.4 points to minus 17.5 which was 4 points below Econoday’s consensus. This index has been stuck in uninterrupted and often deep contraction since spring 2022. The production index, slipping from June’s plus 0.7 to minus 1.3 in July, extended its up-and-down performance, mostly in a narrow range around zero. The Dallas Fed’s manufacturing index sank a bit further into contraction in July, falling 2.4 points to minus 17.5 which was 4 points below Econoday’s consensus. This index has been stuck in uninterrupted and often deep contraction since spring 2022. The production index, slipping from June’s plus 0.7 to minus 1.3 in July, extended its up-and-down performance, mostly in a narrow range around zero.
More urgently for the outlook, new orders fell 12 points to minus 12.8 signaling what the report describes as a “pullback in demand” that will have forecasters lowering their estimates for Dallas’s next report. The company outlook dropped a full 12 points to minus 18.4 while the outlook uncertainty index shot up to 30.7 for its highest reading since fall 2022 and consistent with the turbulent events unfolding in the presidential election.
However uncertain they feel, respondents were nevertheless hiring last month as employment jumped 10 points to 7.1, a moderate level but the best in 10 months. Price pressures were steady, little changed at 21.2 for wages and benefits and likewise for raw materials at 23.1. Yet lack of pricing power is indicated by an 11 point drop in finished goods prices to 3.4.
The Dallas index rounded out a mostly negative month for the regional Fed surveys: Empire State minus 6.6, Richmond Fed minus 17, Kansas City minus 13, with only the Philadelphia Fed index in positive ground at 13.9. The mix here roughly mirrors the mix in other manufacturing data including June’s 3.3 percent fall in factory orders that were hit by aircraft cancellations that overshadowed a badly needed bounce for capital goods.
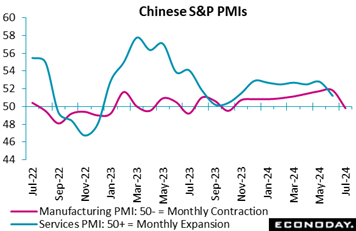 S&P’s manufacturing PMI showed renewed contraction after eight months of expansion, with the headline index falling sharply to a flat 49.8 from 51.8 in July. This was below expectations for 51.5 and the lowest level since October 2023. Official CFLP survey data published earlier in the week were likewise consistent with stagnant conditions. S&P’s manufacturing PMI showed renewed contraction after eight months of expansion, with the headline index falling sharply to a flat 49.8 from 51.8 in July. This was below expectations for 51.5 and the lowest level since October 2023. Official CFLP survey data published earlier in the week were likewise consistent with stagnant conditions.
Respondents reported output grew at the slowest pace in nine months, new orders fell for the first time in a year, and new export orders rose at a less pronounced pace. Payrolls were reported to have fallen slightly in July but the survey's measure of business confidence rose after it had dropped in June to its lowest level in more than two years. The survey also showed price pressures moderated, with its measure of growth in input costs slowing and selling costs reported to have been cut for the first time since May. Note that PMI services (blue line in graph) will be posted in the coming week.
Econoday’s Relative Performance Index (RPI) for global indicators ends the week at minus 5 and at minus 7 less inflation (RPI-P). These readings are close to the zero line to indicate that, on net, data are coming in near enough to the consensus estimates but toward the lower end of consensus ranges.
The much softer-than-expected payrolls report, together with recent weakness in many factory reports, has pulled the US into tangibly negative territory, at minus 30 for the RPI and minus 31 for the RPI-P. These scores are some of the lowest of the year and posted against already moderating forecasts; if extended in the coming weeks, such underperformance would build increasing pressure on the Federal Reserve, presidential election or not, to finally cut rates at their September 17-18 meeting.
Muted albeit slightly stronger-than-expected GDP growth in Canada was not been enough to lift the either the RPI (minus 16) or RPI-P (minus 4) back above zero. In the main, economic activity continues to disappoint leaving speculators contemplating what would be a third consecutive Bank of Canada rate cut next month.
In the Eurozone, an RPI of 11 shows recent overall economic activity running just marginally ahead of market forecasts. However, with the RPI-P at minus 3, upside surprises remain restricted to prices making another ECB ease in September far from guaranteed.
In the UK, the recent bias towards economic underperformance extended into another week, leaving both the RPI (minus 16) and RPI-P (minus 23) closing out the week quite well below zero. Underlying inflation may still be worryingly high but the disappointingly soft performance by the real economy helps to justify last week’s split decision by the Bank of England to cut Bank Rate by 25 basis points.
In Switzerland, economic news similarly continues to surprise on the downside. At minus 23 and minus 19, current readings on the RPI and RPI-P will do nothing to undermine speculation that the Swiss National Bank will be cutting interest rates again next month.
The Bank of Japan’s rate hike came a little ahead of most market calls. However, with the RPI (24) and, in particular, the RPI-P (53) showing economic activity running well ahead of forecasts, the move should not have been a major surprise.
In China, both the RPI and RPI-P finished the week at exactly zero. However, even if overall economic activity is now matching market forecasts, those expectations were only soft to start with. For investors, the speed of recovery remains worryingly sluggish.
**Contributing to this article were Jeremy Hawkins, Brian Jackson, Mace News, Max Sato, Olajide Oyadeyi, and Theresa Sheehan
The Reserve Bank of Australia is expected to hold policy steady on Tuesday for a sixth straight meeting as is the Reserve Bank of India on Thursday for a ninth straight meeting. Both banks continue to face above-target inflation.
Chinese merchandise trade estimated for release on Wednesday is expected to show a steady and prodigious surplus with a strong rise for exports.
German manufacturing orders on Tuesday and industrial production on Wednesday are both expected to rebound from prior declines. Eurozone retail sales on Tuesday are seen flat.
A moderate rebound for Canadian employment with, however, an uptick in the unemployment rate is expected for Friday.
China: S&P PMI Composite for July (Mon 0945 CST; Mon 0145 GMT; Sun 2145 EDT)
Services Index, Consensus Forecast: 51.5
S&P's services PMI in July is expected to edge higher to 51.5 versus June’s much lower-than-expected 51.2 that compared with May’s 54.0.
Indian PMI Services for July (Mon 1030 IST; Mon 0500 GMT; Mon 0100 EDT)
Consensus Forecast, Year over Year: 61.1
July’s services PMI is expected to rise further to 61.1 versus June’s very hot 60.5 and May’s nearly as hot 60.2.
Eurozone PPI for June (Mon 1100 CEST; Mon 1000 GMT; Mon 0500 EDT)
Consensus Forecast, Month over Month: 0.4%
Consensus Forecast, Year over Year: -3.5%
Producer prices have shown sustained weakness and are expected to fall 3.5 percent on the year in June which would compare with 4.2 percent contraction in May. The monthly showing, at a consensus gain of 0.4 percent in June, fell 0.2 percent in May which was a seventh straight decline.
Japanese Household Spending for June (Tue 0830 JST; Mon 2330 GMT; Mon 1930 EDT)
Consensus Forecast , Month over Month: 0.3%
Consensus Forecast , Year over Year: -1.0%
Real household spending in June is expected to decline 1.0 percent on the year versus a 1.8 percent decline in May that was well below expectations. A late start to the rainy season in many regions and hot weather boosted demand for air conditioners, beverages and summer clothing.
Reserve Bank of Australia Announcement (Tue 1430 AEST; Tue 0430 GMT; Tue 0030 EDT)
Consensus Forecast, Change: 0 basis points
Consensus Forecast, Level: 4.35%
The Reserve Bank of Australia kept its policy rate steady at 4.35 percent at its June meeting, warning that inflation was high and the labor market very strong. Both are still true. The RBA is expected to hold steady once again.
German Manufacturing Orders for June (Tue 0800 CEST; Tue 0600 GMT; Tue 0200 EDT)
Consensus Forecast, Month over Month: 1.0%
Manufacturing orders are expected to increase a monthly 1.0 percent in June versus May’s unexpected 1.6 percent decline, which was the fifth dip in a row and the fifth month in a row to miss the consensus estimate.
Eurozone Retail Sales for June (Tue 1100 CEST; Tue 0900 GMT; Tue 0500 EDT)
Consensus Forecast, Month over Month: 0.1%
Consensus Forecast, Year over Year: 0.2%
Retail sales volumes in June are expected to edge 0.1 percent higher on the month to match May’s very sluggish 0.1 percent showing.
Canada Merchandise Trade Balance for June (Tue 0830 EDT; Tue 1230 GMT)
Consensus Forecast: -C$1.9 billion
June’s trade balance is seen in deficit of C$1.9 billion which would match May’s deficit of C$1.9 billion and compare with April’s deficit of C$1.3 billion.
Chinese Merchandise Trade Balance for July (Estimated for Wednesday, release time not set)
Consensus Forecast: US$99.1 billion
Consensus Forecast: Exports - Y/Y: 8.8%
China's trade surplus is expected to hold steady at US$99.1 billion in July. June’s report showed a strong 8.6 percent rise in annual exports with July’s growth rate seen at 8.8 percent.
New Zealand Second-Quarter Employment (Wed 1045 NZST; Tue 2245 GMT; Tue 1845 EDT)
Consensus Forecast, Quarter over Quarter: -0.3%
Consensus Forecast, Year over Year: 0.0%
Consensus Forecast, Unemployment Rate: 4.7%
Employment is expected to fall a quarterly 0.3 percent in the second quarter following a 0.2 percent fall in the first quarter. The unemployment rate is expected to rise sharply to 4.7 from 4.3 percent.
German Industrial Production for June (Wed 0800 CEST; Wed 0600 GMT; Wed 0200 EDT)
Consensus Forecast, Month over Month: 1.0%
Consensus Forecast, Year over Year: -3.8%
Industrial production in June is expected to rise 1.0 percent on the month after falling a sharp 2.5 percent in May. Year-over-year contraction is seen narrowing to 3.8 percent versus May’s deep contraction of 6.7 percent.
German Merchandise Trade for June (Wed 0800 CEST; Wed 0700 GMT; Wed 0200 EDT)
Consensus Forecast, Balance: +€23.5 billion
June’s goods balance is expected to narrow to a €23.5 billion surplus versus a larger-than-expected surplus of €24.9 billion in May.
Reserve Bank of India Announcement (Thu 0430 GMT; Thu 1000 IST; Thu 0030 EDT)
Consensus Change: 0 basis points
Consensus Level: 6.50%
Despite above-target inflation and robust economic growth, the Reserve Bank of India has left policy unchanged since February last year. Expectations for August are no change.
Chinese CPI for July (Fri 0930 CST; Fri 0130 GMT; Thu 2130 EDT)
Consensus Forecast, Year over Year: 0.3%
July’s year-over-year rate is expected to remain nearly dead flat at 0.3 percent versus June’s 0.2 percent rate. China’s CPI last peaked in January last year at 2.1 percent.
Chinese PPI for July (Fri 0930 CST; Fri 0130 GMT; Thu 2130 EDT)
Consensus Forecast, Year over Year: 0.9%
Producer prices have been in long annual contraction. July’s consensus is minus 0.9 percent on the year versus June contraction of 0.8 percent.
Canadian Labour Force Survey for July (Fri 0830 EDT; Fri 1230 GMT)
Consensus Forecast: Employment Change: 15,000
Consensus Forecast: Unemployment Rate: 6.5%
Employment in July is expected to rise 15,000 versus June’s flat 1,400 decline. July’s unemployment rate is expected to rise to 6.5 percent versus June’s 6.4 percent which was noticeably up from May’s 6.2 percent.
|
