|
Tumbling on Monday, markets reacted in delayed fashion to the prior Friday’s slowing in US payrolls. Will there be any delay in the Federal Reserve’s reaction? Or is a September rate cut a foregone conclusion? There will be plenty of economic reports to mull between now and the next FOMC announcement, underscored in the latest week by favorable jobless claims data not to mention consumer prices in the coming week which if proving sticky could have the markets thinking twice about a pre-election rate cut. Let’s look at monetary policy first where two central banks, both concerned about inflation, held policy steady in the week.
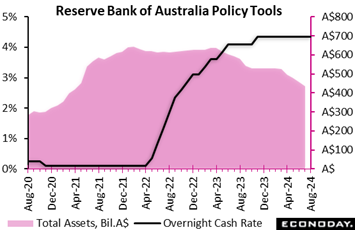 The Reserve Bank of Australia left its main policy rate, the cash rate, unchanged at 4.35 percent in line with the consensus forecast. Officials increased this rate by 25 basis points in November 2023 but have since left it unchanged. Over this period, officials have noted that previous policy tightening should help return inflation to within their target range of two percent to three percent over the forecast period. The Reserve Bank of Australia left its main policy rate, the cash rate, unchanged at 4.35 percent in line with the consensus forecast. Officials increased this rate by 25 basis points in November 2023 but have since left it unchanged. Over this period, officials have noted that previous policy tightening should help return inflation to within their target range of two percent to three percent over the forecast period.
In their announcement, however, officials expressed concern about recent inflation data, with the monthly CPI increasing from 3.6 percent in April to 4.0 percent in May before easing again to 3.8 percent in June. Officials noted that inflation is falling more slowly than they had previously anticipated and they reiterated concerns about risks to the outlook. In their quarterly forecasts, officials revised their medium-term inflation outlook significantly higher, to 3.7 percent for the end of 2025 from their previous forecast of 2.8 percent.
Although officials left policy on hold, they reiterated that returning inflation to target remains their highest priority. Speaking after the decision, RBA Governor Michele Bullock advised that officials had considered raising rates but did not consider cutting rates. Bullock also advised that she currently does not expect policy will be loosened in coming months. The RBA's next meeting is scheduled for late September.
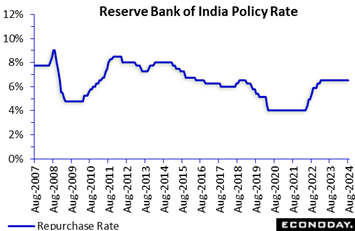 The Reserve Bank of India left its benchmark repurchase rate unchanged at 6.50 percent, as was expected. This rate has now been on hold since February 2023 after it was earlier increased by a cumulative 250 basis points beginning in mid-2022. The Reserve Bank of India left its benchmark repurchase rate unchanged at 6.50 percent, as was expected. This rate has now been on hold since February 2023 after it was earlier increased by a cumulative 250 basis points beginning in mid-2022.
Data released since the RBI's previous meeting un early June have shown headline CPI inflation picking up from 4.83 percent in May to 5.08 percent in June, further above the mid-point of the RBI's target range of two percent to six percent. Recent activity data, meanwhile, have generally shown ongoing strength in economic conditions.
In their policy statement, RBI officials advised that they expect base effects will send inflation higher in the near-term and note that the path of disinflation towards the midpoint of their target range will depend heavily on the potential impact of weather events on food prices. They also again stressed the importance of ensuring that any increase in food prices is contained and does not put upward pressure on underlying inflation and inflation expectations. Officials remain confident in the resilience of economic activity.
Reflecting this assessment, it remains clear that the focus for officials remains on bringing inflation to 4.0 percent, the midpoint of their target range, and keeping it around that level. Officials advise that they are still focused on the "withdrawal of accommodation" and repeated their earlier pledge to maintain their "disinflationary stance" until "a durable alignment of the headline CPI inflation with the target is achieved".
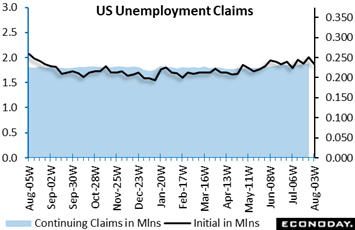 US initial jobless claims fell 17,000 to 233,000 in the August 3 week, unwinding the increase of 15,0000 to 250,000 in the prior week and coming in below Econoday’s the consensus for 240,000. Since late June, levels have been alternating between up and down weeks. The underlying trend seems to be around 230,000 to 235,000 which is consistent with a healthy labor market and more balanced supply and demand. US initial jobless claims fell 17,000 to 233,000 in the August 3 week, unwinding the increase of 15,0000 to 250,000 in the prior week and coming in below Econoday’s the consensus for 240,000. Since late June, levels have been alternating between up and down weeks. The underlying trend seems to be around 230,000 to 235,000 which is consistent with a healthy labor market and more balanced supply and demand.
The insured rate of unemployment remained at 1.2 percent in data for the July 27 week where it has been since March 2023. For workers eligible for unemployment benefits, unemployment remains very low. The level of insured unemployment is essentially unchanged in the July 27 week at up 6,000 to 1.875 million from 1.869 million in the prior week. This is not far from the four-week moving average of 1.862 million. While levels are more elevated than they were this time last year, they’re in line with a labor market able to absorb laid-off workers after relatively short periods of unemployment.
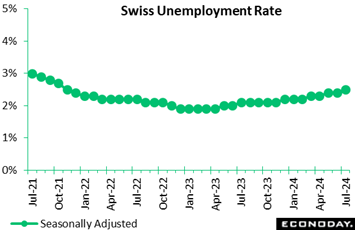 In line with expectations, Switzerland’s labour market continued to cool in July. Seasonally adjusted joblessness rose 2,436 or 2.2 percent on the month to 112,48, lifting the unemployment rate by a tick to 2.5 percent. This matched both the market consensus and its highest level since October 2021. Unadjusted, the number of people out of work climbed 3,198 or 3.1 percent to 107,716, but this again left the rate steady at 2.3 percent and 0.4 percentage points above its mark a year ago. In line with expectations, Switzerland’s labour market continued to cool in July. Seasonally adjusted joblessness rose 2,436 or 2.2 percent on the month to 112,48, lifting the unemployment rate by a tick to 2.5 percent. This matched both the market consensus and its highest level since October 2021. Unadjusted, the number of people out of work climbed 3,198 or 3.1 percent to 107,716, but this again left the rate steady at 2.3 percent and 0.4 percentage points above its mark a year ago.
Meantime, seasonally adjusted vacancies fell a further 2,402 or 6.5 percent on the month to 34,828, equating with a yearly drop of 25.5 percent versus 23.5 percent last time.
The July update leaves intact the trend deterioration in the labour market that began at the start of last year. Accordingly, the data should increase the chances of another interest rate cut from the Swiss National Bank next month -- especially with the Swiss franc having strengthened significantly in the wake of the week’s turmoil in global financial markets.
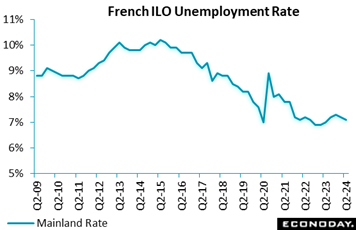 France witnessed a notable improvement in its labour market in the second quarter as the number of unemployed people dropped by 40,000, reducing the unemployment rate from 7.2 to 7.1 percent, near its historic low and significantly below the 2015 peak at 10.2 percent. This marks a stabilizing yet fragile recovery, given that the rate remains 1 tenth higher than a year ago. France witnessed a notable improvement in its labour market in the second quarter as the number of unemployed people dropped by 40,000, reducing the unemployment rate from 7.2 to 7.1 percent, near its historic low and significantly below the 2015 peak at 10.2 percent. This marks a stabilizing yet fragile recovery, given that the rate remains 1 tenth higher than a year ago.
Long-term unemployment also saw a decline, with 11,000 fewer people being jobless for over a year, reducing this rate to 1.7 percent. This improvement indicates gradual but consistent progress toward reducing entrenched unemployment.
The employment landscape showed mixed results across age groups. While the overall employment rate climbed to a record 69.0 percent, younger workers aged 15-24 experienced little change. However, the employment rate among older workers aged 50-64 surged to its highest level since 1975, while a slight uptick in employment among the core group aged 25-49 underscores steady yet modest growth.
Overall, France's labour market is showing signs of resilience, with historical highs in employment rates and a cautious decline in unemployment.
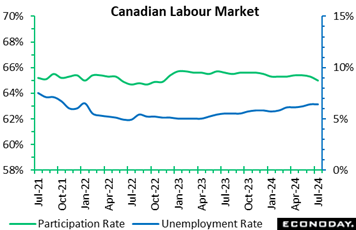 Employment in Canada dipped by 2,800 in July to miss Econoday's consensus for a 15,000 gain. The prior 1,400 dip in June was also unexpected Unemployment in July held steady at June’s 6.4 percent rate but was up from 6.2 percent in May. On a year-over-year basis, the unemployment rate was up nearly a full percentage point. Underscoring the weakness was another dip in the participation rate to 65.0 percent in July from 65.3 percent in June. Employment in Canada dipped by 2,800 in July to miss Econoday's consensus for a 15,000 gain. The prior 1,400 dip in June was also unexpected Unemployment in July held steady at June’s 6.4 percent rate but was up from 6.2 percent in May. On a year-over-year basis, the unemployment rate was up nearly a full percentage point. Underscoring the weakness was another dip in the participation rate to 65.0 percent in July from 65.3 percent in June.
On the positive side, total hours worked rose by 1.0 percent in July from June and were up 1.9 percent from a year ago. Average hourly wages cooled a bit to an annual 5.2 percent increase in July from 5.4 percent in June.
The July employment picture reflected an increase of 62,000 in full-time work, offset by a decline of 64,000 in part-time employment. The private sector remained anemic with employment down 42,000 in July after being nearly flat for the prior two months. Private sector jobs were up 0.6 percent or 86,000 from a year ago. Thank goodness for public sector employment, which rose by 41,000 or 0.6 percent in July and up 205,000 or 4.8 percent from a year ago.
By sector, employment in wholesale and retail trade fell 44,000, and finance, insurance and real estate lost 15,000 jobs. Employment rose 20,000 in public administration and gained 15,000 in transportation and warehousing.
Statistics Canada said the rate of employment in both the US and Canada has trended down over the past 12 months, but it's been slightly worse in Canada. From July 2023 to July 2024, the employment rate (adjusted to US measurement concepts) fell by 1.0 percentage point to 61.5 percent in Canada, while it declined by 0.4 percentage point to 60.0 percent in the US.
July’s soggy employment report is likely to reinforce sentiment expressed by the Bank of Canada when it announced its second straight rate cut last month. The governing council observed that downside risks have increased and that faster growth may be needed to hold inflation within its target range.
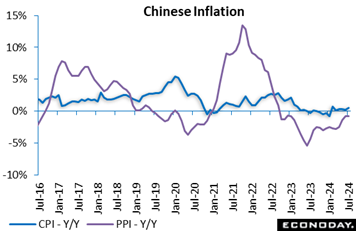 China's headline consumer price index rose 0.5 percent on the year in July, picking up from the 0.2 increase recorded in June. The index also rose 0.5 percent on the month after falling 0.2 percent previously. July's data were stronger than the consensus forecast for a year-over-year increase of 0.3 percent. China's headline consumer price index rose 0.5 percent on the year in July, picking up from the 0.2 increase recorded in June. The index also rose 0.5 percent on the month after falling 0.2 percent previously. July's data were stronger than the consensus forecast for a year-over-year increase of 0.3 percent.
Producer prices, meanwhile, fell 0.8 percent on the year in July, right in line with expectations for 0.9 percent and matching June’s rate of contraction.. PPI inflation has been in negative territory since late 2022 but this is the smallest year-over-year decline in the index since January 2023. On the month, producer prices fell 0.2 percent, also matching June’s rate.
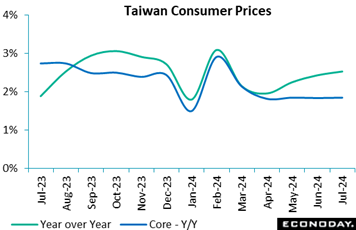 Taiwan's headline consumer price index rose 0.19 percent on the month in July after an increase of 0.31 percent in June, with the year-over-year increase increasing from 2.42 percent to 2.52 percent. Vegetable prices rose strongly on the month after extreme weather events. Core CPI, which excludes fruits, vegetables, and energy prices, rose 0.12 percent on the month in July after falling 0.01 percent in June, with the year-over-year increase up slightly from 1.83 percent to 1.84 percent. Taiwan's headline consumer price index rose 0.19 percent on the month in July after an increase of 0.31 percent in June, with the year-over-year increase increasing from 2.42 percent to 2.52 percent. Vegetable prices rose strongly on the month after extreme weather events. Core CPI, which excludes fruits, vegetables, and energy prices, rose 0.12 percent on the month in July after falling 0.01 percent in June, with the year-over-year increase up slightly from 1.83 percent to 1.84 percent.
The Central Bank of the Republic of China (Taiwan) left its main policy rate unchanged at 2.00 percent at its quarterly policy meeting in mid-June. This followed an increase at its previous meeting in March which took the rate to its highest level since 2008. Forecasts published at the June meeting showed that officials were more confident that price pressures would moderate in the near-term, with their forecast for annual headline inflation in 2024 revised down from 2.49 percent to 2.12 percent and their forecast for annual core inflation revised down from 2.58 percent to 2.00 percent.
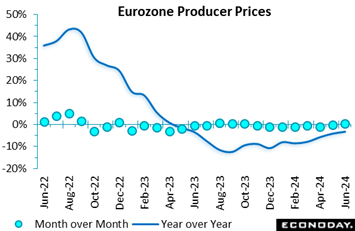 Producer prices in the Eurozone rose in June for the first time since last October. Following a 0.2 percent monthly drop in May, the headline index climbed fully 0.5 percent, a tick above the market consensus and matching its steepest gain since August 2023. Annual inflation increased from minus 4.1 percent to minus 3.2 percent, its least negative reading since June 2023. Producer prices in the Eurozone rose in June for the first time since last October. Following a 0.2 percent monthly drop in May, the headline index climbed fully 0.5 percent, a tick above the market consensus and matching its steepest gain since August 2023. Annual inflation increased from minus 4.1 percent to minus 3.2 percent, its least negative reading since June 2023.
However, much of the work was done by energy where prices were up a monthly 1.6 percent. Excluding this category, the PPI was again just 0.1 percent firmer, leaving the yearly core rate still sub-zero, albeit only just, at minus 0.1 percent after minus 0.4 percent. Intermediates as well as capital goods and consumer non-durables were up just 0.1 percent versus May while consumer durables were only flat.
The June data mean that the core PPI has now risen for six consecutive months. Prices are still marginally weaker on the year but recent developments are consistent with a Eurozone manufacturing sector that, while still soft, is at least over the worst. That said pipeline inflation pressures in the sector remain too limited to worry the ECB.
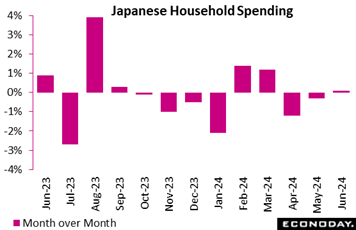 Japan's real household spending posted its second straight year-over-year drop in June, down 1.4 percent, but excluding volatile factors like home maintenance and car purchases, the core reading marked its first increase in 16 months, up 1.3 percent, as the killer heat wave boosted demand for air conditioners and refrigerators. Japan's real household spending posted its second straight year-over-year drop in June, down 1.4 percent, but excluding volatile factors like home maintenance and car purchases, the core reading marked its first increase in 16 months, up 1.3 percent, as the killer heat wave boosted demand for air conditioners and refrigerators.
An unusually late start to the rainy season in many regions also propped up demand for beverages, snacks, eating out and summer clothing. The rare rise in the core measure of real average household spending (excluding housing, motor vehicles and remittance), a key indicator used in GDP calculation, followed a 3.4 percent dip in May and no growth in April.
The overall spending drop was larger than the median forecast of a 1.0 percent fall and followed an unexpected 1.8 percent slump in May. The decrease in June was led by lower spending on home maintenance and repairs, which fluctuate from month to month, but it was also due to the widespread move among cell phone users to switch to discount plans. Amid elevated costs, households have also trimmed discretionary spending, such as on hotels and transportation. They are also being crowded out by an influx of tourists from other countries who have higher purchasing power as the yen continued to slide until recently.
Compared to the previous month, real average expenditures by households with two or more people rose a seasonally adjusted 0.1 percent for the first rise in three months, after dipping 0.3 percent in May and slumping 1.2 percent in April. It was weaker than the median forecast of a 0.3 percent rise and came at the bottom of the forecasts that ranged from 0.1 percent to 1.0 percent gains.
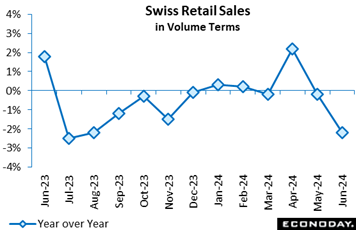 Swiss retail sales dipped a monthly 0.1 percent in June which, following a 0.2 percent fall in May, was the third drop in the last four months and confirmed a poor quarter for spending. The latest decline also reduced annual growth from minus 0.2 percent to minus 2.2 percent, well below the consensus and the weakest mark since last September. Swiss retail sales dipped a monthly 0.1 percent in June which, following a 0.2 percent fall in May, was the third drop in the last four months and confirmed a poor quarter for spending. The latest decline also reduced annual growth from minus 0.2 percent to minus 2.2 percent, well below the consensus and the weakest mark since last September.
June's monthly setback was led by the food, drink and tobacco subsector where purchases fell 0.5 percent. However, non-food demand (minus 0.1 percent) similarly contracted and auto fuel was also down 0.6 percent.
June's update leaves overall volume sales last quarter 0.6 percent lower than in the previous period when they increased a modest 0.2 percent. The data are broadly in keeping with the recent flat trend in consumer confidence and weakening labour market and mean that the retail sector subtracted from second quarter GDP growth.
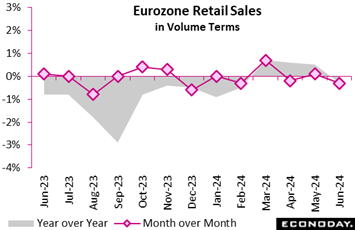 Retail sales in the Eurozone were surprisingly weak at quarter-end. A monthly 0.3 percent drop was well short of the consensus and left the level of purchases at a 4-month low. The drop reduced annual growth from 0.5 percent to also minus 0.3 percent, its first sub-zero reading since February. Retail sales in the Eurozone were surprisingly weak at quarter-end. A monthly 0.3 percent drop was well short of the consensus and left the level of purchases at a 4-month low. The drop reduced annual growth from 0.5 percent to also minus 0.3 percent, its first sub-zero reading since February.
June's monthly setback was led by the food, drink and tobacco subsector where purchases fell 0.7 percent after a 1.0 percent bounce in May. However, non-food (ex-auto fuel) demand (minus 0.1 percent) similarly edged lower for a second straight month and the headline decline would have been steeper but for a 0.5 percent increase in auto fuel.
Regionally, both France (minus 0.2 percent) and Italy (minus 0.1 percent) recorded modest losses but Spain (0.3 percent) made fresh progress. Note that German data are not expected to be available until much closer to the end of August.
Despite June's setback, second quarter Eurozone sales were still up 0.3 percent versus the first quarter, implying a small positive contribution to the period's GDP growth. Even so, the trend in volumes remains very sluggish.
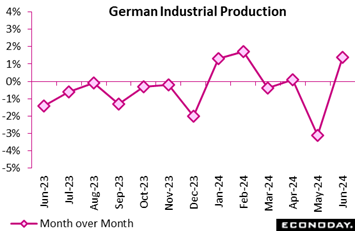 Germany's industrial sector showed promising signs of recovery in June with a 1.4 percent increase from the previous month, seasonally and calendar adjusted. This rebound follows a significant 3.1 percent decline in May, highlighting the industry's volatility. Year-over-year, June's production was down 3.9 percent, reflecting broader economic challenges. Germany's industrial sector showed promising signs of recovery in June with a 1.4 percent increase from the previous month, seasonally and calendar adjusted. This rebound follows a significant 3.1 percent decline in May, highlighting the industry's volatility. Year-over-year, June's production was down 3.9 percent, reflecting broader economic challenges.
The automotive industry spearheaded this positive trend, surging by 7.5 percent after a sharp 9.9 percent drop in May. Similarly, the manufacture of electrical equipment grew by 5.2 percent, contributing to the overall rise. However, the food industry's production fell by 5.3 percent, dampening the sector's performance.
Excluding energy and construction, industrial production increased by 1.5 percent from May, with capital goods up 2.5 percent and intermediate goods up 2.1 percent. Consumer goods saw a decline of 2.4 percent. Energy production rose by 2.9 percent, and construction by 0.3 percent.
Despite these monthly gains, the second quarter of 2024 was 1.3 percent lower than the first quarter, indicating ongoing instability. However, energy-intensive industries showed resilience, with production rising by 1.4 percent month-over-month and 3.8 percent year-over-year. These mixed results underscore the sector's complex recovery trajectory amid fluctuating economic conditions.
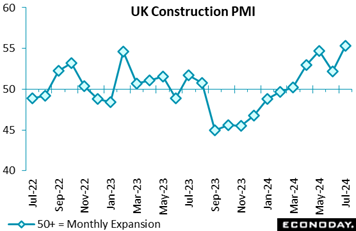 UK construction had a very good July. The sector PMI weighed in at 55.3, up from June's 52.2 and indicative of the fastest pace of growth in 26 months. The latest reading was also well above consensus. UK construction had a very good July. The sector PMI weighed in at 55.3, up from June's 52.2 and indicative of the fastest pace of growth in 26 months. The latest reading was also well above consensus.
All of the three main categories posted gains, notably civil engineering which enjoyed its best period in almost two-and-a-half years. The pick-up was led by new orders which expanded for a sixth straight month and by the most since April 2022. As a result, both purchasing activity and headcount grew significantly more quickly than in June. Sub-contractor usage also rose for a fourth successive month and, despite dipping, business confidence remained very optimistic.
However, stronger activity helped to boost input costs and the rate of inflation accelerated to its joint-highest in 14 months.
The removal of election uncertainty may have provided a lift but the overall tone of the July report is solid and hardly suggests that the construction sector is in dire need of another cut in Bank Rate. Indeed, mounting cost pressures will need watching closely.
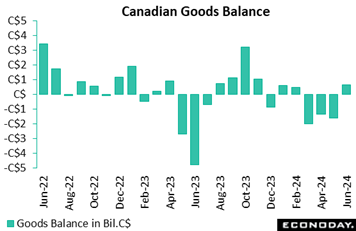 Canada's goods trade balance unexpectedly swung to a C$0.638 billion surplus in June from a C$1.611 billion deficit in May. Forecasters in an Econoday survey looked for a deficit of C$1.9 billion for June. Canada's goods trade balance unexpectedly swung to a C$0.638 billion surplus in June from a C$1.611 billion deficit in May. Forecasters in an Econoday survey looked for a deficit of C$1.9 billion for June.
The surplus came after three straight monthly goods trade deficits and reflected a 5.5 percent rise in exports, with exports of crude oil and unwrought gold accounting for three-quarters of the rise. Imports were up by 1.9 percent.
Exports saw increases across 9 of 11 sectors. In real terms, exports rose 3.8 percent in June from May. In nominal terms, leading the way were energy product exports, up 11.7 percent in June, paced by crude oil, up 13.3 percent. Crude prices were up but the increase reflected a rise in volume terms mostly because of higher volumes sold to Asia with the recent expansion of the Trans Mountain Pipeline. Within the metallic and nonmetallic minerals category, which gained 11.8 percent, exports of unwrought gold rocketed by 35.3 percent.
On the import side, increases were seen in 9 of 11 sectors. In real/volume terms imports rose 1.3 percent in June from May. The biggest swing factor was imports of motor vehicles and parts, up 5.1 percent with passenger cars and light trucks rising 8.2 percent on the month to a record $6.8 billion. This mostly reflected a bounce back from factory disruptions and slow deliveries from the US starting in late 2023. Consumer goods was another big mover on the import side, up 3.7 percent. This was paced by pharma products imported from the US, up 16.9 percent after two straight monthly decreases.
Regionally, the surplus with the US widened for a third straight month reaching C$9.4 billion in June, up from C$8.8 billion in May, its widest since November 2023. The trade deficit with countries excluding the US declined to C$8.7 billion in June from C$10.4 billion in May as exports bounced up by 15.7 percent in June after dropping 13.0 percent in May. Imports ex-US edged up 2.1 percent in June from May.
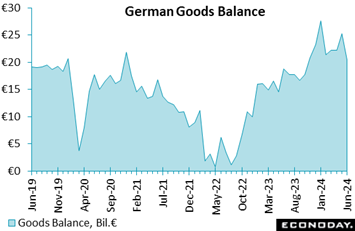 Germany's export and import dynamics paints a mixed economic picture. Exports declined by 3.4 percent from the previous month, totaling €127.7 billion, reflecting a broader year-over-year drop of 8.3 percent. Conversely, imports slightly increased by 0.3 percent from May, reaching €107.3 billion, though they were still down 9.3 percent compared to June 2023. This modest rise in imports may indicate stable domestic consumption. Germany's export and import dynamics paints a mixed economic picture. Exports declined by 3.4 percent from the previous month, totaling €127.7 billion, reflecting a broader year-over-year drop of 8.3 percent. Conversely, imports slightly increased by 0.3 percent from May, reaching €107.3 billion, though they were still down 9.3 percent compared to June 2023. This modest rise in imports may indicate stable domestic consumption.
The foreign trade balance remained robust with a surplus of €20.4 billion, though this was a reduction from May's €25.3 billion surplus. The unadjusted surplus was slightly higher at €22.2 billion, underlining a consistent trade advantage despite fluctuating market conditions. Compared to June 2023's surplus of €19.0 billion, the current figures highlight resilience amid global economic pressures. Overall, while exports face headwinds, Germany's ability to maintain a positive trade balance underscores its economic resilience.
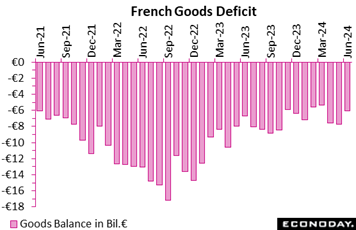 France's trade balance continues its deficit trajectory, at €7.1 billion in June. Both exports and imports slightly declined, each dropping by €0.1 billion, bringing totals to €50.8 billion and €57.9 billion, respectively. France's trade balance continues its deficit trajectory, at €7.1 billion in June. Both exports and imports slightly declined, each dropping by €0.1 billion, bringing totals to €50.8 billion and €57.9 billion, respectively.
Notably, the energy sector showed resilience with a €0.2 billion improvement in the balance, fueled by increased export volumes. This positive shift highlights France's growing strength in energy exports amid global market fluctuations. The consumer goods sector also contributed positively, with a surplus increase of €0.1 billion, signaling robust demand for French products.
However, the picture was mixed for other sectors. The investment goods balance remained unchanged, indicating stability but no growth. Conversely, the intermediate goods sector faced challenges, with its balance deteriorating by €0.2 billion, suggesting potential supply chain issues.
Overall, while certain sectors show promising signs, France's trade dynamics underscore the need for strategic adjustments to bolster weaker areas and capitalize on strengths, particularly in energy and consumer goods.
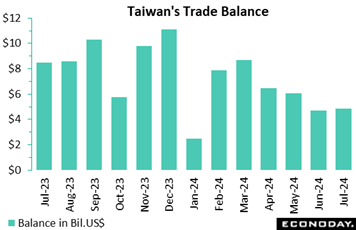 Taiwan's trade surplus widened slightly from $4.68 billion in June to $4.83 billion in July. Exports rose 3.1 percent after increasing 23.5 percent previously, while imports rose 16.2 percent after a previous increase of 33.9 percent. More subdued headline growth in exports was largely driven by slower but still very strong exports of information, communication and audio-video products, up 42.4 percent on the year after surging 114.1 percent previously, with exports of electronic components also weakening from growth of 7.3 percent to a year-over-year decline of 12.0 percent. Exports to the US increased 70.3 percent on the year, while exports to mainland China and Hong Kong fell 13.5 percent. Petroleum imports recorded slower growth, while imports from mainland China and Hong Kong recorded another month of solid growth. Taiwan's trade surplus widened slightly from $4.68 billion in June to $4.83 billion in July. Exports rose 3.1 percent after increasing 23.5 percent previously, while imports rose 16.2 percent after a previous increase of 33.9 percent. More subdued headline growth in exports was largely driven by slower but still very strong exports of information, communication and audio-video products, up 42.4 percent on the year after surging 114.1 percent previously, with exports of electronic components also weakening from growth of 7.3 percent to a year-over-year decline of 12.0 percent. Exports to the US increased 70.3 percent on the year, while exports to mainland China and Hong Kong fell 13.5 percent. Petroleum imports recorded slower growth, while imports from mainland China and Hong Kong recorded another month of solid growth.
Global data on net are coming in near consensus estimates, at minus 7 and just below the zero line on Econoday’s Relative Performance Index (RPI). Yet when excluding what have been as-expected to firmer-than-expected inflation data, the index less prices (RPI-P) falls to minus 18 to indicate modest underperformance in economic activity.
In China, unexpectedly firm inflation news was not enough to lift either the RPI (minus 14) or the RPI-P (minus 40) back above zero. Still, the stronger tone to prices will help ease deflation worries and so reduces the likelihood of another cut in central bank interest rates.
The US sits at minus 24 both overall and less prices. These scores are near the lowest of the year and speak to noticeable underperformance especially since they’re being posted against moderating forecasts. Extended underperformance would seem to guarantee a rate cut at the Federal Reserve’s September 17-18 meeting.
Canada is at minus 4 and plus 10, both near enough to zero to indicate that results on net have been roughly as expected but, like the US, are coming against downgraded estimates. A third consecutive rate cut at the Bank of Canada’s next meeting, on September 4, shouldn’t be ruled out.
In the Eurozone, surprisingly sluggish household spending in June helped to trim the RPI-P to minus 11. However the RPI, at plus 11, shows that recent surprises on inflation have been tilted to the upside so another cut in ECB interest rates next month remains uncertain.
In the UK, the RPI (14) and RPI-P (10) both moved back above zero for the first time since mid-July. However, current readings point to only limited upside surprises and the bigger picture still shows unexpected weakness in overall economic activity.
In Switzerland, the probability of another cut in the SNB’s policy rate continues to rise as a strengthening franc adds to the easing pressure caused by low inflation and general economic underperformance. The RPI closed the week at minus 8 and the RPI-P at minus 10.
In Japan, both the RPI (19) and RPI-P (47) held in positive surprise territory despite a mixed report on June household spending. BoJ interest rates are going up but the current high level of volatility in the financial markets argues for a steady policy stance near-term.
**Contributing to this article were Jeremy Hawkins, Brian Jackson, Mace News, Max Sato, Olajide Oyadeyi, and Theresa Sheehan
Wednesday’s US CPI is expected show limited if any progress in July with monthly rates expected to be modestly higher but still exceeding those of June and with annual rates unchanged to marginally lower at best. US retail sales on Thursday are expected to be slightly higher to flat while industrial production on Thursday is expected to reverse prior gains. Consumer sentiment on Friday is expected to edge higher but remain depressed.
Chinese data on Friday are also expected to prove uninspiring with no change in July growth rates for fixed asset investment and industrial production and only modest improvement from a depressed June for retail sales.
Policy announcements will be limited to the Reserve Bank of New Zealand which is expected to hold rates steady on Wednesday. Headline inflation in the UK is expected to move modestly higher on Wednesday with the first estimate for second-quarter GDP expected to hold firm on Thursday.
Consumer inflation data from India is expected to slow significantly in data for July. Australian wage data on Tuesday is expected to be steady with Australian employment expected to moderate in data on Thursday.
Indian CPI for July (Mon 1730 IST; Mon 1200 GMT; Mon 0800 EDT)
Consensus Forecast, Year over Year: 3.7%
Consumer prices in July are expected to ease well back to 3.7 percent on the year versus 5.08 and 4.75 percent in the prior two months.
Australian Wage Price Index for the Second Quarter (Tue 1130 AEST; Tue 0130 GMT; Mon 2130 EDT)
Consensus Forecast, Quarter over Quarter: 0.9%
Consensus Forecast, Year over Year: 4.0%
Wage growth in the second quarter is expected to rise 0.9 percent on the quarter and 4.0 percent on the year. These would compare with first-quarter rates of 0.8 and 4.1 percent.
UK Labour Market Report (Tue 0700 BST; Tue 0600 GMT; Tue 0200 EDT)
Consensus Forecast, ILO Unemployment Rate for three months to July: 4.5%
The ILO unemployment rate for the three months to July is expected to edge higher to 4.5 percent from 4.4 percent.
Germany: ZEW Survey for August (Tue 1100 CEST; Tue 0900 GMT; Tue 0500 EDT)
Consensus Forecast, Economic Sentiment: 36.0
ZEW’s expectations component (economic sentiment), which fell sharply in the last report to 41.8, is expected to fall further to 36.0.
Reserve Bank of New Zealand Announcement (Wed 1400 NZST; Wed 0200 GMT; Tue 2200 EDT)
Consensus Forecast, Change: 0 basis points
Consensus Forecast, Level: 5.50%
Though inflation has remained high, the Reserve Bank of New Zealand has been keeping policy steady. Consensus for August’s meeting is once again no change for the RBNZ’s policy rate at 5.50 percent.
UK CPI for July (Wed 0700 BST; Wed 0600 GMT; Wed 0200 EDT)
Consensus Forecast, Month over Month: 0.0%
Consensus Forecast, Year over Year: 2.3%
June’s 2.0 percent headline rate was right on the Bank of England’s target with July’s rate seen climbing to 2.3 percent.
Eurozone Industrial Production for June (Wed 1100 CEST; Wed 0900 GMT; Wed 0500 EDT)
Consensus Forecast, Month over Month: 0.7%
Production in June is expected to rise a monthly 0.7 percent after a 0.6 percent decline in May. June will need at least a 3.3 percent monthly surge just to keep second-quarter output flat.
US CPI for July (Wed 1230 GMT; Wed 0830 EDT)
Consensus Forecast, Month over Month: 0.2%
Consensus Forecast, Year over Year: 3.0%
US CPI Core, Less Food & Energy
Consensus Forecast, Month over Month: 0.2%
Consensus Forecast, Year over Year: 3.2%
Overall prices are expected to rise 0.2 percent in July after unexpectedly falling 0.1 percent in June. Core prices increased only 0.1 percent in June which was also below expectations with July’s consensus at the headline rate of plus 0.2 percent. Annual rates, which in June were 3.0 percent overall and 3.3 percent for the core, are expected at 3.0 and 3.2 percent, respectively.
Japanese Second-Quarter GDP, First Estimate (Thu 0850 JST; Wed 2350 GMT; Wed 1950 EDT)
Consensus Forecast, Quarter over Quarter: 0.6%
Consensus Forecast, Annualized Rate: 2.3%
GDP for the second quarter is expected to rise a quarterly 0.6 percent and rise 2.3 percent on an annualized basis as consumption and business investment picked up after having been hit in the first quarter by suspended output at Toyota group over a safety test scandal. Public works spending is also seen rebounding after a sharp drop.
Australian Labour Force Survey for July (Thu 1130 AEST; Thu 0130 GMT; Wed 2130 EDT)
Consensus Forecast, Employment: 22,000
Consensus Forecast, Unemployment Rate: 4.1
Employment in July is expected to rise 22,000 versus June’s much stronger-than-expected 50,200 gain. Unemployment is expected to hold at 4.1 percent.
Chinese Fixed Asset Investment for July (Thu 1000 CST; Thu 0200 GMT; Wed 2200 EDT)
Consensus Forecast, Year-to-Date on Y/Y Basis: 3.9%
Fixed asset investment for the year-to-date for July is expected to rise 3.9 percent which would match June’s rate.
Chinese Industrial Production for July (Thu 1000 CST; Thu 0200 GMT; Wed 2200 EDT)
Consensus Forecast, Year over Year: 5.3%
Year-over-year growth in industrial production rose 5.0 percent in June versus expectations for 5.3 percent and after 5.6 percent growth in May. Expectations for July is 5.3 percent.
Chinese Retail Sales for July (Thu 1000 CST; Thu 0200 GMT; Wed 2200 EDT)
Consensus Forecast, Year over Year: 2.6%
After rising a much lower-than-expected 2.0 percent in June, year-over-year sales in August are expected to rise 2.6 percent.
UK Second-Quarter GDP, First Estimate (Thu 0700 BST, Thu 0600 GMT; Thu 0200 EDT)
Consensus Forecast, Quarter over Quarter: 0.6%
Total quarter-over-quarter output is seen rising 0.6 percent in the second quarter versus 0.7 percent growth in the first quarter.
US Retail Sales for July (Thu 0830 EDT; Thu 1230 GMT)
Consensus Forecast, Month over Month: 0.3%
Consensus Forecast, Ex-Vehicles - M/M: 0.1%
Consensus Forecast, Ex-Vehicles, Ex-Gas - M/M: 0.3%
July sales are expected to rise 0.3 percent versus no change in June which beat expectations for a 0.3 percent decline. June’s ex-auto sales increased 0.4 percent with July expected to rise only 0.1 percent; July ex-auto ex-gas are expected at 0.3 percent versus the prior month’s 0.8 percent jump.
US Industrial Production for July (Thu 1315 GMT; Thu 0915 EDT)
Consensus Forecast, Month over Month: -0.1%
Consensus Forecast, Manufacturing Output - M/M: -0.3%
Consensus Forecast, Capacity Utilization Rate: 78.6%
After surprising gains of 0.9 percent in May and 0.6 percent in June, industrial production in July is expected to fall 0.1 percent. Manufacturing output, which rose 1.0 percent in May and 0.4 percent in June, is expected to fall 0.3 percent. Capacity utilization is expected to ease to 78.6 percent following 78.8 percent in June.
UK Retail Sales for July (Fri 0700 BST; Fri 0600 GMT; Fri 0200 EDT)
Consensus Forecast, Year over Year: 1.7%
Likely biased down by poor weather, volumes fell 0.2 percent on the year in June with July expected to rebound 1.7 percent.
Canadian Housing Starts for July (Fri 0815 EDT; Fri 1215 GMT)
Consensus Forecast, Annual Rate: 245,000
Housing starts are expected to rise slightly to a 245,000 annual rate in July versus June’s 241,672.
Canadian Manufacturing Sales for June (Fri 08:30 EDT; Fri 1230 GMT)
Consensus Forecast, Month over Month: -2.6%
Manufacturing sales in June are expected to fall 2.6 percent on the month. This would compare with a 0.4 percent rise in May and a 1.4 percent climb in April.
US Consumer Sentiment Index, Preliminary August (Fri 1000 EDT; Fri 1400 GMT)
Consensus Forecast: 67.0
In the first indication for August, consumer sentiment is expected to edge higher to 67.0 from July’s 66.4. Readings in this report have been depressed.
|
