|
Global inflation continues to moderate and has, in a few economies, returned to official target ranges, or nearly so. A sweeping run of rate cuts could then be expected were it not, however, for resilience in many labor markets that continues to support respectable rates of GDP growth in many but not all economies. Policy rates continue to sit near their peaks, currently at an average 4.27 percent based on Econoday’s weighted composite of major central banks, a level that compares with 4.36 percent in early June. Rates are beginning to come down, but only slowly and one bank at a time. The Reserve Bank of New Zealand is the latest.
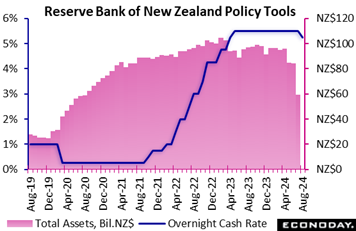 The Reserve Bank of New Zealand's Monetary Policy Committee cut the official cash rate by 25 basis points from 5.50 percent to 5.50 percent. This followed eight consecutive meetings at which they left the policy rate on hold and was in contrast to the consensus forecast for no change. This was the first reduction in this rate since March 2020. The Reserve Bank of New Zealand's Monetary Policy Committee cut the official cash rate by 25 basis points from 5.50 percent to 5.50 percent. This followed eight consecutive meetings at which they left the policy rate on hold and was in contrast to the consensus forecast for no change. This was the first reduction in this rate since March 2020.
This easing in policy follows data published last month which showed headline CPI inflation falling to 3.3 percent in the three months to June from 4.0 percent in the three months to March, with core inflation falling from 3.7 percent to 2.8 percent. In the quarterly Monetary Policy Statement published with the statement, officials advised that this now makes them more confident that inflation will fall back to within their target range of one percent to three percent this quarter and remain within that range over the forecast horizon.
Officials also advised that they are now more concerned about the near-term growth outlook. They noted that recent indicators suggest "the economy is contracting faster than anticipated" and that "the downside risks to output and employment that were highlighted in July have become more apparent".
Reflecting this assessment, officials concluded that there is now "scope to temper the extent of monetary policy restraint" while cautioning that "monetary policy will need to remain restrictive for some time to ensure that domestic inflationary pressures continue to dissipate". This suggests that officials will consider further rate cuts in upcoming meetings provided they are confident that their inflation objectives will be met.
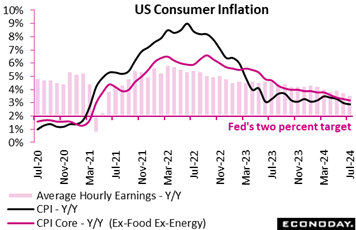 The July CPI rose 0.2 percent from June matching the consensus in the Econoday survey of forecasters. The core CPI – excluding food and energy – also rose 0.2 percent on the month in July and also matched the survey consensus. Food prices rose 0.2 percent on the month and were up 2.2 percent year-over-year. Energy prices were flat in July and up 1.1 percent on the year. In the energy CPI, gasoline prices in July were unchanged from the prior month and down 2.2 percent on the year. The July CPI rose 0.2 percent from June matching the consensus in the Econoday survey of forecasters. The core CPI – excluding food and energy – also rose 0.2 percent on the month in July and also matched the survey consensus. Food prices rose 0.2 percent on the month and were up 2.2 percent year-over-year. Energy prices were flat in July and up 1.1 percent on the year. In the energy CPI, gasoline prices in July were unchanged from the prior month and down 2.2 percent on the year.
Fed policymakers will likely find sufficient progress in July’s report to allow them to cut the fed funds target rate at their September 17-18 meeting, but not so much to accelerate the timeline of future cuts.
While the year-over-year pace was only slightly lower than the June report, it reflects continued progress in reducing upward price pressures. The annual CPI increase edged lower to 2.9 percent from 3.0 percent in June, a tenth below the survey consensus. The core CPI was up 3.2 percent after 3.3 percent in June to match the consensus. Upward price pressures remained absent in the commodities index which declined 0.4 percent year-over-year in July. Price pressures from services continue to dominate consumer costs with this index up 4.9 percent year-over-year in July, although a tad lower than 5.0 percent in June.
Shelter costs were up 0.4 percent in July and up 5.1 percent compared to July 2023. Shelter costs are decelerating only slowly and are still a significant contributor to upward pressure on services. The CPI excluding shelter only was unchanged in July from June and up 1.7 percent compared to July 2023. The special aggregate CPI for services less rent of shelter was unchanged in July compared to the prior month and was up 4.6 percent year-over-year.
While deceleration in prices will be welcome in returning to the Fed’s 2 percent inflation objective, it does mean that recipients of the annual cost-of-living-adjustment for Social Security benefits are likely to see their smallest increase since 2021. With only the CPI-W data available (urban wage earners and clerical workers) it is not possible to say what the final adjustment will be. At the moment, the comparison with the third quarter 2023 is up 2.4 percent, but further disinflation will likely bring this lower when the August and September data become available.
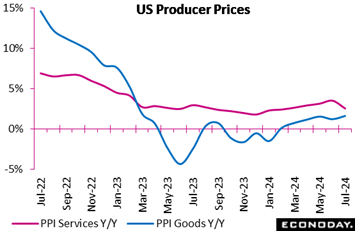 Moderation for services inflation, which has been stubbornly higher, helped cool producer price pressures in July in what should add incrementally to expectations for a September rate cut. Headline producer prices edged only 0.1 percent higher on the month versus Econoday's consensus for a 0.2 percent rise, while the year-over-year rate slowed to 2.2 percent which was well under expectations for 2.6 percent and down from a revised 2.7 percent in June. Services prices slowed from an annual 3.5 percent to 2.6 percent for the lowest rate of inflation since early this year. Goods prices remain subdued at 1.7 percent annually though this was up from 1.3 percent in June and the highest rate since March last year. Moderation for services inflation, which has been stubbornly higher, helped cool producer price pressures in July in what should add incrementally to expectations for a September rate cut. Headline producer prices edged only 0.1 percent higher on the month versus Econoday's consensus for a 0.2 percent rise, while the year-over-year rate slowed to 2.2 percent which was well under expectations for 2.6 percent and down from a revised 2.7 percent in June. Services prices slowed from an annual 3.5 percent to 2.6 percent for the lowest rate of inflation since early this year. Goods prices remain subdued at 1.7 percent annually though this was up from 1.3 percent in June and the highest rate since March last year.
But indications from this report are solidly favorable, evident in ex-food ex-energy where the monthly rate came in unchanged for the lowest reading of the year while the annual rate slowed from 3.0 to 2.4 percent for the lowest rate since March this year.
Services prices declined across categories including for machinery and vehicle wholesaling which fell 4.1 percent on the month. Prices for food and alcohol retailing, software publishing and physician care also fell, offsetting a 2.3 percent rise for portfolio management services. A monthly 2.8 percent rise for gasoline lifted goods readings and offset a 1.1 percent decline for electric power.
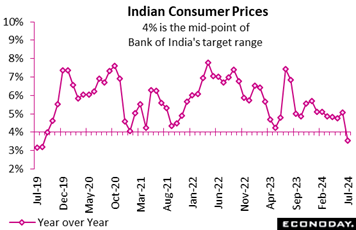 India's consumer price index rose 3.54 percent on the year in July, slowing from an increase of 5.08 percent in June. This is the smallest year-over-year increase since 2019 and also takes headline inflation, for the first time since 2019, below the mid-point of the Reserve Bank of India's target range of two percent to six percent. India's consumer price index rose 3.54 percent on the year in July, slowing from an increase of 5.08 percent in June. This is the smallest year-over-year increase since 2019 and also takes headline inflation, for the first time since 2019, below the mid-point of the Reserve Bank of India's target range of two percent to six percent.
Lower headline inflation was largely driven by food prices. Food and beverage prices rose 5.06 percent on the year, down from the 8.36 percent increase recorded previously, while fuel and light charges fell 5.48 percent on the year after a previous decline of 3.66 percent. Inflation in urban areas fell from 4.39 percent in June to 2.98 percent in July, while inflation in rural areas slowed from 5.66 percent to 4.10 percent.
At the RBI's most recent policy meeting, held in the prior week, officials left policy rates on hold at 6.50 percent. Officials noted that base effects and the impact of weather on food prices could result in some volatility in inflation in the near-term, but they repeated their earlier pledge to maintain their "disinflationary stance" until "a durable alignment of the headline CPI inflation with the target is achieved".
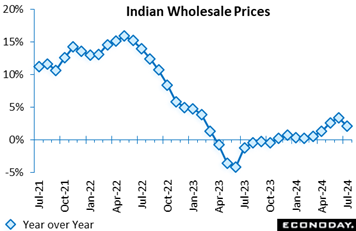 India's wholesale price index rose 2.04 percent on the year in July after increasing 3.36 percent in June. The smaller year-over-year increase in wholesale prices in July was driven by food prices, which account for around 15 percent of the index. These rose 3.55 percent on the year after increasing 8.68 percent previously. Manufacturing prices, around 64 percent of the index, rose 1.58 percent on the year after a previous increase of 1.43 percent, while fuel prices, around 13 percent of the index, rose 1.72 percent on the year, up from the previous increase of 1.03 percent. India's wholesale price index rose 2.04 percent on the year in July after increasing 3.36 percent in June. The smaller year-over-year increase in wholesale prices in July was driven by food prices, which account for around 15 percent of the index. These rose 3.55 percent on the year after increasing 8.68 percent previously. Manufacturing prices, around 64 percent of the index, rose 1.58 percent on the year after a previous increase of 1.43 percent, while fuel prices, around 13 percent of the index, rose 1.72 percent on the year, up from the previous increase of 1.03 percent.
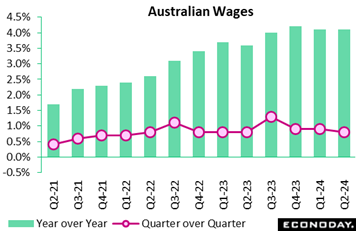 Australia's wage price index rose 0.8 percent on the quarter in the three months to June after a 0.9 percent increase in the three months to March, with year-over-year growth steady at 4.1 percent. Monthly labour market data over that period showed ongoing low unemployment rates and participation rates close to record highs. Australia's wage price index rose 0.8 percent on the quarter in the three months to June after a 0.9 percent increase in the three months to March, with year-over-year growth steady at 4.1 percent. Monthly labour market data over that period showed ongoing low unemployment rates and participation rates close to record highs.
The second-quarter's data will likely reinforce concerns expressed by officials at the Reserve Bank of Australia in their most recent quarterly update published in the prior week that wage growth is too high relative to productivity growth and represents an upside risk to inflation. Officials have left policy rates on hold stressing that policy "will need to be sufficiently restrictive until the Board is confident that inflation is moving sustainably towards the target range".
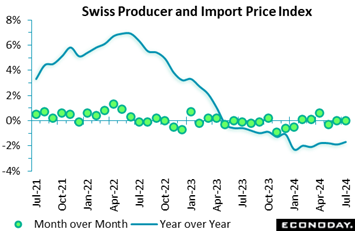 For a second successive month, Switzerland’s combined producer and import price index was unchanged in July. The flat monthly reading was again slightly softer than the market consensus but with base effects positive, still firm enough to lift the annual inflation rate from minus 1.9 percent to minus 1.7 percent, a 4-month high. For a second successive month, Switzerland’s combined producer and import price index was unchanged in July. The flat monthly reading was again slightly softer than the market consensus but with base effects positive, still firm enough to lift the annual inflation rate from minus 1.9 percent to minus 1.7 percent, a 4-month high.
Domestic prices were also flat at their May level, leaving their yearly rate stable at minus 1.2 percent. Import prices edged up just 0.1 percent, lifting their annual rate from minus 3.2 percent to minus 2.7 percent.
Within the PPI, a 6.5 percent monthly spike in petroleum products added nearly 0.1 percentage point but was offset by typically small declines in a number of other categories. Petroleum products (3.9 percent) easily posted the steepest increase in the import price index. As a result, overall core prices were unchanged versus June, leaving the annual underlying rate steady at minus 2.1 percent.
Pipeline price pressures would seem to be past their weakest point but current trends remain soft and offer little threat to the price stability goals of the Swiss National Bank.
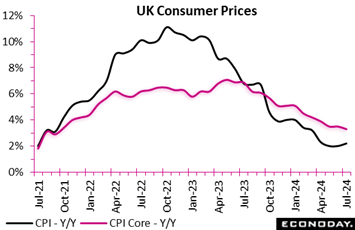 UK consumer prices were surprisingly soft in July. A 0.2 percent monthly fall was a couple of ticks below Econoday’s consensus but with prices down fully 0.4 percent in July 2023, still firm enough to lift the yearly inflation rate from 2.0 percent to 2.2 percent. This made for the first increase since last December and leaves headline inflation 0.2 percentage points above target. UK consumer prices were surprisingly soft in July. A 0.2 percent monthly fall was a couple of ticks below Econoday’s consensus but with prices down fully 0.4 percent in July 2023, still firm enough to lift the yearly inflation rate from 2.0 percent to 2.2 percent. This made for the first increase since last December and leaves headline inflation 0.2 percentage points above target.
The main upward pressure on the annual rate came from housing and household services where inflation accelerated from minus 4.7 percent to minus 1.5 percent, largely due to a smaller monthly fall in utilities prices than a year ago. Clothing and footwear (2.1 percent after 1.6 percent) and miscellaneous services (3.5 after 2.9 percent) also provided a boost. On the downside, restaurants and hotels (4.9 after 6.2 percent) subtracted as did transport (0.2 after 0.9 percent). Consequently, the core rate continued to fall and, at 3.3 percent, was down from 3.5 percent, to undershoot expectations for its lowest level since September 2021. Overall goods inflation increased from minus 1.4 percent to minus 0.6 percent but its services counterpart dropped from 5.7 percent to 5.2 percent, matching the weakest print since May 2022.
The BoE had already been expecting headline inflation to rise over the latter half of the year so the July report is unlikely to come as a major surprise. Still, it will probably leave the four MPC hawks who voted against the cut in Bank Rate earlier this month all the more wary about easing again as soon as September. However, the sharp fall in the core rate and slowdown in services should sit well with the doves and, on balance, the chances of another cut next month have probably increased slightly.
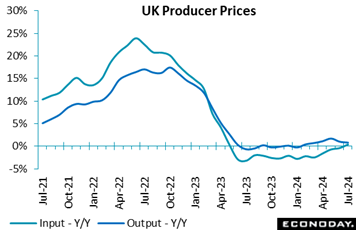 The July PPIs in the UK were mixed but still point to subdued pipeline inflation pressures in manufacturing. The July PPIs in the UK were mixed but still point to subdued pipeline inflation pressures in manufacturing.
Factory gate prices were only flat on the month and slightly short of the market consensus. Following a steeper revised 0.7 percent fall in June, this saw the annual inflation rate ease further from 1.0 percent to 0.8 percent, a 4-month low. On the month, prices fell sharply for alcohol and tobacco (1.0 percent) and coke and petroleum products (0.5 percent) but there were largely offsetting gains in textiles and clothing (0.6 percent) and chemicals (0.4 percent). Consequently, core prices were also unchanged, trimming the underlying yearly rate by a tick to 1.0 percent.
At the same time, raw material and fuel costs dipped 0.1 percent versus June, a couple of ticks less than expected. Positive base effects lifted yearly inflation from 0.0 percent to 0.4 percent, its first print above zero since May 2023. Prices of crude petroleum, natural gas and metal ores rose 1.3 percent and imported food 1.4 percent but there were falls in beverages and tobacco (0.7 percent), domestic food (0.8 percent) and in a number of other categories.
July’s report offers another reminder that even though manufacturing seems to be on the turn, inflation in the sector is yet not an issue to worry the Bank of England.
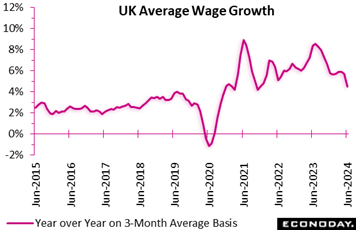 Wage growth in the UK eased significantly in the three months to June, but only in line with market expectations. At 4.5 percent, average annual growth was well down from 5.7 percent in the three months to May and was the slowest since the three months to November 2021. Regular earnings also decelerated but, at 5.4 percent after an upwardly revised 5.8 percent, remain worryingly high. Wage growth in the UK eased significantly in the three months to June, but only in line with market expectations. At 4.5 percent, average annual growth was well down from 5.7 percent in the three months to May and was the slowest since the three months to November 2021. Regular earnings also decelerated but, at 5.4 percent after an upwardly revised 5.8 percent, remain worryingly high.
ILO employment data for the second quarter showed a surprise fall to a 4.2 percent unemployment rate, fully three ticks below of the consensus. This matched its lowest point since the three months ending January 2024. At the same time, employment was up 97,000 and, at 33.094 million, hit its highest level in five months. The employment rate now stands at 74.5 percent, its second successive increase albeit still 0.7 percentage points lower on the year.
Elsewhere, payroll data for July showed a 24,174 monthly increase to 30.437 million, its third straight gain and another new high. However, vacancies in the three months to July continued to spiral down, declining 26,000 to 884,000. This constitutes their weakest reading since the second quarter of 2021 although they remain well above pre-Covid levels.
Consequently, there is something for the doves and hawks alike, although neither camp seems to put much faith in the results given persistent questions over sample sizes and the data’s reliability.
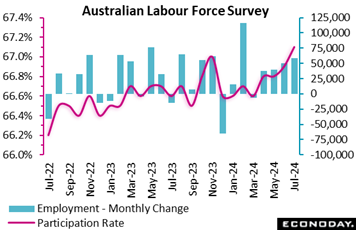 Labour market conditions in Australia tightened further in July with employment, for the fourth month in a row, up more strongly than the Econoday’s consensus estimate and the participation rate moving higher. This strength will likely keep focus at the Reserve Bank of Australia on risks to the inflation outlook. Labour market conditions in Australia tightened further in July with employment, for the fourth month in a row, up more strongly than the Econoday’s consensus estimate and the participation rate moving higher. This strength will likely keep focus at the Reserve Bank of Australia on risks to the inflation outlook.
The number of people employed in Australia rose by 58,200 in July, up from an increase of 50,200 in June. This was well above the consensus forecast for an increase of 22,000. Full-time employment rose by 60,500 persons after a previous increase of 43,300, while part-time employment fell by 2,300 after a previous increase of 6,800. Hours worked rose 0.4 percent on the month after increasing 0.3 percent previously.
July’s unemployment rate rose slightly from 4.1 percent in June to 4.2 percent in July. The participation rate also rose from 66.9 percent to a record high of 67.1 percent.
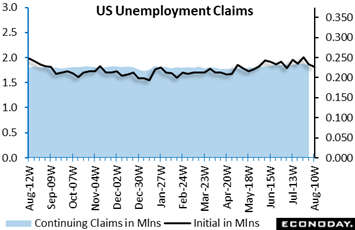 Perhaps the only indicator that could upend a September rate cut in the US is the August employment report, that is if nonfarm payrolls ratchet back up to prior rates of growth. Weekly jobless claims aren't pointing perhaps to accelerating payroll growth but they're not pointing to any slowing. Initial claims fell 7,000 in the August 10 week to a lower-than-expected 227,000 in turn pulling down the 4-week average by 4,500 to 236,500. Claims had been rising in recent weeks, to as high as 250,000 in late July but two weeks of slowing hint perhaps to a return to the 220,000 and below levels of the spring. Perhaps the only indicator that could upend a September rate cut in the US is the August employment report, that is if nonfarm payrolls ratchet back up to prior rates of growth. Weekly jobless claims aren't pointing perhaps to accelerating payroll growth but they're not pointing to any slowing. Initial claims fell 7,000 in the August 10 week to a lower-than-expected 227,000 in turn pulling down the 4-week average by 4,500 to 236,500. Claims had been rising in recent weeks, to as high as 250,000 in late July but two weeks of slowing hint perhaps to a return to the 220,000 and below levels of the spring.
Continuing claims in lagging data for the August 3 edged 7,000 lower to 1.864 million with this 4-week average inching higher to 1.862 million. Though steady, continuing claims are nevertheless at a multi-year high in contrast, however, to the unemployment rate for insured workers which remains where it has been since March last year, at a very low 1.2 percent.
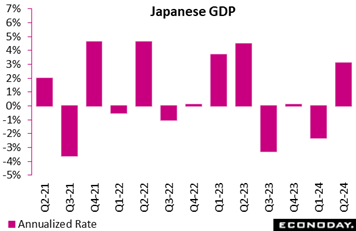 Japanese GDP posted a stronger-than-expected rebound in the second quarter after contracting in two of the three prior quarters. Growth came in at an annualized 3.1 percent versus Econoday’s consensus for 2.3 percent as consumption and business investment picked up after having been hit by suspended output at Toyota group factories over a safety test scandal. Public works spending also marked a sharp rebound. Japanese GDP posted a stronger-than-expected rebound in the second quarter after contracting in two of the three prior quarters. Growth came in at an annualized 3.1 percent versus Econoday’s consensus for 2.3 percent as consumption and business investment picked up after having been hit by suspended output at Toyota group factories over a safety test scandal. Public works spending also marked a sharp rebound.
Domestic demand added 0.9 percentage points to total domestic output after pulling down the first quarter GDP by 0.1 points. External demand (exports minus imports) was still sluggish, trimming overall growth by 0.1 points after making a negative 0.5-point contribution in the prior quarter. The number of visitors from other countries has recovered to pre-Covid levels and their spending is counted as Japanese exports of services. By contrast, the volumes of goods exports are falling as the effects of the past rate hikes by major central banks are weighing on global growth.
Looking ahead, moderate growth is expected for the third quarter helped by the fastest pace of wage growth in 33 years and as companies invest in capacity to cope with labor shortages. Real wages rose 1.1 percent on the year in June, marking the first rise in more than two years.
The Cabinet Office estimates that in order for real GDP to hit the official forecast of 0.9 percent growth in fiscal 2024 (revised down from 1.3 percent last month), the economy will have to grow 0.5 percent on quarter, or an annualized 2.1 percent in each quarter of the three quarters left in the fiscal year ending next March, which might be challenging for Japan's wobbly recovery from the pandemic.
Japanese Prime Minister Fumio Kishida also made headlines in the week, announcing that he will not seek re-election at the Liberal Democratic Party leadership convention in late September, taking the blame for widespread political funding scandals at the ruling party. Kishida, 67, will step down at the end of his three-year term next month as the approval ratings of his cabinet have drifted lower amid elevated costs for daily necessities and voter frustration over the money scandals involving many LDP factions at a time when the government plans to raise taxes to finance higher miliary spending.
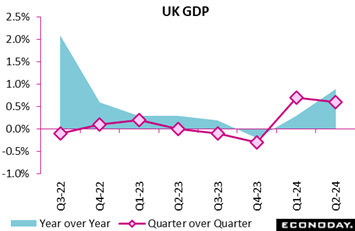 In terms of headline data, the UK economy had a good second quarter. GDP expanded 0.6 percent versus the previous period, in line with the market consensus and only just short of an unrevised 0.7 percent gain at the start of the year. Annual growth climbed from 0.3 percent to 0.9 percent, its strongest reading since the third quarter of 2022. In terms of headline data, the UK economy had a good second quarter. GDP expanded 0.6 percent versus the previous period, in line with the market consensus and only just short of an unrevised 0.7 percent gain at the start of the year. Annual growth climbed from 0.3 percent to 0.9 percent, its strongest reading since the third quarter of 2022.
However, household consumption posted a modest 0.2 percent quarterly gain, only half the rate recorded in the first quarter and growth of gross fixed capital formation eased from 0.9 percent to 0.4 percent. Moreover, within the latter, business investment dipped 0.1 percent, its first contraction since the first quarter of last year. Consequently, the overall expansion would have been a good deal less robust but for government spending which jumped 1.4 percent. Business inventories had a broadly neutral effect.
Net foreign trade had a negative impact as a 0.8 percent rise in exports was easily eclipsed by a 7.7 percent jump in imports, the latter's first advance since the fourth quarter of 2022. As a result, net exports subtracted fully 2.2 percentage points.
In sum, despite respectable headline growth, final domestic demand was much less impressive with both private consumption and business investment falling well short of their first quarter performances. And looking at the monthly profile, GDP ground to a halt in June pointing perhaps to lack of momentum going into July. Still, the economy in the first half of the year proved surprisingly resilient to high interest rates so the pressure on the BoE to reduce Bank Rate is not as great as might have been expected earlier. That said, with inflation on the way down another cut at next month's MPC meeting cannot be ruled out.
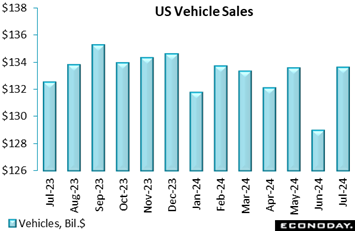 US retail and food services sales jumped 1.0 percent on the month in July, well above Econoday’s consensus gain of 0.3 percent. Gains were concentrated in vehicles excluding which sales rose a less spectacular 0.4 percent though still above the consensus gain of 0.1 percent. July starts off consumer spending in the third quarter on an upbeat note. US retail and food services sales jumped 1.0 percent on the month in July, well above Econoday’s consensus gain of 0.3 percent. Gains were concentrated in vehicles excluding which sales rose a less spectacular 0.4 percent though still above the consensus gain of 0.1 percent. July starts off consumer spending in the third quarter on an upbeat note.
The accompanying graph tracks monthly vehicle sales by dollar totals, at $133.6 billion in seasonal and calendar adjusted terms to edge out May and March for the biggest total since February this year; vehicles accounted for 18.8 percent of July’s total sales. Consumer commitment to major purchases like vehicles underscores the month’s strength.
And outside of vehicles sales were solid as well including for building materials and garden centers rising 0.9 percent in July. Sales at food and beverage stores also rose 0.9 percent for the month. Health and personal care stores saw an increase of 0.8 percent in July and general merchandise store sales 0.5 percent. And the list goes on: sales of electronics and appliances rose 1.6 percent on the month and furniture and home furnishings 0.5 percent.
The Amazon Prime Day sales event, however, didn’t make much of a difference as sales at nonstore retailers rose only 0.2 percent in July. Nevertheless, nonstore retailers accounted for a substantial 17.3 percent of all sales.
Sales fell 0.1 percent for clothing and accessory stores and were down 0.7 percent for sporting goods, hobby, musical instrument, and book stores in July. Softness in these two categories may suggest that consumers were waiting for back-to-school sales and sales tax holidays in August.
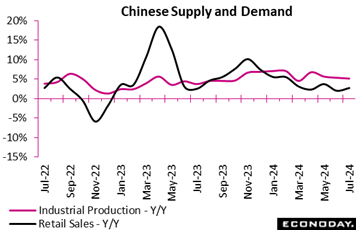 Chinese retail sales rose 2.7 percent on the year in July, picking up from 2.0 percent in June and edging above expectations for 2.6 percent growth. In month-over-month terms, retail sales rose 0.35 percent after falling 0.12 percent in June. Chinese industrial production, published along with retail sales, rose 5.1 percent on the year in July, moderating from growth of 5.3 percent in June and missing expectations by a couple of tenths. In month-over-month terms, industrial production rose 0.35 percent in July after increasing 0.42 percent in June. Chinese retail sales rose 2.7 percent on the year in July, picking up from 2.0 percent in June and edging above expectations for 2.6 percent growth. In month-over-month terms, retail sales rose 0.35 percent after falling 0.12 percent in June. Chinese industrial production, published along with retail sales, rose 5.1 percent on the year in July, moderating from growth of 5.3 percent in June and missing expectations by a couple of tenths. In month-over-month terms, industrial production rose 0.35 percent in July after increasing 0.42 percent in June.
Within the industrial sector, manufacturing output slowed to 5.3 percent growth on the year after increasing 6.0 percent in June. Utilities output and mining output rose 4.0 percent and 4.6 percent respectively after increasing 4.3 percent and 3.6 percent respectively in June.
In other July data, fixed asset investment rose 3.6 percent year-to-date, moderating from growth of 3.9 percent in June. In month-over-month terms, fixed asset investment fell 0.17 percent after advancing 0.21 percent previously.
Officials characterized the monthly data as showing that "the national economy was generally stable with steady progress", as they did last month. However, they also cautioned that "the adverse impact brought by external environment is increasing, effective demands remain insufficient at home, pains are caused while old growth drivers are replaced by new ones, and sustained economic recovery is still confronted with multiple difficulties and challenges." Having reduced the loan prime rate last month, officials provided little guidance whether additional policy measures will be considered in the near-term.
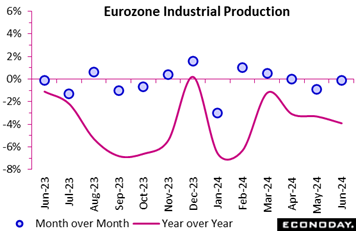 Industrial production surprisingly contracted in June. A 0.1 percent monthly dip in the Eurozone was well off the market consensus, especially after taking on board a downward revision to May from a 0.6 percent fall to a 0.9 percent fall. Output has contracted in each of the last three months and leaves goods production at its lowest level since September 2020, in the midst of the pandemic. Industrial production surprisingly contracted in June. A 0.1 percent monthly dip in the Eurozone was well off the market consensus, especially after taking on board a downward revision to May from a 0.6 percent fall to a 0.9 percent fall. Output has contracted in each of the last three months and leaves goods production at its lowest level since September 2020, in the midst of the pandemic.
However, the setback was restricted to consumer non-durables which were down fully 2.5 percent versus May. By contrast, consumer durables were up 3.8 percent and there were gains too in intermediates (0.7 percent), capital goods (0.9 percent) and energy (1.9 percent).
Regionally the headline slide masked rises in France (0.7 percent), Germany (1.6 percent), Italy (0.5 percent) and Spain (0.4 percent). Rather it reflected weakness among some of the smaller member states, notably Ireland (minus 7.8 percent), Portugal (minus 3.7 percent), Croatia (minus 3.7 percent) and Lithuania (minus 2.2 percent).
The June data leave second-quarter Eurozone industrial production 0.4 percent below its first quarter level, implying another hit to GDP growth. The region's goods producing sector continues to struggle and early business surveys have held out little hope of any real recovery this quarter.
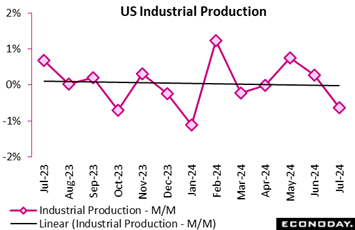 Industrial production in the US fell 0.6 percent on the month in July, a much sharper decline than the 0.1 percent dip forecasters were expecting and one tied to July shutdowns in the petrochemical sector due to Hurricane Beryl which, according to the Federal Reserve which produces this report, reduced the month’s output by 0.3 percentage points. The Fed further noted that Hurricane Beryl held back overall manufacturing by 0.3 percent and reduced production in the mining sector where output of natural gas liquid extraction declined. Industrial production in the US fell 0.6 percent on the month in July, a much sharper decline than the 0.1 percent dip forecasters were expecting and one tied to July shutdowns in the petrochemical sector due to Hurricane Beryl which, according to the Federal Reserve which produces this report, reduced the month’s output by 0.3 percentage points. The Fed further noted that Hurricane Beryl held back overall manufacturing by 0.3 percent and reduced production in the mining sector where output of natural gas liquid extraction declined.
Manufacturing output fell 0.3 percent in July with durables manufacturing down 0.9 percent but with nondurables up 0.4 percent. Manufacturing of motor vehicles and parts fell a very sharp 7.8 percent and probably included factory shutdowns for retooling as well as impacts related to the hurricane. Manufacturing excluding motor vehicles rose 0.3 percent in July.
Utilities output fell 3.7 percent while output in mining was flat. The former included a 4.3 decrease in electricity that offset a 1.3 percent rise for natural gas. Mining included a decrease of 0.3 percent in oil and gas drilling.
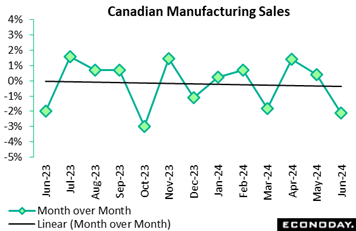 Manufacturing sales in Canada retreated by 2.1 percent in June from May, slightly better than expectations for a 2.6 percent decline. Real sales also declined 2.1 percent on the month. In year-over-year terms, nominal sales were down 1.8 percent and were down by a bigger 4.3 percent in real terms. Manufacturing sales in Canada retreated by 2.1 percent in June from May, slightly better than expectations for a 2.6 percent decline. Real sales also declined 2.1 percent on the month. In year-over-year terms, nominal sales were down 1.8 percent and were down by a bigger 4.3 percent in real terms.
Looking ahead, indicators are bleak as new orders dropped 4.7 percent on the month and unfilled orders fell 0.8 percent.
Inventories rose 0.1 percent in June from July and the inventory-to-sales ratio rose to 1.74 in June from 1.70 in May and 1.72 a year ago.
The unadjusted capacity utilization rate rose to 80.2 percent in June from 79.7 percent in May and compared with 80.8 percent in June a year ago.
On a quarterly basis, total sales fell 0.3 percent, their third consecutive quarterly decline. The decline in the second quarter was driven by a decrease of 4.0 percent in petroleum and coal products and by motor vehicles, down 3.8 percent.
The weak showing in manufacturing was widespread with 17 of 21 subsectors down on the month. Transportation was the big driver with a loss of 2.9 percent after two consecutive monthly increases. Within transportation, motor vehicle parts fell 5.6 percent and aerospace products fell 2.9 percent.
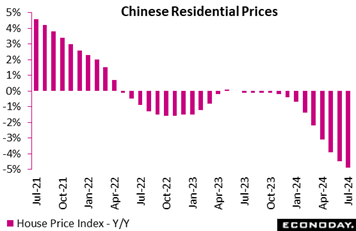 China's residential property prices fell 4.9 percent on the year in July, weakening further from a decline of 4.5 percent in June. This is the biggest year-over-year decline in house prices since 2015 and may prompt additional policy measures to support conditions in the property market. China's property market has been very weak for nearly two years, representing a major drag on investment and consumer spending. China's residential property prices fell 4.9 percent on the year in July, weakening further from a decline of 4.5 percent in June. This is the biggest year-over-year decline in house prices since 2015 and may prompt additional policy measures to support conditions in the property market. China's property market has been very weak for nearly two years, representing a major drag on investment and consumer spending.
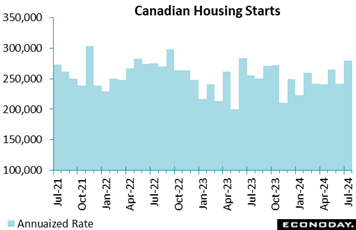 Housing starts in Canada rebounded by 16 percent in July to a seasonally adjusted annualized rate of 279,509 from a slightly revised 241,643 in June. The July figure far exceeded Econoday's consensus expectation of 245,000. Housing starts in Canada rebounded by 16 percent in July to a seasonally adjusted annualized rate of 279,509 from a slightly revised 241,643 in June. The July figure far exceeded Econoday's consensus expectation of 245,000.
The six-month trend for total housing starts rose 3.2 percent to 255,783 in July from 247,840 units in June. The trend measure is a six-month moving average of the SAAR of total housing starts for all areas in Canada.
For urban areas with populations of 10,000 or more, housing starts rose 17 percent in July from June to an annualized 261,134. Multi-unit urban starts surged by 21 percent in July from June to an annualized 217,306 units.
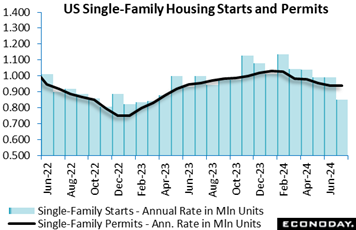 Starts of new homes fell a steep 6.8 percent in July to 1.238 million units at a seasonally adjusted annual rate after a downward revision in June to 1.329 million units. July’s level was much weaker than expected and the lowest since 931,000 in April 2020. This likely reflects impacts from Hurricane Beryl preventing some starts and also increased caution on the part of homebuilders at a time when homebuyers are anticipating lower mortgage rates and therefore staying out of the housing market. Starts of new homes fell a steep 6.8 percent in July to 1.238 million units at a seasonally adjusted annual rate after a downward revision in June to 1.329 million units. July’s level was much weaker than expected and the lowest since 931,000 in April 2020. This likely reflects impacts from Hurricane Beryl preventing some starts and also increased caution on the part of homebuilders at a time when homebuyers are anticipating lower mortgage rates and therefore staying out of the housing market.
July’s decline was due to a fall of 14.1 percent in single-family home starts from 991,000 in June to 851,000 for the lowest level since 822,000 in March 2023. Starts of multi-unit homes, by contrast, rose 14.5 percent compared to July to 387,000 from 338,000 in the prior month. Year-over-year, however , multi-unit starts were down 18.4 percent.
The composition of starts in part is an affordability issue. Prices for homes remain elevated which makes getting a favorable mortgage rate a determining factor for homebuyers. In July, demand for new single-family homes saw some effect from mortgage rates remaining relatively high, if just below 7 percent. Some homebuyers may have turned to the less expensive multi-unit segment of the market. In any case, the significant drop in mortgage rates in early August and rebound after Hurricane Beryl will probably result in a rebound in starts in next month's report.
The number of permits issued in July fell 4.0 percent to 1.396 million and were down 7.0 percent compared to a year ago. The July level was short of Econoday’s consensus for 1.430 million but not materially so given the weather impacts and outlook for mortgage rates.
Permits issued for single-family homes were essentially unchanged in July at 938,000 and down only 1.6 percent from a year ago. There is still underlying demand for new single-family homes behind the month-to-month fluctuations. Permits issued for multi-unit properties fell 11.1 percent to 458,000 in July and were down 16.4 percent compared to July 2023. Volatility in the multi-unit sector is not unusual and levels have fallen significantly from 2022 when renters were taking advantage of lower mortgage rates at a time when rents were rising quickly. It is possible that with mortgage rates below 6.5 percent for a 30-year fixed rate mortgage, some renters will take a fresh look at the advantages of homeownership.
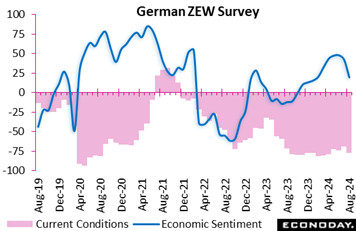 Germany’s ZEW indicator for August paints a grim picture of Germany's economic prospects, marking its steepest decline in over two years. With a significant drop of 22.6 points to 19.2, the indicator signals waning confidence, akin to the sharp downturn seen in July 2022. The assessment of Germany's current economic situation also worsened, with the indicator plummeting by 8.4 points to a worrying minus 77.3. Germany’s ZEW indicator for August paints a grim picture of Germany's economic prospects, marking its steepest decline in over two years. With a significant drop of 22.6 points to 19.2, the indicator signals waning confidence, akin to the sharp downturn seen in July 2022. The assessment of Germany's current economic situation also worsened, with the indicator plummeting by 8.4 points to a worrying minus 77.3.
The sharp decline was attributed to pervasive uncertainty due to inconsistent monetary policies, disappointing US economic data, and escalating geopolitical tensions in the Middle East. This uncertainty has not only rattled international stock markets but also dampened expectations for Germany's export-driven sectors.
The broader Eurozone is also feeling the strain, with economic sentiment dropping by 25.8 points to 17.9, a fall not seen since April 2020. However, a slight improvement in the Eurozone's current situation indicator, which rose by 3.7 points to minus 32.4, offers a faint glimmer of hope against an otherwise less-than-upbeat economic landscape.
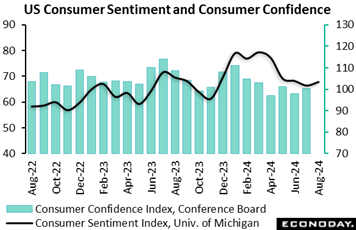 The University of Michigan consumer sentiment index is up 1.4 points so far this month to 67.8, a little above the consensus of 67.0 in the Econoday survey of forecasters. Overall, consumer sentiment is not much changed over the past four months amid uncertainty over US economic conditions, geopolitical events, and the developing presidential election. The University of Michigan consumer sentiment index is up 1.4 points so far this month to 67.8, a little above the consensus of 67.0 in the Econoday survey of forecasters. Overall, consumer sentiment is not much changed over the past four months amid uncertainty over US economic conditions, geopolitical events, and the developing presidential election.
The index for current conditions fell 1.8 points in early August to 60.9 after 62.7 in July, extending its downtrend since March. The August reading is the lowest since 59.4 in December 2022. Consumers are likely a little more concerned about the health of the labor market and prospects for higher earnings. However, the index for future conditions rose 3.3 points to 72.1 in August for the highest reading since 76.0 in April. At least in part, consumers are more hopeful with the prospect of lower interest rates and less inflation.
The 1-year inflation expectations measure is 2.9 percent in August, the same as in July and well below the near-term peak of 4.5 percent in November 2023. The 5-year inflation expectations measure is unchanged at 3.0 percent in August where it has been since April. Combined with the incremental improvements in upward price pressures, Fed policymakers will have greater confidence that the FOMC can lower short-term rates a bit at the September 17-18 meeting without risking reigniting inflation.
Global data edged a little bit deeper into the underperformance column, ending the week at minus 9 on Econoday’s Relative Performance Index (RPI) and at minus 19 when excluding price data (RPI-P), the latter indicating greater underperformance in real economic activity.
In the Eurozone, signs that economic activity was disappointingly sluggish last quarter saw the RPI and RPI-P close out the week at minus 11 and minus 18 respectively. Neither gauge is deep in negative surprise territory but sub-zero readings can only boost speculation about another cut in ECB interest rates next month.
Similarly in the UK, the latest data were generally on the soft side of expectations and lowered the RPI to minus 22 and the RPI-P to minus 13. Importantly too, the July CPI surprised on the downside, further boosting the chances of another reduction in Bank Rate at the BoE MPC’s September meeting.
In Switzerland, the RPI (minus 8) and RPI-P (minus 10) show overall economic activity still undershooting forecasts, albeit by rather less than in recent months. In particular, another surprisingly weak inflation update helped to underpin forecasts for a third straight SNB ease next month.
In Japan, surprisingly robust second quarter growth kept the RPI (21) and the RPI-P (41) comfortably above zero, supporting speculation about another hike in BoJ interest rates once financial markets have steadied.
By contrast, in China economic data were again generally weaker than anticipated and reflected in an RPI of minus 29. Indeed, adding to doubts about recovery prospects, the RPI-P at minus 60 shows recent real activity undershooting forecasts by the most since February.
The impact of Hurricane Beryl made for unexpected weakness in several US reports during the week including industrial production and housing starts. The US RPI had been on the rise but moved back to neutral in the latest week, at 5 and 3 for the two readings. For Federal Reserve policy, the August employment report on September 6 will be the last hurdle to jump before a September 18 rate cut.
Strong housing starts and less weakness than expected for manufacturing sales gave Canada a lift, ending the week at 18 on the RPI and at 35 when excluding inflation, the latter pointing to significant outperformance for the real economy. But it will be the outcome of consumer prices on Tuesday of the coming week that will affect expectations for the Bank of Canada’s September 4 meeting and whether a third consecutive rate cut is in store.
**Contributing to this article were Jeremy Hawkins, Brian Jackson, Mace News, Max Sato, Olajide Oyadeyi, and Theresa Sheehan
The first focus of the week will be Chinese loan prime rate announcements on Tuesday with no new cuts expected. The Bank of Korea announcement on Thursday is expected to hold policy steady.
Minutes from the Reserve Bank of Australia’s meeting in early August will be posted on Tuesday, with FOMC minutes from the Federal Reserve’s meeting in late July on Wednesday. Headlines from the Fed’s Jackson Hole symposium will be filling up the tape on Thursday, Friday and also Saturday. Fed Chair Jerome Powell, who will speak Friday at 10:00 a.m. ET, may well send a message to the markets that anticipation of a rate cut in September is justified, absent unexpected developments. Minutes from the European Central Bank’s mid-July meeting will be posted on Thursday.
Canada’s CPI on Tuesday will go a long way to forecasting what the Bank of Canada will do at its September 4 meeting. Moderation from 2.7 to 2.5 percent is Econoday’s consensus estimate for headline consumer prices.
Japanese merchandise trade will be posted on Wednesday and Japanese CPI on Friday. August PMI flashes will be posted on Thursday.
Japanese Machinery Orders for June (Mon 0850 JST; Sun 2350 GMT; Sun 1950 EDT)
Consensus Forecast, Month over Month: 0.9%
Consensus Forecast, Year over Year: 3.6%
After falling by 3.2 and 2.9 percent the last two reports, machinery orders are expected to rebound 0.9 percent in June for year-over-year growth 3.6 percent. The government downgraded its assessment in the May report saying “the pickup in machinery orders is pausing”.
China Loan Prime Rates (Tue 0915 CST; Tue 0115 GMT; Mon 2115 EDT)
Consensus Change: 1-Year Rate: 0 basis points
Consensus Level: 3.35%
Consensus Change: 5-Year Rate: 0 basis points
Consensus Level: 3.85%
After unexpectedly cutting both the 1-year and 5-year loan prime rates by 10 basis points at their July meeting, officials are expected to hold rates unchanged at August’s announcement, at 3.35 percent for the former and 3.85 percent for the latter.
German PPI for July (Tue 0800 CEST; Tue 0600 GMT; Tue 0200 EDT)
Consensus Forecast, Month over Month: 0.2%
Consensus Forecast, Year over Year: -0.7%
July’s PPI is seen matching June’s 0.2 percent rise. Year-over-year, the PPI is expected to fall 0.7 percent versus 1.6 percent contraction in June.
Canadian CPI for July (Tue 0830 EDT; Tue 1230 GMT)
Consensus Forecast, Month over Month: 0.3%
Consensus Forecast, Year over Year: 2.5%
After June’s lower-than-expected 2.7 percent rate that was down from May’s 2.9 percent, consumer prices in July are expected to decrease to 2.5 percent.
Japanese Merchandise Trade for July (Wed 0850 JST; Tue 2350 GMT; Tue 1950 EDT)
Consensus Forecast: -Y326.5 billion
Consensus Forecast, Imports Y/Y: 16.9%
Consensus Forecast, Exports Y/Y: 12.9%
A deficit of ¥326.5 billion is the consensus for July’s trade balance versus a surplus of ¥224.0 billion in June. Both imports and also exports slowed in June, to respective year-over-year gains of 3.2 and 5.4 percent with base effects expected to lift July’s gains into the double digits.
Bank of Korea Announcement (Thu 1000 KST; Thu 0100 GMT; Wed 2100 EDT)
Consensus Forecast, Change: 0 basis points
Consensus Forecast, Level: 3.50%
The Bank of Korea has kept policy unchanged since early 2023 but did note in its July statement that, given moderation in inflation, a rate cut could be in the offing. For its August meeting, however, no change is expected.
German PMI Flashes for August (Thu 0930 CEST; Thu 0730 GMT; Thu 0330 EDT)
Consensus Forecast, Composite: 49.8
Consensus Forecast, Manufacturing: 43.5
Consensus Forecast, Services: 52.4
Manufacturing in July remained deeply depressed at 43.2. No meaningful improvement is expected for August where the consensus is 43.5. Services, which in July edged 6 tenths lower to 52.5, are seen steady at 52.4.
Eurozone PMI Flashes for August (Thu 1000 CEST; Thu 0800 GMT; Thu 0400 EDT)
Consensus Forecast, Composite: 50.7
Consensus Forecast, Manufacturing: 46.1
Consensus Forecast, Services: 52.2
The composite is expected to rise to 50.7 in August versus 50.2 in July and 50.9 in June. Manufacturing in August is expected to edge higher to 46.1 versus 45.8 in both July and June. Services are expected at 52.2 from July’s 51.9.
UK PMI Flashes for August (Thu 0930 BST; Thu 0830 GMT; Thu 0430 EDT)
Consensus Forecast, Composite: 52.9
Consensus Forecast, Manufacturing: 52.1
Consensus Forecast, Services: 52.8
Manufacturing has held over the 50 line the last three reports with August seen unchanged at 52.1. Services rose 4 tenths in July to 52.5 with August’s consensus at 52.8. The composite is seen little changed at 52.9 vs 52.8.
Eurozone: EC Consumer Confidence Flash for August (Thu 1600 CEST; Thu 1400 GMT; Thu 1000 EDT)
Consensus Forecast: -13.0
Consumer confidence in August is expected to hold unchanged at July’s minus 13.0 which was a full point above June and a half point above the consensus.
Japanese CPI for July (Fri 0830 JST; Thu 2330 GMT; Thu 1930 EDT)
Consensus Forecast, Year over Year: 2.7%
Consensus Forecast, Ex-Fresh Food; Y/Y: 2.7%
Consensus Forecast, Ex-Fresh Food Ex-Energy; Y/Y: 1.9%
Consumer inflation in July is expected to ease to 2.7 percent versus 2.8 percent in both May and June. Excluding fresh food, the rate is also seen at 2.7 percent versus 2.6 percent in June. When also excluding energy, the rate is seen at 1.9 percent versus June’s 2.2 percent which was up from May’s 2.1 percent
Singapore CPI for July (Fri 1300 SGT; Fri 0500 GMT; Fri 0100 EDT)
Consensus Forecast, Year over Year: 2.6%
Consumer prices in July are expected to rise to 2.6 percent versus June’s lower-than-expected 2.4 percent rate.
French Business Climate Indicator for August (Fri 0845 CEST; Fri 0645 GMT; Fri 0245 EDT)
Consensus Forecast: 96
After falling a steep 5 points in July to 94 for the lowest level since February 2021, sentiment in French manufacturing is expected to partially recover to 96 in August.
Canadian Retail Sales for June (Fri 0830 EDT; Fri 1230 GMT)
Consensus Forecast, Month over Month: -0.3%
Retail sales in June are expected to fall 0.3 percent on the month after falling 0.8 percent in May.
|
