|
There was definitely the expectation that Jerome Powell would use the Jackson Hole conference to signal the beginning of the Federal Reserve’s rate-cut cycle, but that became something of a certainty following steep downward revisions to prior payroll totals. On Wednesday morning the Bureau of Labor Statistics cut 818,000 payroll jobs from April last year to March this year, which comes to an average overstatement of 68,000 per month! This shocked everyone except apparently the Fed whose minutes from last month’s meeting, released later Wednesday, said that “many participants noted that reported payroll gains might be overstated”. Well there was no “might” about it and Powell sealed the shift on Friday saying downside risks to employment have increased and “the time has come for policy to adjust.”
Falling rates in the US will act to increase domestic demand and perhaps inflation as well, spilling over to the global economy. Yet not all economies are tracking along with the US. The Reserve Bank of Australia in the minutes of its latest meeting warned that inflation had not fallen at the pace that officials would like to see. Noting that employment was still strong, officials at the meeting once again considered raising rates.
But the Fed shift does dovetail with the ECB which began to cut rates in June. And minutes from the July ECB meeting do leave open the possibility of another rate at this bank’s September 12 meeting but perhaps don’t increase such chances. Officials noted that inflation was coming down but only gradually and that inflation in services had remained more persistent than expected. Given the Fed’s move and what it may mean for global inflation, perhaps the ECB’s debate may become more hawkish. September’s ECB meeting may well be approached with an open mind.
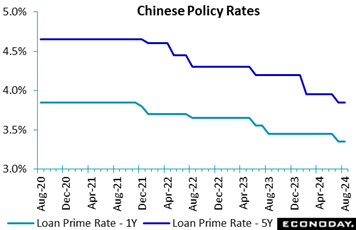 The People's Bank of China left the one-year and five-year loan prime rates unchanged at 3.35 percent and 3.85 percent respectively at its monthly review, in line with the consensus forecast. Both rates were reduced by 10 basis points last month. The People's Bank of China left the one-year and five-year loan prime rates unchanged at 3.35 percent and 3.85 percent respectively at its monthly review, in line with the consensus forecast. Both rates were reduced by 10 basis points last month.
Officials characterised monthly activity data published in the prior week as showing that "the national economy was generally stable with steady progress", as they did last month. However, they also cautioned that "the adverse impact brought by external environment is increasing, effective demands remain insufficient at home, pains are caused while old growth drivers are replaced by new ones, and sustained economic recovery is still confronted with multiple difficulties and challenges". Officials provided little guidance about whether additional policy measures would be considered in the near-term, and the latest decision to leave loan prime rates on hold suggest they currently believe that the reductions implemented last month will provide sufficient support to economic conditions.
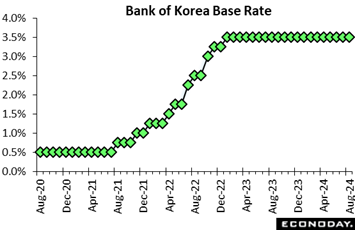 The Bank of Korea left its main policy rate unchanged at 3.50 percent, in line with the consensus forecast, but also advised for the second consecutive month that a rate cut at upcoming meetings may be considered. Officials have left this rate on hold since the start of 2023 after tightening policy aggressively over 2022 as part of efforts to return headline inflation to their target level of 2.0 percent. The Bank of Korea left its main policy rate unchanged at 3.50 percent, in line with the consensus forecast, but also advised for the second consecutive month that a rate cut at upcoming meetings may be considered. Officials have left this rate on hold since the start of 2023 after tightening policy aggressively over 2022 as part of efforts to return headline inflation to their target level of 2.0 percent.
Since the previous BoK meeting last month, data have shown a small increase in headline inflation from 2.4 percent in June to 2.6 percent in July, with core inflation steady at 2.2 percent. In their statement, officials retained their forecast for core inflation to average 2.2 percent this year and 2.0 percent in 2025 but noted uncertainties about the outlook. Officials also continue to expect moderate economic growth, forecasting GDP to expand by 2.4 percent this year and 2.1 percent next year.
Officials reaffirmed that their priority is "to conduct monetary policy in order to stabilize consumer price inflation at the target level over the medium-term horizon". They noted, however, that they now have "greater confidence that inflation will converge on the target level". This, they concluded, will allow them to "examine the proper timing of rate cuts while maintaining a restrictive monetary policy stance". Incoming inflation data will likely be the key factor that determines whether such a cut will take place in upcoming meetings.
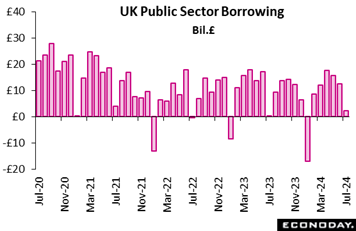 Public sector finances in the UK were again in worse shape than expected in July. Overall net borrowing (PSNB) was £2.18 billion, well down on June's smaller revised £12.55 billion but £1.7 billon above the market consensus and even further above the £0.37 billion recorded a year ago. Excluding public sector banks (PSNB-X), the red ink stood at £3.10 after a downwardly revised £13.48 billion at quarter-end and £1.29 billion in July 2023. Both July readings were the highest for the month since 2021. Public sector finances in the UK were again in worse shape than expected in July. Overall net borrowing (PSNB) was £2.18 billion, well down on June's smaller revised £12.55 billion but £1.7 billon above the market consensus and even further above the £0.37 billion recorded a year ago. Excluding public sector banks (PSNB-X), the red ink stood at £3.10 after a downwardly revised £13.48 billion at quarter-end and £1.29 billion in July 2023. Both July readings were the highest for the month since 2021.
Total public sector spending was up £3.8 billion on the year as the effects of inflation more than offset a reduction in debt interest payments. Receipts were up £3.0 billion. Net debt was 99.4 percent of GDP, unchanged from June but 3.8 percentage points higher than in July 2023 and roughly in line with the levels last seen in the early 1960s.
The July PSNB-X was £3.0 billion more than forecast by the Office for Budget Responsibility (OBR) and so again underlines the fiscal problems facing the new Labour government.
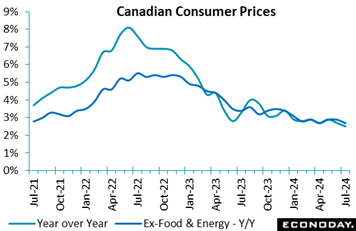 Consumer prices in Canada are cooling, to an as-expected 2.5 percent in July and down from 2.7 percent in June with the ex-food ex-energy core likewise down to 2.7 from 2.9 percent. The headline rate is now at its lowest point since March 2021, and is likely to prove pleasing to the Bank of Canada as policy-makers consider another rate cut at their September 4 meeting. The decline in price inflation was broad-based and particularly reflected lower price increases in electricity, travel tours, and automobiles, Statistics Canada said. Consumer prices in Canada are cooling, to an as-expected 2.5 percent in July and down from 2.7 percent in June with the ex-food ex-energy core likewise down to 2.7 from 2.9 percent. The headline rate is now at its lowest point since March 2021, and is likely to prove pleasing to the Bank of Canada as policy-makers consider another rate cut at their September 4 meeting. The decline in price inflation was broad-based and particularly reflected lower price increases in electricity, travel tours, and automobiles, Statistics Canada said.
Travel tour prices fell 2.8 percent on year in July after rising 7.4 percent in June, mostly due to a base-year effect as prices jumped in July 2023 from June 2023 when pandemic restrictions on travel were lifted. Passenger car prices were another big moderating factor with a decline of 1.4 percent on the year in July, largely due to a lower price increase for new cars, up 1.0 percent on the year.
On the upside for prices, gasoline prices rose more rapidly in July from a year ago, 1.9 percent versus 0.4 percent in June. This was mostly due to reduced fuel supply from a refinery closing in the Midwestern U.S.
The Bank of Canada's own core measures of inflation came down to 2.4 percent year-over-year on average in July from 2.6 percent in June and 2.6 percent in May. All three measures have been below 3.0 percent, the top of the Bank of Canada's inflation target range, since April.
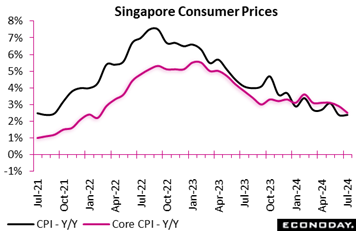 Singapore's headline consumer price index rose 2.4 percent on the year in July, unchanged from the increase recorded in June. The index fell 0.3 percent on the month after a drop of 0.2 percent previously. The Monetary Authority of Singapore's preferred measure of core inflation, which excludes the cost of accommodation and private road transport, fell from 2.9 percent in June to 2.5 percent in July, its lowest level since February 2022. This index fell 0.1 percent on the month after no change previously. Singapore's headline consumer price index rose 2.4 percent on the year in July, unchanged from the increase recorded in June. The index fell 0.3 percent on the month after a drop of 0.2 percent previously. The Monetary Authority of Singapore's preferred measure of core inflation, which excludes the cost of accommodation and private road transport, fell from 2.9 percent in June to 2.5 percent in July, its lowest level since February 2022. This index fell 0.1 percent on the month after no change previously.
The fall in core inflation in July was largely driven by a smaller increase in services prices, up 2.9 percent on the year after a previous increase of 3.4 percent, with prices also growing at a slightly slower pace for food, electricity and gas, and retail and other goods. Private transport costs rose 0.9 percent on the year after a previous decline of 0.7 percent.
Officials at the MAS retained their target for appreciation of Singapore's exchange rate at their last quarterly meeting last month, and officials on Friday again expressed confidence that this appreciation will curb imported inflation over the rest of the year. They cautioned, however, that stronger-than-expected labour market conditions could put renewed upward pressure on wage growth.
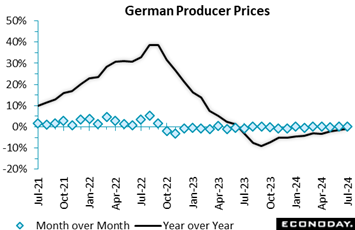 Industrial producer prices in Germany fell by 0.8 percent in July compared to a year earlier, marking a recovery from June's sharper decline of 1.6 percent. Over the month of June, producer prices rose by 0.2 percent in line with forecast estimates. This was largely driven by the upward tick in energy prices by 0.5 percent from June, reflecting some volatility in the energy market. Industrial producer prices in Germany fell by 0.8 percent in July compared to a year earlier, marking a recovery from June's sharper decline of 1.6 percent. Over the month of June, producer prices rose by 0.2 percent in line with forecast estimates. This was largely driven by the upward tick in energy prices by 0.5 percent from June, reflecting some volatility in the energy market.
Excluding energy, producer prices rose modestly by 0.9 percent year-over-year. Capital goods saw a 2.0 percent price increase, while non-durable consumer goods edged up by 0.6 percent. In contrast, the prices of intermediate goods, such as wood and metals, showed mixed trends, with significant declines in some areas, like particle boards by minus 12.0 percent, but increases in others, like copper by 10.2 percent. The food sector highlighted stark contrasts, with butter prices soaring by 33.0 percent, while pork prices dropped by 11.5 percent.
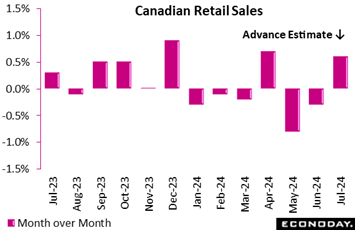 Retail sales in Canada dipped by 0.3 percent in June from May, exactly as expected, which left sales down 0.5 percent for the second quarter. In volume terms, sales rose 0.1 percent on the month. Sales were up a meager 0.2 percent year-over-year. The advance estimate for July sales suggests improvement with an increase of 0.6 percent. Retail sales in Canada dipped by 0.3 percent in June from May, exactly as expected, which left sales down 0.5 percent for the second quarter. In volume terms, sales rose 0.1 percent on the month. Sales were up a meager 0.2 percent year-over-year. The advance estimate for July sales suggests improvement with an increase of 0.6 percent.
In June, when consumer prices appreciated 2.7 percent year-over-year, retail sales decreases were evident in four of nine subsectors, led by weakness in sales at motor vehicles and parts dealers, which fell 2.1 percent on the month, and were down 2.7 percent from a year ago. The other weak link was gas and fuel sales, down 0.5 percent on the month; in volume terms, gas and fuel sales actually rose 2.6 percent.
Core retail sales, which omit gasoline and motor vehicles, rose by 0.4 percent in June from May, and were up 1.2 percent from a year ago.
Core sales were paced by a 1.2 percent increase in sales on the month at food and beverage stores, with supermarket and grocery store sales up 1.8 percent. On the downside, sporting goods and hobby store sales fell 0.8 percent.
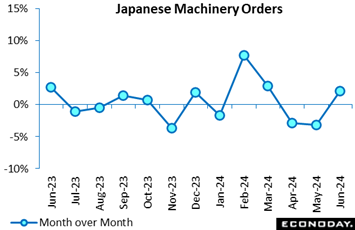 Japanese core machinery orders posted their first increase in three months in June, up 2.1 percent on the month after falling 3.2 percent in May and 2.9 percent in April, backed by the need to digitize and automate operations amid widespread labor shortages. The indicator, which tends to fluctuate sharply from month to month, came in much stronger than the median economist forecast of a 0.9 percent increase. Japanese core machinery orders posted their first increase in three months in June, up 2.1 percent on the month after falling 3.2 percent in May and 2.9 percent in April, backed by the need to digitize and automate operations amid widespread labor shortages. The indicator, which tends to fluctuate sharply from month to month, came in much stronger than the median economist forecast of a 0.9 percent increase.
Yet on a year-over-year basis, orders posted their first drop in four months, down 1.7 percent after increasing 10.8 percent in May. This was much weaker than the consensus forecast of a 7.1 percent increase to underscore the report’s batch of mixed signals.
On the quarter, core orders edged 0.1 percent lower in the April-June period, well above the official projection of a 1.6 percent decrease provided in May. The Cabinet Office projects core orders will rise just 0.2 percent in the July-September quarter and maintained its assessment that "the pickup in machinery orders is pausing."
Orders from manufacturers dipped 0.3 percent on the month in June after rising 1.0 percent in May, while orders from non-manufacturers rebounded 2.4 percent after falling 7.5 percent in May.
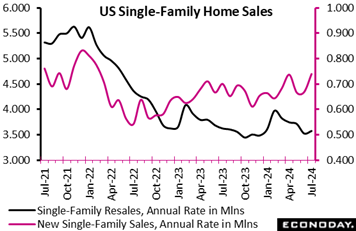 The strongest performance in 2-1/2 years together with sharp upward revisions to prior months repositions new homes as a new force in the US economy. Sales in July jumped nearly 11 percent on the month to a much higher-than-expected 739,000 annualized rate at the same time that the three prior months were revised up by a net 102,000. The strongest performance in 2-1/2 years together with sharp upward revisions to prior months repositions new homes as a new force in the US economy. Sales in July jumped nearly 11 percent on the month to a much higher-than-expected 739,000 annualized rate at the same time that the three prior months were revised up by a net 102,000.
Supply on the market, at 7.5 months at July's sales rate, is down from 8.4 in the two prior months and is at its lowest since July last year. This will raise spirits among home builders and will be lifting forecasts for housing starts and permits.
The median price of a new home jumped to $429,800, up 3.1 percent on the month on top of June's 2.1 percent increase. Distribution is increasingly centered in the under $300,000 bracket, at 18 percent of total sales which is high for this reading and underscores affordability issues for many buyers.
The ongoing downturn in mortgage rates against the backdrop of a healthy labor market offer an increasingly favorable mix for a housing-sector recovery. And leading this recovery is the new home side of the market as the resale side, where prices are high and supply low, continues to lag.
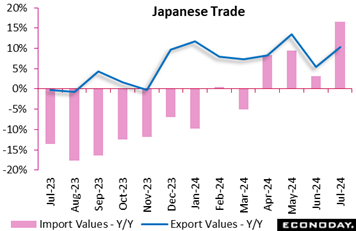 Japanese export values rose 10.3 percent for the eighth straight year-over-year increase in July, led by solid demand for semiconductors, automobiles and semiconductor-making equipment from the US and Asia, accelerating from a 5.4 percent year-over-year gain in June and overcoming continued sluggish shipments of those goods to Europe. Import values surged 16.6 percent for the fourth straight increase, led by drugs, computers and crude oil, following a 3.2 percent rise in June, as the relatively weak yen is keeping import costs high. Japanese export values rose 10.3 percent for the eighth straight year-over-year increase in July, led by solid demand for semiconductors, automobiles and semiconductor-making equipment from the US and Asia, accelerating from a 5.4 percent year-over-year gain in June and overcoming continued sluggish shipments of those goods to Europe. Import values surged 16.6 percent for the fourth straight increase, led by drugs, computers and crude oil, following a 3.2 percent rise in June, as the relatively weak yen is keeping import costs high.
Due to imports, the trade balance recorded a ¥621.8 billion deficit, much wider that the median forecast of a ¥326.5 billion deficit and followed a surplus of ¥223.99 billion in June.
Shipments to China, a key export market for Japanese goods, posted their eighth straight increase thanks to demand for semiconductor-making equipment and autos. Japanese exports to the European Union fell on year for the fourth straight month, hit by lingering sluggish demand for automobiles and production machinery, although shipments of iron and steel rebounded. Exports to the US remain robust, up for the 34th straight month on autos and auto parts, after hitting a record high amount in December 2023.
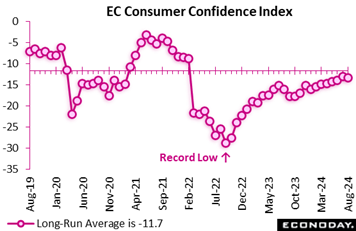 Consumer confidence unexpectedly deteriorated in August, albeit only marginally. At minus 13.4, the EU Commission's provisional index was 0.4 points short of both its July print and the market consensus. This was the first month in which the gauge has not strengthened since January and widens the gap with its long-run average to 1.7 points. Consumer confidence unexpectedly deteriorated in August, albeit only marginally. At minus 13.4, the EU Commission's provisional index was 0.4 points short of both its July print and the market consensus. This was the first month in which the gauge has not strengthened since January and widens the gap with its long-run average to 1.7 points.
The latest outturn leaves intact a very gradually improving trend in sentiment but current levels still seem too soft to promote any significant bounce in household spending. Indeed, retail sales volumes in June were only 0.2 percent above their level at the end of last year. Prospects for the current quarter remain sluggish, all the more so should the ECB not cut interest rates again in September.
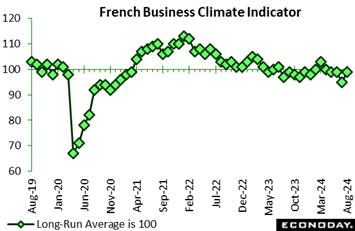 France's manufacturing business climate in August shows mixed results across various sectors. The overall indicator improved to 99, close to its long-term average, up from 95 in July. Key drivers include higher personal production expectations and increased foreign orders, despite a decline in past production levels. France's manufacturing business climate in August shows mixed results across various sectors. The overall indicator improved to 99, close to its long-term average, up from 95 in July. Key drivers include higher personal production expectations and increased foreign orders, despite a decline in past production levels.
The food and beverages indicator rose to 97, the highest since March 2023, thanks to consistent growth in order books. In contrast, the machinery and equipment sector is facing challenges, with its indicator falling to 94, marking the lowest point since November 2020 due to widespread sub-sector declines.
Transport equipment manufacturing has experienced a significant recovery, especially in other transport equipment, reaching unprecedented levels since records began in 1990. However, the motor vehicle sub-sector remains below average. Lastly, other manufacturing has a slight uptick, but remains below the long-term average, with noticeable declines in basic metals and industrial products.
Overall, the manufacturing sector shows resilience with sector-specific variances.
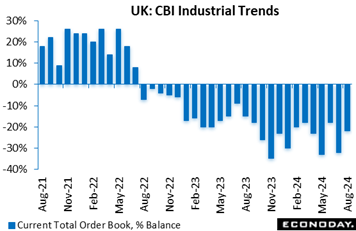 The Confederation of British Industry's trends survey found orders still weak but only in line with expectations though somewhat stronger than in July. At minus 22 percent for August, the headline balance matched the market consensus and was up 10 percentage points from the start of the quarter. However, it remained well below its long-run average of minus 13 percent. The Confederation of British Industry's trends survey found orders still weak but only in line with expectations though somewhat stronger than in July. At minus 22 percent for August, the headline balance matched the market consensus and was up 10 percentage points from the start of the quarter. However, it remained well below its long-run average of minus 13 percent.
Past output (minus 9 percent after minus 3 percent) declined at a slightly faster pace than in July but is expected to expand modestly over the coming three months (9 percent). Expected selling prices (15 percent after 2 percent) accelerated and were above their historic norm while stock adequacy (15 percent after 10 percent) was broadly in line with its long-run mean.
The mixed August results show manufacturing just about keeping its head above water; it should be no surprise that the CBI is calling on the new government to shore up demand and give businesses a reason to grow.
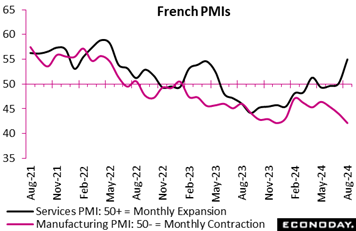 France's private sector witnessed a surprising yet fragile resurgence in August, marking its first expansion since April, driven by a robust performance in services. The composite index climbed to 52.7, its highest since March, indicating overall growth. However, this progress masked underlying weaknesses. Manufacturing continued its downward spiral, with factory orders plummeting at the sharpest rate in four years, dragging overall new business down for a third consecutive month. France's private sector witnessed a surprising yet fragile resurgence in August, marking its first expansion since April, driven by a robust performance in services. The composite index climbed to 52.7, its highest since March, indicating overall growth. However, this progress masked underlying weaknesses. Manufacturing continued its downward spiral, with factory orders plummeting at the sharpest rate in four years, dragging overall new business down for a third consecutive month.
Despite the boost from services, job creation stalled, with employment in manufacturing falling at its fastest pace in over four years. The outlook for the next year also dimmed, as optimism slipped to its lowest level in nearly a year, weighed down by political uncertainty, real estate challenges, and high interest rates.
While cost pressures eased, businesses increased their prices at the quickest rate since January, indicating that inflationary challenges persist. This mixed picture highlights the delicate balance in France's economy, where the strength in services struggles to offset manufacturing woes, casting a shadow over sustained recovery.
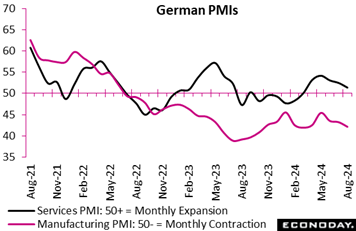 Germany's private sector continued its decline in August, with business activity contracting for the second consecutive month, deepening concerns about the country's economic health. The composite index fell to 48.5, indicating sharper contraction, driven by steep drops in manufacturing and a slowing service sector. New orders declined for the third month, with exports particularly weak, reflecting fragile demand both domestically and abroad. Germany's private sector continued its decline in August, with business activity contracting for the second consecutive month, deepening concerns about the country's economic health. The composite index fell to 48.5, indicating sharper contraction, driven by steep drops in manufacturing and a slowing service sector. New orders declined for the third month, with exports particularly weak, reflecting fragile demand both domestically and abroad.
Employment witnessed its fastest reduction in four years, as companies scaled back in response to diminished prospects. Despite easing cost pressures, especially in services, prices for goods and services rose at the fastest pace in six months, hinting at persistent inflationary challenges. Manufacturers faced stabilizing input costs after a long period of decline, while services saw a slowdown in cost inflation, although this remains above pre-pandemic levels.
The mood among businesses grew more pessimistic, with confidence in future growth hitting its lowest point since January, reflecting worries about economic, political, and geopolitical uncertainties. Overall, the data underscore a bleak outlook for Germany, as weakening demand and rising prices create a challenging environment for recovery.
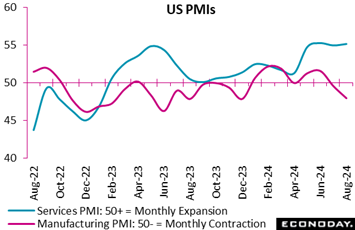 The manufacturing PMI, falling 1.6 points and in contraction at a sub-50 score of 48.0, confirms negative August readings for both the Empire State and Philadelphia Fed manufacturing indexes. Having suffered from Hurricane Beryl in July, the US manufacturing sector appears not to be rebounding so far this month. Yet another decline for the ISM manufacturing index, which fell 1.7 points in July to 46.8, would be no surprise. The manufacturing PMI, falling 1.6 points and in contraction at a sub-50 score of 48.0, confirms negative August readings for both the Empire State and Philadelphia Fed manufacturing indexes. Having suffered from Hurricane Beryl in July, the US manufacturing sector appears not to be rebounding so far this month. Yet another decline for the ISM manufacturing index, which fell 1.7 points in July to 46.8, would be no surprise.
The services PMI by contrast edged 2 tenths higher to a very favorable 55.2 to extend a now 16-month run of plus-50 scores and two straight months in the mid-50s. Demand for services is described as strong and sentiment is upbeat. But an important negative for the sample is a drop in employment, a reading that will capture the attention of forecasters amid uncertainty over the outlook for the August employment report.
Details for manufacturing include a sizable 2.7 point decline for output to a 14-month low at 47.8 with new orders dropping at the sharpest rate of the year. Export orders are at a full year low. Sentiment in this sector is described as "gloomy".
Global data held steady in the underperformance column, ending the week at minus 8 on Econoday’s Relative Performance Index (RPI) and at minus 21 when excluding price data (RPI-P), the latter indicating greater underperformance in real economic activity.
In the Eurozone, economic activity continued to undershoot market forecasts and put the RPI at minus 18 and the RPI-P at minus 32, the latter matching its weakest mark since the start of July. The economy would welcome another ECB ease in September but that would need further proof that inflation is behaving itself.
In the UK, upside and downside surprises effectively cancelled each other out. This left both the RPI and RPI-P at minus 5 and so close enough to zero to indicate overall economic activity performing much as expected. Another cut at the Bank of England’s September meeting hangs in the balance.
In Japan, the RPI (6) and the RPI-P (4) remained in positive surprise territory, but only just. The Bank of Japan still intends to tighten but the broader economic picture continues to argue against any aggressive moves.
There were no significant data releases in China leaving the RPI at minus 29 and the RPI-P at a lowly minus 60. Such levels were not weak enough to prompt another cut in loan prime rates but must at least keep the door open to further monetary easing down the road.
Lifted at week’s end by new home sales, both the RPI and RPI-P for the US ended the week at plus 13 to now indicate that recent US data, which had been flat to underperforming, are now coming in just ahead of Econoday's consensus estimates.
At the top is Canada which is increasingly outperforming, at 37 on the RPI and 42 on the RPI-P in strength that would seem to make a third straight rate cut at the Bank of Canada’s September 4 meeting unnecessary, especially given cooling in consumer prices to 2.5 percent in July.
**Contributing to this article were Jeremy Hawkins, Brian Jackson, Mace News, Max Sato, Olajide Oyadeyi, and Theresa Sheehan
German CPI flashes on Thursday aren’t expected to show much improvement unlike Eurozone flashes on Friday where forecasters see the headline slowing to 2.3 from 2.6 percent with the HICP reading, however, only seen slowing to 2.8 from 2.9 percent. Australian monthly CPI on Wednesday is expected to cool to 3.4 from 3.8 percent in a report that will help set expectations for the Reserve Bank of Australia’s next move.
US durable goods orders on Monday are expected to recover only a portion of June’s sharp decline on aircraft cancellations. US consumer confidence on Tuesday is expected to remain depressed while PCE price indexes on Friday, part of the personal income and outlays report, are expected to show modest pressure on the month (up 0.2 percent) and no more than moderate pressure on the year (up 2.6 percent).
GDPs from India and Canada are both on Friday, with the former expected to slow to 6.9 from 7.8 percent year-over-year growth and the latter expected to slow to monthly growth of 0.1 from 0.2 percent.
Singapore Industrial Production for July (Mon 1300 SGT; Mon 0500 GMT; Mon 0100 EDT)
Consensus Forecast, Month over Month: 4.8%
Consensus Forecast, Year over Year: -0.7%
Industrial production in July is expected to rebound 4.8 percent on the month following an unexpected and sharp 3.8 percent decline in June that was tied to the electronics industry. The year-over-year rate is seen improving to 0.7 percent contraction from 3.9 percent contraction in June.
German Ifo for August (Mon 1000 CEST; Mon 0900 GMT; Mon 0400 EDT)
Consensus Forecast, Business Climate: 86.3
Consensus Forecast, Current Conditions: 86.6
Consensus Forecast, Business Expectations: 86.5
August’s business climate is expected to fall further to 86.3 following July’s 1.6-point fall to 87.0 that compared with expectations for improvement to 89.0. The business climate index has missed the consensus the last three reports in a row.
US Durable Goods Orders for July (Mon 0830 EDT; Mon 1230 GMT)
Consensus Forecast: Month over Month: 4.5%
Consensus Forecast: Ex-Transportation - M/M: 0.0%
Consensus Forecast: Core Capital Goods Orders - M/M: 0.1%
Forecasters see durable goods orders rising 4.5 percent in July following a steep 6.7 percent fall in June that was pulled down by order cancellations for commercial aircraft. Ex-transportation orders are seen unchanged in July with core capital goods, which swung 0.9 percent higher in June, expected to rise 0.1 percent.
Germany: GfK Consumer Climate for September (Tue 0800 CEST; Tue 0600 GMT; Tue 0200 EDT)
Consensus Forecast: -17.9
After August’s much better-than-expected 2.2-point improvement to minus 18.4, the consumer climate index in September is expected to improve further to minus 17.9.
US Consumer Confidence Index for August (Tue 1000 EDT; Tue 1400 GMT)
Consensus Forecast: 100.1
The consumer confidence index in August is expected to remain little changed, at a consensus 100.1 versus 100.3 in July. US confidence has been flat and subdued.
Australian July CPI (Wed 1130 AEST; Wed 0130 GMT; Tue 2130 EDT)
Consensus Forecast, Year over Year: 3.4%
Consumer prices in July are expected to cool to 3.4 percent versus June’s as-expected 3.8 percent rate which was down from May’s 4.0 percent.
Eurozone M3 Money Supply for July (Wed 1000 CEST; Wed 0800 GMT; Wed 0400 EST)
Consensus Forecast, Year-over-Year: 2.6%
The 3-month moving average is expected to increase 2.6 percent in July following June’s 1.7 percent increase that extended a trend of gains consistent with gradual economic recovery.
Australian Second-Quarter Capital Expenditures (Thu 1130 AEST; Thu 0130 GMT; Wed 2130 EDT)
Consensus Forecast, Quarter over Quarter: 1.0%
Capital Expenditures for the second quarter are expected to rise 1.0 percent on the quarter to match the first quarter’s better-than-expected increase.
Eurozone: EC Economic Sentiment for August (Thu 1100 CEST; Thu 0900 GMT; Thu 0500 EDT)
Consensus Forecast: 95.9
Consensus Forecast, Industry Sentiment: -10.8
Consensus Forecast, Consumer Sentiment: -13.4
Economic sentiment in August is expected to be little changed at 95.9 from July’s 95.8 which extended a long flat trend well short of the 100 long-run average.
German CPI, Preliminary August (Thu 1400 CEST; Thu 1200 GMT; Thu 0800 EDT)
Consensus Forecast, Month over Month: 0.1%
Consensus Forecast, Year over Year: 2.2%
HICP, Preliminary August
Consensus Forecast, Month over Month: 0.2%
Consensus Forecast, Year over Year: 2.6%
August’s consensus is a year-over-year 2.2 percent versus 2.3 percent in July and 2.2 percent in June. The consensus for the HICP is 2.6 percent versus 2.6 percent and 2.5 percent in the prior two months.
US International Trade in Goods (Advance) for July (Thu 0830 EDT; Thu 1230 GMT)
Consensus Forecast, Balance: -$98.0 billion
The US goods deficit (Census basis) is expected to widen by $1.4 billion to $98.0 billion in July after narrowing by $2.5 billion in June to $96.6 billion.
Tokyo Consumer Price Index for August (Fri 0830 JST; Thu 2330 GMT; Thu 1930 EDT)
Consensus Forecast, Year over Year: 2.4%
Ex-Fresh Food, Consensus Forecast: 2.3%
Ex-Fresh Food & Energy, Consensus Forecast: 1.4%
Overall inflation in Tokyo is expected to increase 2.4 percent in August following July’s 2.2 percent rate that compared with expectations for 2.3 percent. Underlying rates are expected at 2.3 percent for the ex-fresh food core versus July’s as-expected 2.2 percent and at 1.4 percent for the ex-fresh food ex-energy core-core versus 1.5 percent which was 1 tenth under Econoday’s consensus.
Japanese Industrial Production for July (Fri 0850 JST; Thu 2350 GMT; Thu 1950 EDT)
Consensus Forecast, Month over Month: 3.7%
Consensus Forecast, Year over Year: 2.6%
At a consensus 3.7 percent, industrial production on the month in July is expected to rebound after falling a steep but still lower-than-expected 4.2 percent in June amid safety scandals hitting the auto industry. On a year-over-year basis, July’s growth is expected at 2.6 percent versus 7.9 percent contraction in June.
Japanese Retail Sales for July (Fri 0850 JST; Thu 2350 GMT; Thu 1950 EDT)
Consensus Forecast, Month over Month: 3.0%
Consensus Forecast, Year over Year: 0.2%
Retail sales are expected to accelerate to 3.0 percent on the year in July versus better-than-expected growth of 0.6 percent in June. The government upgraded its assessment in the June report saying sales are “on an uptrend”.
Australian Retail Sales for July (Fri 1130 AEST; Fri 0130 GMT; Thu 2130 EDT)
Consensus Forecast, Month over Month: 0.4%
Retail sales in July are expected to increase 0.4 percent on the month after June’s better-than-expected 0.5 percent increase.
German Unemployment Rate for August (Fri 0955 CEST; Fri 0755 GMT; Fri 0355 EDT)
Consensus Forecast: 6.0%
August’s unemployment rate is expected to hold unchanged at 6.0 percent. Germany’s jobs market has remained tight.
Eurozone HICP Flash for August (Fri 1100 CEST; Fri 0900 GMT; Fri 0500 EDT)
Consensus Forecast, Year over Year: 2.3%
Narrow Core
Consensus Forecast, Year over Year: 2.8%
Consensus for August’s HICP flash is 2.3 percent and 2.8 percent for the narrow core. These would compare respectively with July’s 2.6 and 2.9 percent and June’s 2.5 and 2.9 percent.
Eurozone Unemployment Rate for July (Fri 1100 CEST; Fri 0900 GMT; Fri 0500 EDT)
Consensus Forecast: 6.5%
Consensus for July's unemployment rate is no change at June’s 6.5 percent. The Eurozone labour market has been very tight.
Indian Second-Quarter GDP (Fri 1730 IST; Fri 1200 GMT; Fri 0800 EDT)
Consensus Forecast, Year over Year: 6.9%
Forecasters see GDP coming in at year-over-year growth of 6.9 percent in the June quarter versus higher-than-expected growth of 7.8 percent in the March quarter.
Canadian Monthly GDP for June (Fri 0830 EDT; Fri 1230 GMT)
Consensus Forecast, Month over Month: 0.1%
After a better-than-expected 0.2 percent gain in May that followed a 0.3 percent rise in April, GDP in June is expected to rise 0.1 percent.
Canadian Second-Quarter GDP (Fri 0830 EDT; Thu 1230 GMT)
Consensus Forecast, Annualized: 1.8%
A 1.8 percent annualized growth rate is the consensus for Canadian second-quarter GDP versus 1.7 percent growth in the first quarter.
US Personal Income for July (Fri 0830 EDT; Fri 1230 GMT)
Consensus Forecast, Month over Month: 0.2%
US Consumption Expenditures
Consensus Forecast, Month over Month: 0.5%
US PCE Price Index
Consensus Forecast, Month over Month: 0.2%
Consensus Forecast, Year over Year: 2.6%
US Core PCE Price Index
Consensus Forecast, Month over Month: 0.2%
Consensus Forecast, Year over Year: 2.7%
Personal income is expected to rise 0.2 percent in July with consumption expenditures expected to increase 0.5 percent. These would compare with June’s increases of 0.2 percent for income and 0.3 percent for consumption. Inflation readings for July are expected at monthly increases of 0.2 percent both overall and for the core (versus 0.1 and 0.2 percent in June). Annual rates are expected at 2.6 percent overall and 2.7 percent for the core (versus 2.5 and 2.6 percent in June).
China: CFLP PMIs for August (Sat 0930 CST; Sat 0130 GMT; Fri 2130 EDT)
Manufacturing PMI, Consensus Forecast: 49.3
Non-manufacturing PMI, Consensus Forecast: 50.1
The CFLP manufacturing PMI is expected to hold steady at 49.3 in August from July’s 49.4 which was near expectations and little changed from June’s 49.5. The non-manufacturing PMI, expected at 50.1 versus July’s 50.2, has held above 50 for more than a year.
|
