|
Now that Fed Chair Jerome Powell has given an unmistakable message for a rate cut at the September 17-18 FOMC meeting, chatter will focus on the size and timing of future cuts. Could the FOMC cut rates by 50 basis points rather than 25 as is widely expected? Could they lower the projected path of the funds target? Will the FOMC forecast one or two more cuts in 2024? Will they pick up the pace for future rate hikes in 2025 and 2026?
Some of these questions will hinge on the results of the August employment report on Friday, September 6. The July report surprised on the downside with a nonfarm payroll increase of 114,000 and a net downward revision of 29,000 to the prior two months, combined with a 2 tenths increase in the unemployment rate to 4.3 percent. The results sparked worries that the labor market was cooling more quickly than previously thought, as has the colossal 818,000 downward revision from April last year to March this year. A second below-expectations report could add to the angst.
The second report that will guide rate-cut expectations is the CPI that will be posted the following week. Consensus for this report is still forming but based on the ongoing inflation trend, further if limited cooling would be a good guess.
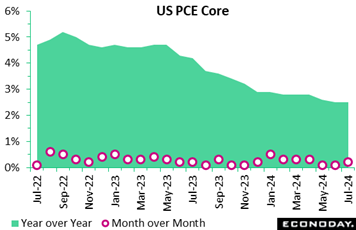 The PCE deflator, not the CPI, is the FOMC's preferred measure of inflation due to its more frequent updating of component weightings. The PCE rose 0.2 percent month-over-month in July after only a 0.1 percent gain in the prior month. The year-over-year increase was 2.5 percent in July, the same as June. The ex-food ex-energy core PCE, arguably the most important policy indicator of all, rose 0.2 percent in July to match June's gain. Compared to a year ago, the core was up 2.6 percent, also the same as in June. These were generally in line with Econoday’s consensus estimates with the annual core rate, though only unchanged, still 1 tenth below expectations. The PCE deflator, not the CPI, is the FOMC's preferred measure of inflation due to its more frequent updating of component weightings. The PCE rose 0.2 percent month-over-month in July after only a 0.1 percent gain in the prior month. The year-over-year increase was 2.5 percent in July, the same as June. The ex-food ex-energy core PCE, arguably the most important policy indicator of all, rose 0.2 percent in July to match June's gain. Compared to a year ago, the core was up 2.6 percent, also the same as in June. These were generally in line with Econoday’s consensus estimates with the annual core rate, though only unchanged, still 1 tenth below expectations.
July’s numbers continue the story of incremental disinflation that is finally reaching items in the non-housing services sector, not just commodity prices. The report will add to policymaker confidence that the time has come to reduce restrictive monetary policy with a rate cut at the September 18 announcement. How big a cut? Watch for August’s CPI, released a week ahead of the FOMC on September 11, for the answer.
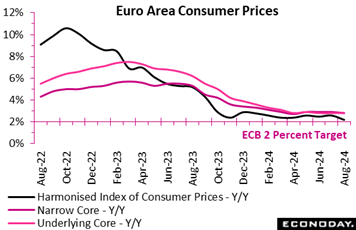 Inflation in the Euro Area provisionally decelerated a little faster than expected in August. Prices were up 0.2 percent on the month, reducing the yearly rate from July's final 2.6 percent to 2.2 percent, a tick less than Econoday’s consensus and matching its lowest reading since June 2021. The rate now stands just 0.2 percentage points above its medium-term target. Inflation in the Euro Area provisionally decelerated a little faster than expected in August. Prices were up 0.2 percent on the month, reducing the yearly rate from July's final 2.6 percent to 2.2 percent, a tick less than Econoday’s consensus and matching its lowest reading since June 2021. The rate now stands just 0.2 percentage points above its medium-term target.
Yet news on core rates were more mixed. On the positive side, the narrowest measure dipped from 2.9 percent to 2.8 percent, in line with forecasts and its weakest mark since February 2022. By contrast, the wider measure excluding just energy and unprocessed food was again steady at 2.8 percent. Moreover, services saw an unwelcome 0.2 percentage point rise to 4.2 percent, a 10-month high. Elsewhere, non-energy industrial goods inflation eased from 0.7 percent to just 0.4 percent while energy (minus 3.0 percent after 1.2 percent) and, to a lesser extent, food, alcohol and tobacco (2.4 percent after 2.3 percent) accelerated.
Regionally, harmonised inflation fell in France (2.2 percent after 2.7 percent), Germany (2.0 percent after 2.6 percent), Italy (1.3 percent after 1.6 percent) and Spain (2.4 percent after 2.9 percent).
The headline results should go down very well at the European Central Bank but the relative stickiness of core and service-sector prices will be a problem for policy hawks. A cut in key interest rates at the September 12 meeting is still a probability but isn’t guaranteed, and a move then is likely to be accompanied by a statement indicating that further progress would be needed for any additional easing.
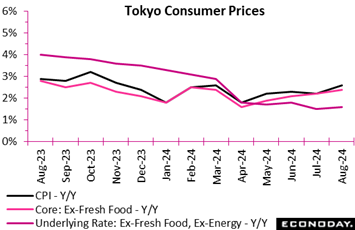 Consumer inflation in Tokyo came in firmer than expected but that doesn't mean the Bank of Japan will have to raise interest rates at a faster pace as its policy stance is linked to medium-term inflation expectations, not short-term results. Consumer inflation in Tokyo came in firmer than expected but that doesn't mean the Bank of Japan will have to raise interest rates at a faster pace as its policy stance is linked to medium-term inflation expectations, not short-term results.
The core CPI (excluding fresh food) rose 2.4 percent on year, just above the consensus call of a 2.3 percent increase, following a 2.2 percent gain in July. The government ended its 18-month-long subsidies in June for July bill payments while high temperatures of around 40 degrees Celsius boosted prices for air conditioners.
A surge in fresh food prices drove the year-over-year rise in the total CPI to 2.6 percent from July's 2.2 percent as the heat wave has caused an unusual short supply of rice, leading to the sharpest price markup for the primary staple in 20 years. The annual rate for the core-core CPI (excluding fresh food and energy) crept up to 1.6 percent from 1.5 percent in July as the costs for processed food markups picked up again after easing in recent months.
National CPI data for the month of August will be released on September 20 local time, the same date as the Bank of Japan’s next meeting.
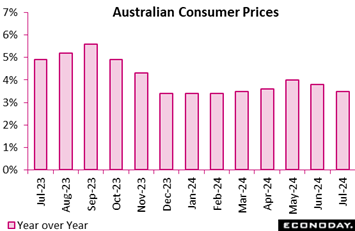 Monthly CPI data show headline inflation in Australia fell from 3.8 percent in June to 3.5 percent in July, just above the consensus forecast of 3.4 percent. This is the second consecutive decline in headline inflation and takes the level closer to the Reserve Bank of Australia's target range of 2.0 percent to 3.0 percent. Monthly CPI data show headline inflation in Australia fell from 3.8 percent in June to 3.5 percent in July, just above the consensus forecast of 3.4 percent. This is the second consecutive decline in headline inflation and takes the level closer to the Reserve Bank of Australia's target range of 2.0 percent to 3.0 percent.
July’s fall in headline inflation was largely driven by energy costs, with the year-over-year increase in automotive fuel prices slowing from 6.6 percent to 4.0 percent and electricity prices falling 5.1 percent after a previous increase of 7.5 percent. This fall in electricity prices was driven by government rebates, and were it not for these rebates, electricity prices would have risen by 0.9 percent on the year in July. Clothing prices and rents also rose at a slower pace, partly offset by bigger price increases for food and communications. Price increases were steady for other major categories, including health, education and insurance and financial services.
July’s data show a moderation in underlying price pressures. The measure of inflation that excludes volatile items – including fuel and holiday travel – fell from 4.0 percent in June to 3.7 percent in July while the monthly trimmed mean measure fell from 4.1 percent to 3.8 percent.
At the RBA's previous meeting, held early in the month, officials highlighted uncertainties impacting the inflation outlook and again reiterated that returning inflation to target remains their highest priority. Officials also advised that they see little prospect of reducing policy rates over the rest of the year. Though July’s update showing a moderation in underlying prices pressures will be welcomed by officials, the results are unlikely to shift that assessment.
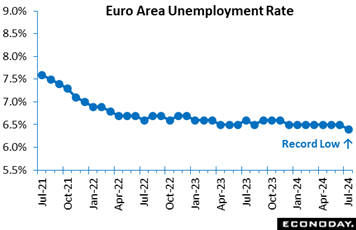 Joblessness fell in July. A 14,000 decline followed a revised 3,000 drop in June and reduced the jobless rate to 6.4 percent, a tick short of the consensus and, courtesy of earlier revisions, a new record low. Joblessness fell in July. A 14,000 decline followed a revised 3,000 drop in June and reduced the jobless rate to 6.4 percent, a tick short of the consensus and, courtesy of earlier revisions, a new record low.
However, for most of the larger Eurozone countries, the market was more stable and national rates were only flat in France (7.5 percent), Germany (3.4 percent) and Spain (11.5 percent). Italy (6.5 percent after 6.9 percent) essentially accounted for the dip in the overall rate.
Even so, the July data provide the ECB with a fresh warning about the lack of slack in the region's labour market. As such, it will make wage developments all the more important to upcoming policy decisions.
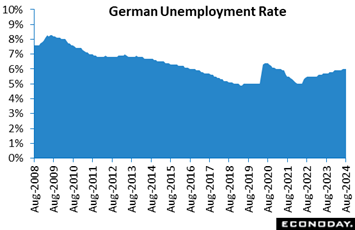 The employment picture in Europe’s single largest economy, however, is showing cracks. Despite a steady 6.0 percent unemployment rate. the country’s labour market showed clear signs of continued strain in August as unemployment rose for the 20th consecutive month. The number of unemployed edged higher to 2.801 million from 2.799 million, keeping the unemployment rate steady at 6.0 percent. Though limited in August, this sustained increase in unemployment, coupled with a decrease in job vacancies, down by 10,000 in August after an 8,000 drop in July, highlights a concerning trend of weakening demand for new hires. The employment picture in Europe’s single largest economy, however, is showing cracks. Despite a steady 6.0 percent unemployment rate. the country’s labour market showed clear signs of continued strain in August as unemployment rose for the 20th consecutive month. The number of unemployed edged higher to 2.801 million from 2.799 million, keeping the unemployment rate steady at 6.0 percent. Though limited in August, this sustained increase in unemployment, coupled with a decrease in job vacancies, down by 10,000 in August after an 8,000 drop in July, highlights a concerning trend of weakening demand for new hires.
These figures confirm that the German economy is facing significant challenges. The persistent rise in unemployment may point to broader economic issues such as slowing growth. The decline in job vacancies indicates that companies are cautious about expanding their workforce, potentially due to declining business confidence.
For the German economy, these developments could imply slower consumer spending, as higher unemployment often leads to reduced household income and spending power. Additionally, a less dynamic labour market might affect overall economic productivity and growth, creating a challenging environment for policymakers. Addressing these labour market issues will be crucial to bolstering economic resilience and ensuring sustainable recovery in the months ahead.
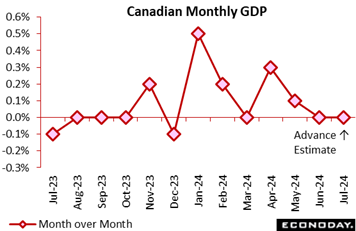 Canadian GDP rose 0.5 percent on the quarter in the second quarter for an annualized rate of 2.1 percent, both respectable but it’s the monthly results for June, the last month of the quarter, and the preliminary outlook for July, the first month of the third quarter, that point to lack of momentum. Canadian GDP rose 0.5 percent on the quarter in the second quarter for an annualized rate of 2.1 percent, both respectable but it’s the monthly results for June, the last month of the quarter, and the preliminary outlook for July, the first month of the third quarter, that point to lack of momentum.
A monthly 0.4 percent fall for goods-producing industries pulled down June as gains for utilities and agriculture only partially offset declines in manufacturing and construction. Services-producing industries rose 0.1 percent for a third straight increase.
The goods decline was led by a 2.4 percent fall for durables manufacturing which was the largest since April 2021 with the level of production the lowest since November 2021. The drop reflected retooling at US assembly plants and related suspension of production at Canadian plants. When the plants reopen, GDP should get a boost but that didn’t keep the outlook for July’s GDP from being flat. Construction fell 0.6 percent in June to its lowest level since January 2021.
Quarter-over-quarter rates were more favorable. Goods-producing industries rose 0.4 percent with service-producing industries up 0.6 percent. Overall, 15 of 20 sectors posted second-quarter gains.
The public sector, boosted by educational services as well as health care and social assistance, rose 1.0 percent on the quarter and was the largest contributor for a second straight quarter. Mining, quarrying, and oil and gas extraction rose 2.5 percent for its best showing since the second quarter of 2022. Oil and gas led the growth.
Other sectors of note include finance and insurance, up 0.8 percent for its best showing since third quarter 2021 and reflecting what Statistics Canada said was anticipation of Bank of Canada rate cuts. On the downside, construction fell 0.4 percent with residential construction down 1.9 percent. Manufacturing fell 0.2 percent for its fourth straight decline.
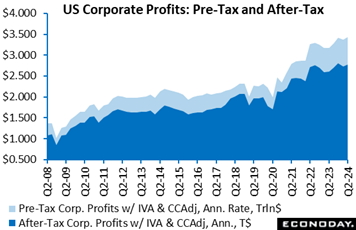 At an annualized rate of $3.229 trillion in the first estimate for the second quarter, year-over-year after-tax corporate profits in the US rose a strong 11.2 percent compared to last year's second quarter. This exceeds 10.0 percent growth in the first quarter. When including inventory valuation and consumption adjustments, after-tax profits of $3.425 trillion in the second quarter were up 6.6 percent on the year. This compares with 5.3 percent previously. Taxes on corporate income, at a $650.8 billion annual rate in the second quarter and which are calculated on this basis, were up 14.1 percent year-over-year versus an 11.1 percent increase in the first quarter. At an annualized rate of $3.229 trillion in the first estimate for the second quarter, year-over-year after-tax corporate profits in the US rose a strong 11.2 percent compared to last year's second quarter. This exceeds 10.0 percent growth in the first quarter. When including inventory valuation and consumption adjustments, after-tax profits of $3.425 trillion in the second quarter were up 6.6 percent on the year. This compares with 5.3 percent previously. Taxes on corporate income, at a $650.8 billion annual rate in the second quarter and which are calculated on this basis, were up 14.1 percent year-over-year versus an 11.1 percent increase in the first quarter.
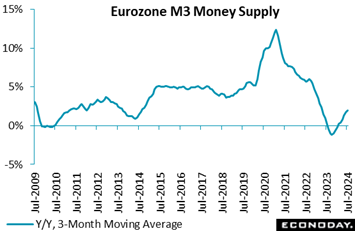 Annual M3 growth was unchanged at 2.3 percent in July, its strongest reading since February 2023 and lifting the headline 3-month moving average rate, as tracked in the graph, from 1.7 percent to 2.0 percent. This was just a tick short of Econoday’s consensus. Monthly growth was minus 0.2 percent. Annual M3 growth was unchanged at 2.3 percent in July, its strongest reading since February 2023 and lifting the headline 3-month moving average rate, as tracked in the graph, from 1.7 percent to 2.0 percent. This was just a tick short of Econoday’s consensus. Monthly growth was minus 0.2 percent.
As usual, the acceleration was dominated by narrow money M1 where the yearly rate of contraction eased from minus 3.4 percent to minus 3.1 percent. Amongst the main M3 counterparts, private sector loans were up 1.1 percent on the year after a 0.9 percent increase in June. Adjusted for the effects of transfers to and from MFI balance sheets as well as for notional cash pooling services, the rate increased from 1.1 percent to 1.3 percent, its fastest pace since July last year. Within this, lending to households climbed from 0.3 percent to 0.5 percent as borrowing for consumption picked up from 2.8 percent to 3.0 percent. Loans for house purchase were also a tick firmer at 0.5 percent but borrowing by non-financial corporations slipped from 0.7 percent to 0.6 percent, its first fall since April.
Overall, the July update is a little softer than anticipated but it remains in line with sluggish Eurozone growth. A cut in key ECB interest rates in September remains a probability.
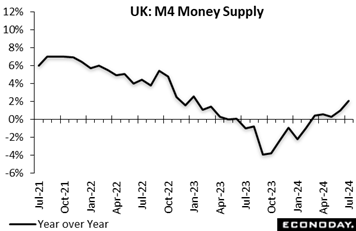 Broad money in the UK rose 0.3 percent on the month in July following a 0.5 percent increase in June. The advance lifted annual growth from 1.0 percent to 2.1 percent, a 3-month high that means M4 has now expanded in five of the last six months. The key lending counterpart was also up a monthly 0.3 percent, lifting yearly growth from 1.1 percent to 1.4 percent. Broad money in the UK rose 0.3 percent on the month in July following a 0.5 percent increase in June. The advance lifted annual growth from 1.0 percent to 2.1 percent, a 3-month high that means M4 has now expanded in five of the last six months. The key lending counterpart was also up a monthly 0.3 percent, lifting yearly growth from 1.1 percent to 1.4 percent.
Excluding intermediate other financial institutions, M4 climbed 0.4 percent versus June nudging up annualised 3-monthly growth from 2.5 percent to 2.6 percent but this was only a 2-month peak. Similarly-adjusted lending also rose 0.4 percent on the month. Underlying trends remain positive but still quite subdued.
Elsewhere, in the housing market, mortgage approvals increased from 60,611 to 61,985, their strongest print since September 2022, while lending picked up from £2.63 billion to £2.79 billion, its best mark since December 2022. At the same time, overall consumer credit rose £1.215 billion after a £0.869 billion gain last time.
July's financial data remain consistent with respectable economic growth and so further ease pressure on the Bank of England to rush into another cut in Bank Rate next month.
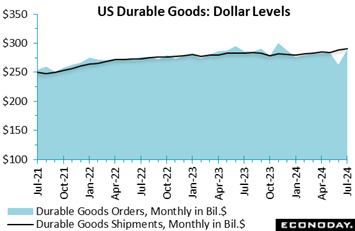 Durable goods orders in the US jumped 9.9 percent in July to $289.7 billion thanks to a giant surge in commercial aircraft which jolted from $4.2 billion monthly contraction in June (tied to order cancellations) to a $23.4 billion gain. Excluding aircraft and all other transportation equipment, orders fell 0.2 percent to underscore what is a soft period for the US manufacturing sector. Further underscoring weakness are core capital goods orders (nondefense ex-aircraft) which fell 0.1 percent in July with June revised substantially lower to a 0.5 percent gain to halve the initial indication. Durable goods orders in the US jumped 9.9 percent in July to $289.7 billion thanks to a giant surge in commercial aircraft which jolted from $4.2 billion monthly contraction in June (tied to order cancellations) to a $23.4 billion gain. Excluding aircraft and all other transportation equipment, orders fell 0.2 percent to underscore what is a soft period for the US manufacturing sector. Further underscoring weakness are core capital goods orders (nondefense ex-aircraft) which fell 0.1 percent in July with June revised substantially lower to a 0.5 percent gain to halve the initial indication.
Machinery orders were unchanged in July with orders for computers and electronic products down 0.7 percent and orders for electrical equipment down 0.4 percent. Orders for motor vehicles and parts fell 2.6 percent following June's 0.7 percent decline, a result that points to summertime trouble for the domestic auto industry. One of the isolated positives in the report is a 12.9 percent rise in new orders for defense aircraft which however, at $5.5 billion, is a small fraction in size compared to other categories especially commercial aircraft.
Shipments of durable goods are a clear positive, up 1.1 percent on top of June's 1.2 percent rise, while unfilled orders rose 0.2 percent in the month but barely cut into June's 1.4 percent contraction that was tied to commercial aircraft cancellations. Inventories of durable goods edged 0.1 percent higher in July to offset June's 0.1 percent draw.
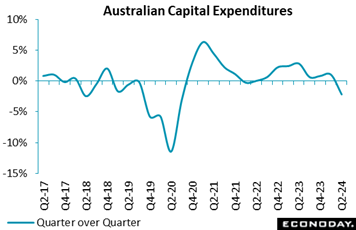 Australia's survey of private capital expenditures shows spending in this category fell 2.2 percent on the quarter (volumes, seasonally adjusted) in the three months to June, weakening from an increase of 1.0 percent in the three months to March. Private capex rose just 0.3 percent on the year in the June quarter after advancing 5.5 percent previously. Australia's survey of private capital expenditures shows spending in this category fell 2.2 percent on the quarter (volumes, seasonally adjusted) in the three months to June, weakening from an increase of 1.0 percent in the three months to March. Private capex rose just 0.3 percent on the year in the June quarter after advancing 5.5 percent previously.
Weaker headline capex growth reflected weaker growth in both major categories. Spending on equipment plant and machinery fell 0.5 percent on the quarter after a previous increase of 3.3 percent while spending on buildings and structures fell 3.8 percent after a previous decline of 0.9 percent. Conditions were again mixed on a sectoral basis, with capex increasing by 1.5 percent on the quarter in the mining sector and falling by 3.6 percent in the non-mining sector.
The second-quarter release included the survey's revised forecast for private capex in the 2023-24 fiscal year (in value terms ending July 30). Officials now expect it to be A$182.0 billion, up 0.5 percent from the previous estimate made three months earlier of A$180.6 billion and also up from A$165.1 billion, the actual amount of spending in the 2022-23 fiscal year. Officials have also revised their estimate for capex in the 2024-25 fiscal year to $170.7 billion, up 10.3 percent from their previous estimate of A$155.4 billion.
The capex survey covers around 60 percent of total business investment in Australia. More comprehensive information about the recent strength of investment will be published in the GDP report for this quarter, scheduled for release in the coming week.
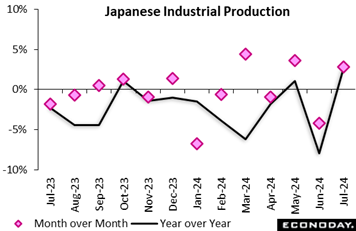 Japan's industrial production rebounded 2.8 percent on the month in July after slumping a downwardly revised 4.2 percent in June following a 3.6 percent gain in May. The increase was widespread (14 out of 15 industries) led by telecom equipment and production machines but it was softer than the median economist forecast of a 3.7 percent rise. The METI's survey of producers indicated output is set to show a setback, down 0.9 percent in August and a further 3.3 percent decline in September. Japan's industrial production rebounded 2.8 percent on the month in July after slumping a downwardly revised 4.2 percent in June following a 3.6 percent gain in May. The increase was widespread (14 out of 15 industries) led by telecom equipment and production machines but it was softer than the median economist forecast of a 3.7 percent rise. The METI's survey of producers indicated output is set to show a setback, down 0.9 percent in August and a further 3.3 percent decline in September.
From a year earlier, factory output rebounded 2.7 percent, as largely expected, following a downwardly revised 7.9 percent plunge in June and a 1.1 percent rise in May.
The ministry upgraded its assessment, saying industrial output is "taking one step forward and one step back" Previously, it said, output "has weakened while taking one step forward and one step back."
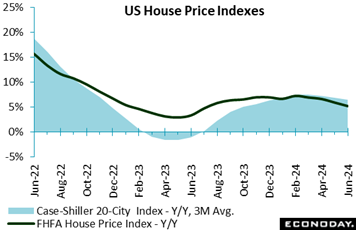 US resale prices cooled but remained strong in June, up 0.4 percent for Case-Shiller's 20-city adjusted index and up 0.6 percent unadjusted. On a year-over-year basis, unadjusted prices rose 6.5 percent, a rate that is roughly double that of consumer inflation though down from May's 6.9 percent. US resale prices cooled but remained strong in June, up 0.4 percent for Case-Shiller's 20-city adjusted index and up 0.6 percent unadjusted. On a year-over-year basis, unadjusted prices rose 6.5 percent, a rate that is roughly double that of consumer inflation though down from May's 6.9 percent.
New York leads the 20-city sample with annual appreciation of 9.0 percent followed by San Diego at 8.7 percent and Las Vegas as 8.5 percent. Portland remains in the rear at only 0.8 percent appreciation.
Looking at affordability, the report notes that low-price tiers have been rising in price faster than the overall market especially for New York where, over the past five years, the low tier has risen nearly 20 percent above the overall market. With mortgage rates moving lower in July and August, home affordability is improving.
The FHFA house price index for June, a separate indicator, edged 0.1 percent lower month-over-month after holding unchanged in May. Year-over-year, the index rose 5.1 percent year-over-year.
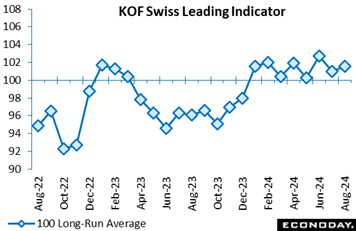 Switzerland’s leading indicator index rose in mid-quarter but reversed only a portion of the previous period's 2.1 point decline. At 101.6, the August reading was a point above both its downwardly revised July print and the market consensus. It remains just above the 100 long-run average. Switzerland’s leading indicator index rose in mid-quarter but reversed only a portion of the previous period's 2.1 point decline. At 101.6, the August reading was a point above both its downwardly revised July print and the market consensus. It remains just above the 100 long-run average.
The monthly gain was mainly attributable to stronger performances by the consumer sector, construction industry and the other services sector. To a lesser extent, manufacturing and hospitality also contributed positively. Improvements here more than offset a modest deterioration in financial and insurance services. Foreign demand was broadly flat.
In sum, the August report again points to moderate growth of GDP over coming months.
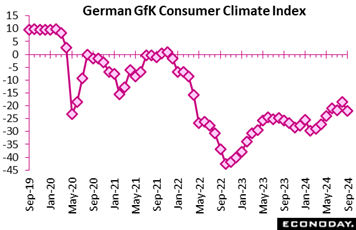 After a brief surge, consumer confidence in Germany took a sharp downturn in the outlook for September, dampened by declining income expectations and a slight rise in the propensity to save. The consumer climate index dropped by 3.4 points, indicating a pervasive sense of economic pessimism. The conclusion of the UEFA European Championship seems to have ended the temporary uplift in sentiment, leaving behind worries about job security and an uncertain economic outlook. After a brief surge, consumer confidence in Germany took a sharp downturn in the outlook for September, dampened by declining income expectations and a slight rise in the propensity to save. The consumer climate index dropped by 3.4 points, indicating a pervasive sense of economic pessimism. The conclusion of the UEFA European Championship seems to have ended the temporary uplift in sentiment, leaving behind worries about job security and an uncertain economic outlook.
Income expectations saw a steep decline, plummeting by 16.2 points to a meager 3.5, signaling growing financial concerns among households. This drop mirrors the anxieties last seen two years ago when inflation eroded purchasing power. Coupled with a minor increase in unemployment and company insolvencies, consumers are now more cautious, evident in the slight decrease in their propensity to buy.
With the prospect of a weakened economy and rising recession fears, hopes for a steady recovery seem distant. As job security worries mount, German consumers are likely to remain wary, further stalling economic momentum.
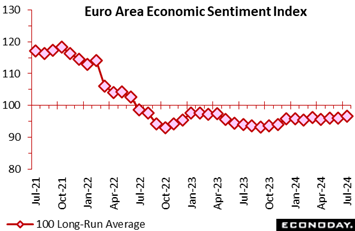 Economic sentiment improved by more than expected this month. At 96.6, the headline gauge rose 0.6 points versus a marginally firmer revised July but remains well short of its 100 long-run average. The trend is still little more than flat. Economic sentiment improved by more than expected this month. At 96.6, the headline gauge rose 0.6 points versus a marginally firmer revised July but remains well short of its 100 long-run average. The trend is still little more than flat.
At a sector level, confidence strengthened in industry (minus 9.7 after minus 10.4), services (6.3 after 5.0) and in retail trade (minus 8.1 after minus 9.1). However, there were modest losses in both the household sector (minus 13.5 after minus 13.0) and construction (minus 6.5 after minus 6.4).
Regionally, national sentiment worsened in Germany (90.5 after 92.2) and Italy (98.9 after 100.1) but improved sharply in France (99.4 after 95.1) and also made ground in Spain (105.4 after 104.1). Accordingly, among the four larger economies, only Spain is now on the right side of the common 100 historic mean.
Inflation expectations were mixed. Hence, expected selling prices in manufacturing fell from 6.7 to 6.1 and so fully unwound July's spike but edged minimally firmer in services (12.4 after 12.3). At the same time, inflation expectations in the consumer sector (11.3) were unchanged and matched an 8-month low.
The August update points to another month of at best modest growth of Eurozone GDP. Consequently, with inflation expectations seemingly reasonably well anchored, financial markets should continue to discount another 25 basis point cut in key ECB interest rates in September.
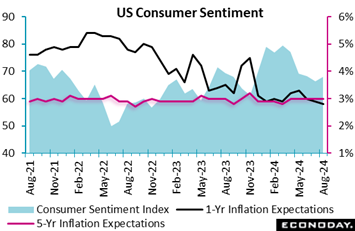 Consumer sentiment in the US held the steady the last two weeks of the month, indicated by little change in the final August index at 67.9 versus the mid-month flash to 67.8. The index posted a gain from July's 66.4 but is down from 69.4 a year ago and remains historically depressed. Consumer sentiment in the US held the steady the last two weeks of the month, indicated by little change in the final August index at 67.9 versus the mid-month flash to 67.8. The index posted a gain from July's 66.4 but is down from 69.4 a year ago and remains historically depressed.
Very favorable readings – specifically for the Federal Reserve and in line with the July PCE results – are inflation expectations which edged down a tenth for the year-ahead outlook to 2.8 percent and remained steady for a fifth straight month for the 5-year outlook at 3.0 percent. Steady and well anchored medium-term inflation expectations are what the Fed wants most and the latter reading offers strong assurances that rate cuts can begin.
On sentiment and the ongoing election, the report notes that Democrats in its sample posted a 10 percent gain in the month while Republicans posted a 10 percent decline. The report further notes that this pattern, which includes a slight rise for Independents, reflects "a sea change in election expectations" with Harris emerging as the Democratic candidate.
Global economic data continue to underperform expectations, at minus 10 on Econoday’s Relative Performance Index and at minus 21 when excluding price data (RPI-P). The latter offers an indication on real economic activity which has been subpar for nearly the whole of August.
But the Eurozone is outperforming and financial markets remain confident that the European Central Bank will cut key interest rates at its September 12 meeting. However, still sticky core and services inflation along with a new record low jobless rate helped lift the region’s RPI and RPI-P to 14 and 22 respectively in strength that suggests there is still room for disappointment, that the ECB may not cut after all.
In the UK, a majority of downside surprises ensured that both the RPI (minus 19) and RPI-P (minus 14) remained below zero. Both readings will help to support speculation about a possible second straight ease by the Bank of England at its September 19 meeting, but the decision is likely to be very close again.
In Switzerland, more than two months of marked economic underperformance ended as the RPI climbed to minus 1 and the RPI-P to exactly zero. Even so, the latest data show activity only matching what have been modest market expectations and keep alive the chances of a third successive cut in the Swiss National Bank’s policy rate on September 26.
In Japan, the latest data point to moderate growth and higher inflation. However, surprises were still biased to the downside and reduced the RPI to minus 26 and the RPI-P to minus 57. Such readings will not add to pressure on the Bank of Japan to tighten again even though the medium-term outlook for interest rates is still up.
Canada went into the week at 37 and 42 on the RPI readings and was slowed down only slightly by the mixed GDP data, to 32 overall and 35 for the RPI-P. These are still very solid readings that won’t be increasing pressure on the Bank of Canada to further cut rates at its Wednesday, September 4 meeting.
The US entered the week with a slight upward bias at plus 13 for both readings but ended the week with a slight downward bias, at minus 7 and minus 11. Though there is still the August employment report and the August CPI still to go before the Federal Reserve’s September 18 announcement, a rate cut has been conclusively signaled.
**Contributing to this article were Jeremy Hawkins, Brian Jackson, Mace News, Max Sato, Olajide Oyadeyi, and Theresa Sheehan
The Bank of Canada on Wednesday is expected to cut its policy rate by 25 basis points for a third meeting in a row, this despite better-than-expected second-quarter growth of 2.1 percent. The US employment report on Friday is the other big event, expected to rebound 160,000 for nonfarm payroll growth following July’s disappointing 114,000 gain.
Other data will include Swiss consumer prices and GDP on Tuesday, both expected to remain unchanged at 1.3 percent year-over-year and 0.5 percent quarter-over-quarter, respectively. German manufacturing orders on Wednesday are expected to fall back in July after jumping higher in June with German industrial production on Friday likewise expected to fall back after rising in June.
China: CFLP PMIs for August (Sat 0930 CST; Sat 0130 GMT; Fri 2130 EDT)
Manufacturing PMI, Consensus Forecast: 49.4
Non-manufacturing PMI, Consensus Forecast: 50.1
The CFLP manufacturing PMI is expected to hold steady at 49.4 August, unchanged from July and little changed from June’s 49.5. The non-manufacturing PMI, expected at 50.1 versus July’s 50.2, has held above 50 for more than a year.
China: S&P Manufacturing PMI for August (Mon 0945 CST; Mon 0145 GMT; Sun 2145 EDT)
Consensus Forecast: 50.0
After unexpectedly falling 2 points to 49.8 in July, S&P's manufacturing PMI in August is expected to recover marginally to breakeven 50.0.
Switzerland: SVME PMI for August (Mon 0930 CEST; Mon 0730 GMT; Mon 0330 EDT)
Consensus Forecast: 43.7
The SVME PMI is expected to come in at 43.7 in August, up only marginally from July’s 43.5.
Korean CPI for August (Tue 0800 KST; Mon 2300 GMT; Mon 1900 EDT)
Consensus Forecast, Month over Month: 0.2%
Consensus Forecast, Year over Year: 1.9%
Consumer prices in August, which in July rose to 2.6 from 2.4 percent, are expected to fall to 1.9 percent. The monthly rate is seen slowing to 0.2 from 0.3 percent.
Swiss CPI for August (Tue 0830 CEST; Tue 0630 GMT; Tue 0230 EDT)
Consensus Forecast, Year over Year: 1.3%
Consumer prices are expected to hold steady at a low 1.3 percent in August.
Swiss Second-Quarter GDP (Tue 0900 CEST; Tue 0700 GMT; Tue 0300 EDT)
Consensus Forecast, Quarter over Quarter: 0.5%
Second-quarter GDP is expected to rise a quarterly 0.5 percent that would match stronger-than-expected expansion of 0.5 percent in the first quarter.
US: ISM Manufacturing Index for August (Tue 1000 EDT; Tue 1400 GMT)
Consensus Forecast: 47.5
After falling 1.7 points to 46.8 in July for its lowest score of the year, ISM manufacturing is expected to rebound 0.7 points to 47.5 in August. This index has missed Econoday’s consensus estimate the last four reports in a row.
Australian Second-Quarter GDP (Wed 1130 AEST; Wed 0130 GMT; Tue 2130 EDT)
Consensus Forecast, Quarter over Quarter: 0.2%
Consensus Forecast, Year over Year: 0.9%
Second-quarter GDP is expected to rise a quarterly 0.2 percent for year-over-year expansion of 0.9 percent. First-quarter results were marginal 0.1 percent growth on the quarter and 1.1 percent growth on the year.
China: S&P PMI Composite for August (Wed 0945 CST; Wed 0145 GMT; Tue 2145 EDT)
Services Index, Consensus Forecast: 52.1
S&P's services PMI in August is expected to hold at July’s better-than-expected 52.1 that compared with June’s 51.2.
Eurozone PPI for July (Wed 1100 CEST; Wed 1000 GMT; Wed 0500 EDT)
Consensus Forecast, Month over Month: 0.3%
Consensus Forecast, Year over Year: -2.5%
Producer prices have been climbing out of deep contraction and are expected to improve to minus 2.5 percent on the year in July from minus 3.2 percent in June. The monthly showing, at a consensus gain of 0.3 in July, rose 0.5 percent in June.
Canada Merchandise Trade Balance for July (Wed 0830 EDT; Wed 1230 GMT)
Consensus Forecast: C$0.9 billion
July’s trade balance is seen in surplus of C$0.9 billion versus June’s surplus of C$0.6 billion and May’s deficit of C$1.6 billion.
Bank of Canada Announcement (Wed 0945 EDT; Wed 1345 GMT)
Consensus Forecast, Change: -25 basis points
Consensus Forecast, Level: 4.25%
With inflation having moderated to 2.5 percent and despite respectable annualized second-quarter GDP growth of 2.1 percent, the Bank of Canada is expected to cut its policy by 25 basis points for a third meeting in a row.
Australian International Trade in Goods for July (Thu 1130 AEST; Thu 0130 GMT; Wed 2130 EDT)
Consensus Forecast, Balance: A$5.0 billion
Consensus for international trade in goods in July is a surplus of A$5.0 billion versus June’s A$5.6 billion surplus that compared with expectations for A$5.0 billion.
German Manufacturing Orders for July (Thu 0800 CEST; Thu 0600 GMT; Thu 0200 EDT)
Consensus Forecast, Month over Month: -1.8%
Manufacturing orders are expected to decrease a monthly 1.8 percent in July versus June’s 3.9 percent swing higher that was led by the auto sector.
Taiwan CPI for August (Thu 1600 CST; Thu 0800 GMT; Thu 0400 EDT)
Consensus, Year over Year: 2.2%
Consumer prices in August are expected to rise 2.2 percent versus July’s 2.52 percent year-over-year rate.
Eurozone Retail Sales for July (Thu 1100 CEST; Thu 0900 GMT; Thu 0500 EDT)
Consensus Forecast, Month over Month: 0.1%
Consensus Forecast, Year over Year: 0.1%
Retail sales volumes in July are expected to rise 0.1 percent on the month after June’s unexpectedly weak 0.3 percent fall. The annual rate is also seen at 0.1 percent which would also compare with minus 0.3 percent.
US ADP Private Payrolls for August (Thu 0815 EDT; Thu 1215 GMT)
Consensus Forecast: 135,000
Forecasters see ADP's August employment number at 135,000. This would compare with July growth in private payrolls reported by the Bureau of Labor Statistics of 97,000. ADP’s number for July was 122,000.
Japanese Household Spending for July (Fri 0830 JST; Thu 2330 GMT; Thu 1930 EDT)
Consensus Forecast , Month over Month: -0.6%
Consensus Forecast , Year over Year: 1.0%
Real household spending in July is expected to increase 1.0 percent on the year versus a 0.1 percent rise in a June report, however, that showed strength in core readings.
German Industrial Production for July (Fri 0800 CEST; Fri 0600 GMT; Fri 0200 EDT)
Consensus Forecast, Month over Month: -0.2%
Consensus Forecast, Year over Year: -2.9%
Industrial production in July is expected to fall 0.2 percent on the month after a promising and stronger-than-expected 1.4 percent rise in June. The year-over-year comparison is seen decreasing 2.9 percent following 3.9 percent contraction in June.
German Merchandise Trade for July (Fri 0800 CEST; Fri 0700 GMT; Fri 0200 EDT)
Consensus Forecast, Balance: +€21.0 billion
July’s goods balance is expected to widen to a €21.0 billion surplus versus a narrower-than-expected surplus of €20.4 billion in June.
Canadian Labour Force Survey for August (Fri 0830 EDT; Fri 1230 GMT)
Consensus Forecast: Employment Change: 15,000
Consensus Forecast: Unemployment Rate: 6.5%
Employment in August is expected to rise 15,000 versus small disappointing declines in the prior two months. August’s unemployment rate is expected to rise a tenth to 6.5 percent.
US Employment Situation for August (Fri 0830 EDT; Fri 1230 GMT)
Consensus Forecast: Change in Nonfarm Payrolls: 160,000
Consensus Forecast: Unemployment Rate: 4.2%
Consensus Forecast: Average Hourly Earnings M/M: 0.3%
Consensus Forecast: Average Hourly Earnings Y/Y: 3.7%
A 160,000 rise is the call for nonfarm payroll growth in August versus July’s much lower-than-expected 114,000 rise. Average hourly earnings in August are expected to rise 0.3 percent on the month for a year-over-year rate of 3.7 percent; these would compare with July’s rates of 0.2 percent on the month and 3.6 percent on the year. August’s unemployment rate is expected to slip 1 tenth to 4.2 percent after jumping 2 tenths in July.
|
