|
The US Beige Book's anecdotal rundown of economic conditions won't be standing in the way of a Federal Reserve rate cut on September 18, far from it as activity generally slowed from the prior report in July. Nine of 12 districts reported flat or declining activity in August versus five in July at the same time that consumer spending in most districts "ticked down". Manufacturing declined in most districts as part of what two districts described as "ongoing contraction", an assessment subsequently underscored by a sharp drop in August factory payrolls.
Like the Fed, the European Central Bank appears certain to cut interest rates at its next meeting in the coming week. But here an incremental 25 basis points is the consensus with no suspicions of a 50-point move. This, however, can’t be said for the Fed whose coming rate cut could very well be an upsized move, especially if the coming week’s CPI report shows new pressure. For the Bank of Canada, which is where we’ll begin, 25-point moves are the consistent policy outcome.
 As widely expected and for the third straight meeting, the Bank of Canada cut its policy target by 25 basis points to 4.25 percent. The bank said it acted in response to continued easing in broad inflationary pressures. The bank said excess supply in the economy is pushing down on inflation, though pressures in shelter and services are holding inflation up. In terms of policy guidance, the bank said it would watch these opposing forces, and that "policy decisions will be guided by incoming information and our assessment of their implications for the inflation outlook." As widely expected and for the third straight meeting, the Bank of Canada cut its policy target by 25 basis points to 4.25 percent. The bank said it acted in response to continued easing in broad inflationary pressures. The bank said excess supply in the economy is pushing down on inflation, though pressures in shelter and services are holding inflation up. In terms of policy guidance, the bank said it would watch these opposing forces, and that "policy decisions will be guided by incoming information and our assessment of their implications for the inflation outlook."
BoC Governor Tiff Macklem said if inflation continues to unfold as expected, it would be reasonable to expect more rate cuts. He said the governing council would make its policy decision one meeting at a time.
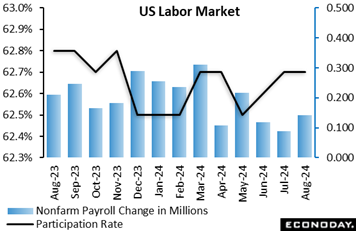 Nonfarm payrolls rose 142,000 in August after a sharp net downward revision of 86,000 for July and June. The August increase fell short of 160,000 in the Econoday survey of forecasters. The unemployment rate in August fell a tenth to 4.2 percent to match the survey consensus. The labor force participation rate held steady at 62.7 percent, near its November peak of 62.8 percent. Taken together, the picture is one of ongoing deceleration in hiring but without an acceleration in layoffs. Nonfarm payrolls rose 142,000 in August after a sharp net downward revision of 86,000 for July and June. The August increase fell short of 160,000 in the Econoday survey of forecasters. The unemployment rate in August fell a tenth to 4.2 percent to match the survey consensus. The labor force participation rate held steady at 62.7 percent, near its November peak of 62.8 percent. Taken together, the picture is one of ongoing deceleration in hiring but without an acceleration in layoffs.
The average monthly payroll increase in the first quarter was 267,000, 147,000 in the second quarter, and 116,000 for the third quarter to-date. Fed policymakers will find sufficient evidence in this trend to support cutting rates at the September 17-18 FOMC meeting. Labor supply is now back in balance and the job market is performing consistent with mildly expansionary conditions.
Private nonfarm payrolls rose 118,000 in August and government payrolls were up 24,000. Job gains and losses by industry showed few sizeable changes, although gains more than offset losses. Manufacturing is an exception, falling by 24,000 for the sharpest drop since October last year. Factory payrolls have contracted in four of the last seven months in what is shaping up, as echoed by the closely watched ISM report, to be an unfavorable year for manufacturing.
Construction on the other hand is an exception on the upside, jumping 34,000 in August. Construction businesses remain on the hunt for workers with the right skills and experience. New residential construction may have been soft in recent months, but home renovation and repair is still active. While commercial building construction may be weak, conversion of unused office space is common and businesses are repairing and upgrading current properties.
Average hourly earnings rose 0.4 percent month-over-month in August and were up 3.8 percent year-over-year. While increases in wages have cooled substantially since the peaks in 2022, they are still above the current pace of inflation. The workweek was little changed at 34.3 in August, up 0.1 hour from the prior month.
Turning to the household survey, the labor force is still growing with the number of employed up 168,000 and unemployed down 48,000. However, the U-6 rate – the broadest measure of unemployment – is up a tenth to 7.9 percent in August, the highest since 8.1 percent in October 2021. It appears that workers well-connected to the labor force are able to find work while those who have more trouble finding work – for any of a variety of reasons – are facing greater challenges.
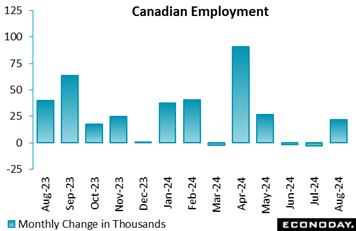 Another sluggish report for Canada: employment rose by 22,000 or 0.1 percent in August from July to barely top Econoday's consensus for a 15,000 gain. The unemployment rate rose to a nasty 6.6 percent in August from 6.4 percent in July. Forecasters looked for unemployment to rise to 6.5 percent in August. Year-over-year, the unemployment rate was up by 1.1 percentage points in August. Another sluggish report for Canada: employment rose by 22,000 or 0.1 percent in August from July to barely top Econoday's consensus for a 15,000 gain. The unemployment rate rose to a nasty 6.6 percent in August from 6.4 percent in July. Forecasters looked for unemployment to rise to 6.5 percent in August. Year-over-year, the unemployment rate was up by 1.1 percentage points in August.
The jobless rate in August was the highest since May 2017, outside of 2020 and 2021, during the pandemic.
The participation rate edged up to 65.1 percent from 65.0 percent in July and versus 65.3 percent in June. The July participation rate is the lowest since June 1998, excluding the pandemic period.
Total hours worked were pretty flat in August, down 0.1 percent and up a modest 1.4 percent from a year ago. Average hourly wages continued to cool at a 5.0 percent year-over-year rise after 5.2 percent in July and 5.4 percent in June.
August was the fourth straight month of relatively flat employment. For August, this reflected an increase of 66,000 in part-time work, mostly offset by a decline of 44,000 in full-time work.
Private sector jobs rose by 38,000 in August after falling 42,000 in July. The increase in private employment was the first since April. Public sector employment and self-employment were both nearly flat in August.
By sector, employment in educational services rose by 27,000, health care and social assistance gained 25,000 and finance was up 11,000. On the downside, "other services" fell 19,000, professional services fell 16,000 and utilities lost 6,800 jobs.
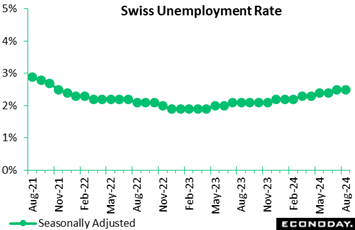 The Swiss labour market cooled a little in mid-quarter as seasonally adjusted joblessness rose 1,831 or 1.6 percent on the month to 116,468. However, the increase was not large enough to impact the unemployment rate which held steady at July's 2.5 percent, in line with the market consensus and matching its highest level since October 2021. Unadjusted, the number of people out of work climbed 3,638 or 3.4 percent to 111,354, a steep enough gain to lift the rate a tick to 2.4 percent, some 0.4 percentage points above its mark a year ago. The Swiss labour market cooled a little in mid-quarter as seasonally adjusted joblessness rose 1,831 or 1.6 percent on the month to 116,468. However, the increase was not large enough to impact the unemployment rate which held steady at July's 2.5 percent, in line with the market consensus and matching its highest level since October 2021. Unadjusted, the number of people out of work climbed 3,638 or 3.4 percent to 111,354, a steep enough gain to lift the rate a tick to 2.4 percent, some 0.4 percentage points above its mark a year ago.
Meantime, seasonally adjusted vacancies rose 706 or 2.0 percent on the month to 34,954, equating with an unadjusted yearly drop of 23.5 percent versus 25.5 percent last time.
While the uptick in vacancies hints at some improvement in the outlook, the August report shows overall labour market conditions continuing to deteriorate. This point that will not be wasted on the Swiss National Bank when it announces its next policy decision later this month.
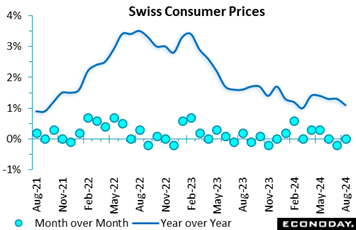 Swiss consumer prices were slightly softer than expected in August. A flat monthly performance was a tick short of the market consensus and weak enough to trim the annual inflation rate by 0.1 percentage point to just 1.1 percent, a 5-month low. Swiss consumer prices were slightly softer than expected in August. A flat monthly performance was a tick short of the market consensus and weak enough to trim the annual inflation rate by 0.1 percentage point to just 1.1 percent, a 5-month low.
The dip in the headline rate was wholly attributed to import prices where a 0.1 percent monthly drop reduced their annual change from minus 1.0 percent to minus 1.9 percent. Domestic prices were unchanged, holding their yearly rate stable at 2.0 percent.
Within the CPI basket, monthly declines in transport (1.2 percent) and household goods and services (0.9 percent) were essentially cancelled out by rises in clothing and footwear (2.4 percent) and smaller increases elsewhere. As a result, core prices edged only 0.1 percent firmer, again keeping the annual underlying inflation rate stable at a very benign 1.1 percent.
In line with July, the August update leaves Swiss inflation well within the SNB's definition of price stability. Moreover, with the core rate having steadied at 1.1 percent over the last three months, underlying pressures would seem to be nicely under control. Should the SNB want to ease again, inflation developments pose no hurdle.
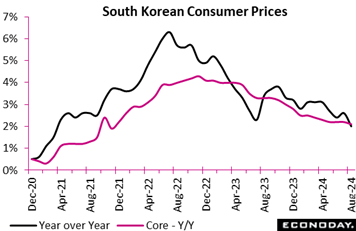 South Korea's headline consumer price index slowed sharply to 2.0 percent on the year in August after an increase of 2.6 percent in July, in line with the Bank of Korea's 2.0 percent target. This is the first time headline inflation has been at or below the target level since March 2021. The index rose 0.4 percent on the month after advancing 0.3 percent previously. South Korea's headline consumer price index slowed sharply to 2.0 percent on the year in August after an increase of 2.6 percent in July, in line with the Bank of Korea's 2.0 percent target. This is the first time headline inflation has been at or below the target level since March 2021. The index rose 0.4 percent on the month after advancing 0.3 percent previously.
The fall in headline inflation was largely driven by transport prices. These rose 0.1 percent on the month after surging 1.7 percent previously, with the year-over-year increase slowing from 5.2 percent to 1.8 percent. Food price inflation also moderated from 3.6 percent to 2.0 percent.
Underlying price pressures, in contrast, were steady in August. Core CPI, excluding food and energy, rose 2.1 percent on the year, down slightly from the 2.2 percent increase recorded in each of the previous three months, and rose 0.1 percent on the month after a previous increase of 0.3 percent. Core inflation has fallen only slightly from 2.5 percent at the start of the year. The year-year-over-year increase in prices was relatively steady for most major categories of spending.
At its most recent policy meeting, held last month, the BoK left policy rates on hold. Officials advised then that they had retained their forecast for core inflation to average 2.2 percent this year. Although they noted uncertainties about the inflation, they advised that they had "greater confidence that inflation will converge on the target level".
Although officials concluded that monetary policy should remain on hold, they also noted that they would "examine the proper timing of rate cuts while maintaining a restrictive monetary policy stance". August's data showing a fall in both headline and core inflation could strengthen the case for a rate cut at upcoming meetings. The next BoK meeting is scheduled to be held next month when officials will also have September’s inflation data in hand.
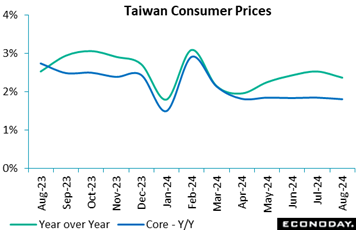 Taiwan's headline consumer price index rose 0.40 percent on the month in August after an increase of 0.19 percent in July, with the annual increase moderating from 2.52 percent to 2.36 percent. Vegetable prices again rose strongly on the month after extreme weather events. Core CPI, which excludes fruits, vegetables, and energy prices, fell 0.17 percent on the month in August after increasing 0.12 percent in July, with the year-over-year increase down slightly from 1.84 percent to 1.80 percent. Taiwan's headline consumer price index rose 0.40 percent on the month in August after an increase of 0.19 percent in July, with the annual increase moderating from 2.52 percent to 2.36 percent. Vegetable prices again rose strongly on the month after extreme weather events. Core CPI, which excludes fruits, vegetables, and energy prices, fell 0.17 percent on the month in August after increasing 0.12 percent in July, with the year-over-year increase down slightly from 1.84 percent to 1.80 percent.
The Central Bank of the Republic of China (Taiwan) left its main policy rate unchanged at 2.00 percent at its quarterly policy meeting mid-June. This followed an increase at its previous meeting which took the rate to its highest level since 2008. Forecasts published at the June meeting showed that officials were more confident that price pressures would moderate in the near-term, with their forecast for annual headline inflation in 2024 revised down from 2.49 percent to 2.12 percent and their forecast for annual core inflation revised down from 2.58 to 2.00 percent. Reflecting this assessment, officials concluded that policy settings remained appropriate. The next policy meeting will be held later this month.
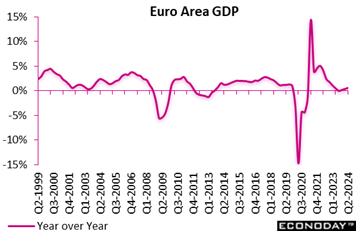 Flash data for the April-June period were revised a little softer, reducing quarterly growth by a tick to 0.2 percent but leaving the yearly rate unchanged at 0.6 percent. Flash data for the April-June period were revised a little softer, reducing quarterly growth by a tick to 0.2 percent but leaving the yearly rate unchanged at 0.6 percent.
The first look at the expenditure components showed another sluggish period for domestic demand. Hence, household spending fell 0.1 percent on the quarter while gross fixed capital formation declined fully 2.2 percent having already shrunk 1.8 percent at the start of the year. Government spending was up 0.6 percent. Consequently, with business inventories having a neutral impact, the economy would have contracted but for net exports. With exports up 1.4 percent and imports only 0.5 percent, the real trade balance added a tidy 0.5 percentage points.
Within the region's quarterly advance, France expanded 0.2 percent, Italy also 0.2 percent and Spain a solid 0.8 percent for a second straight quarter. However, as shown previously, headline growth was held in check by Germany which recorded an unrevised 0.1 percent dip, its second contraction in the last three quarters. Elsewhere Greece (1.1 percent) had another good quarter as did Croatia (0.8 percent) and Lithuania (0.7 percent). However, Latvia (minus 0.9 percent) posted a sizeable decline alongside Ireland, where growth was slashed from the previously reported 1.2 percent to minus 1.0 percent. Austria (minus 0.4 percent) also contracted.
The second quarter update confirms a sluggish picture of Eurozone growth and particularly soft domestic demand. The third quarter is likely to tell a similar story unless the German economy can gain some traction very soon. Accordingly, businesses and consumers would more than welcome another cut in ECB interest rates, and the latest update can only boost the chances of a move in the coming week.
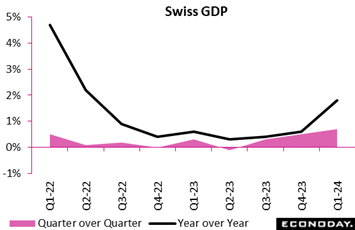 Swiss economic growth was surprisingly robust in the second quarter. Following an unrevised 0.5 percent quarterly increase at the start of the year, GDP expanded fully 0.7 percent, a couple of ticks above the market consensus and its best performance since the second quarter of 2022. Annual growth was 1.8 percent, up sharply from an unrevised 0.6 percent last time. Swiss economic growth was surprisingly robust in the second quarter. Following an unrevised 0.5 percent quarterly increase at the start of the year, GDP expanded fully 0.7 percent, a couple of ticks above the market consensus and its best performance since the second quarter of 2022. Annual growth was 1.8 percent, up sharply from an unrevised 0.6 percent last time.
Yet the robust headline masked a flat performance by final domestic demand. Household consumption rose 0.3 percent on the quarter and government consumption was up 0.2 percent but gross fixed capital formation fell 0.8 percent, its fourth decrease in the last five quarters. With equipment spending down a hefty 1.4 percent, overall investment ominously now stands at its lowest level since the second quarter of 2020. Inventory accumulation (and statistical discrepancies) also subtracted fully 2.5 percentage points.
Consequently, the overall picture would have been a good deal weaker but for a sharp improvement in the real trade balance which added some 3.2 percentage points. Even then, both sides of the balance sheet contracted with a 3.4 percent drop in exports easily more than offset by a 9.1 percent slump in imports.
As a result, the headline data flatter to deceive and should not stand in the way of another cut in the SNB policy rate later this month should the central bank see fit.
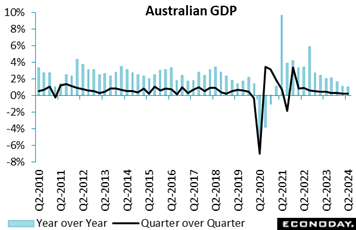 Australia's GDP expanded 0.2 percent on the quarter in the three months to June, unchanged from the revised growth recorded in the three months to March and in line with the consensus forecast. The economy has now grown at this weak pace for three consecutive quarters, reflecting the impact of tight monetary policy settings. GDP rose 1.0 percent on the year in the June quarter, little changed from 1.1 percent in the March quarter and just above the consensus forecast of 0.9 percent. Australia's GDP expanded 0.2 percent on the quarter in the three months to June, unchanged from the revised growth recorded in the three months to March and in line with the consensus forecast. The economy has now grown at this weak pace for three consecutive quarters, reflecting the impact of tight monetary policy settings. GDP rose 1.0 percent on the year in the June quarter, little changed from 1.1 percent in the March quarter and just above the consensus forecast of 0.9 percent.
Household consumption fell 0.2 percent on the quarter after a previous increase of 0.6 percent, offset by a positive contribution from net trade to headline growth of 0.2 percentage points. Private investment fell at a steady pace, down 0.6 percent on the quarter after falling 0.5 percent previously, while government spending increased 1.4 percent on the quarter.
The second-quarter data cover the period in which officials at the Reserve Bank of Australia continued to leave policy rates on hold after increasing them once in late 2023. At their latest meeting, held last month, officials left rates on hold again but again advised that they could not rule out further rate increases. The latest update, however, suggests that previous policy tightening is continuing to weigh on demand and activity.
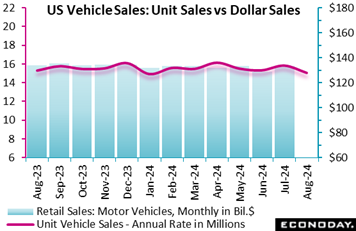 Sales of motor vehicles fell sharply to a 15.1 million unit seasonally adjusted annualized rate in August after 15.8 million units in July. The pace was short of Econoday’s 15.4 million consensus and will have economists marking down their forecasts for August retail spending, data to be released Tuesday, September 17. Sales of North American produced motor vehicles fell to 11.5 million units in August from 12.0 million units in July. Motor vehicles produced in North America accounted for 76 percent of all units sold. Sales of motor vehicles fell sharply to a 15.1 million unit seasonally adjusted annualized rate in August after 15.8 million units in July. The pace was short of Econoday’s 15.4 million consensus and will have economists marking down their forecasts for August retail spending, data to be released Tuesday, September 17. Sales of North American produced motor vehicles fell to 11.5 million units in August from 12.0 million units in July. Motor vehicles produced in North America accounted for 76 percent of all units sold.
Sales of passenger cars fell to 2.868 million units in August from 2.989 million units in July. Sales of light trucks – which include SUVs, minivans, and crossovers – were down to 12.263 million units in August from 12.855 million units in the prior month. Sales in the light trucks category continue to dominate the market with 81 percent of all sales and remain just below the historical peak of 82 percent of sales in June 2024.
In separate data not included in the accompanying graph, sales of heavy trucks slipped to 509,000 units in August after a sharp increase to 523,000 in July. Businesses continue to invest in equipment to replace aging units, upgrade current equipment, and/or expand capacity.
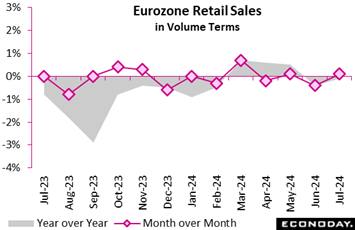 The retail sector in Europe continued to struggle in July. Volume sales rose just 0.1 percent on the month, matching Econoday’s consensus but reversing only a fraction of June's steeper revised 0.4 percent fall and leaving an essentially flat trend. Positive base effects were largely responsible for lifting yearly growth from minus 0.4 percent to minus 0.1 percent. The retail sector in Europe continued to struggle in July. Volume sales rose just 0.1 percent on the month, matching Econoday’s consensus but reversing only a fraction of June's steeper revised 0.4 percent fall and leaving an essentially flat trend. Positive base effects were largely responsible for lifting yearly growth from minus 0.4 percent to minus 0.1 percent.
July's minimal monthly gain was led by food, drink and tobacco where purchases rose 0.4 percent after June's 0.7 percent decline. Non-food (ex-auto fuel) demand was up just 0.1 percent following a 0.2 percent drop while auto fuel fell 1.0 percent, its third decrease in the last four months.
Regionally, both France (0.1 percent) and Spain (0.5 percent) recorded gains modest rises. Note that German data are currently still not available due to the changeover to new data requirements.
Overall Eurozone sales in July were 0.1 percent below their average level in the second quarter and so make for a soft start to the current period. Moreover, with consumer confidence still beneath its historic norm and, in recent months, moving mainly sideways, near-term prospects for a significant pick-up look slim. Another cut in ECB interest rates in the coming week would be more than welcome.
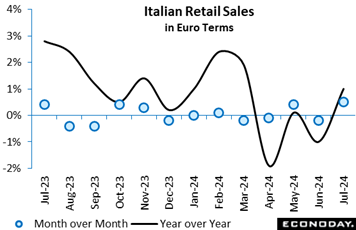 Looking specifically at Italy, retail sales exhibited modest growth in July, indicative of a consistent consumer appetite. Both value and volume experienced positive changes on a month-over-month basis, with food products experiencing minor gains and non-food products demonstrating a more substantial increase in value. Although the value of retail transactions increased by 1.0 percent year-over-year, volume growth was only 0.1 percent. Looking specifically at Italy, retail sales exhibited modest growth in July, indicative of a consistent consumer appetite. Both value and volume experienced positive changes on a month-over-month basis, with food products experiencing minor gains and non-food products demonstrating a more substantial increase in value. Although the value of retail transactions increased by 1.0 percent year-over-year, volume growth was only 0.1 percent.
The sales of food products were inconsistent, with a 0.3 percent increase in value and a 0.7 percent decrease in volume. This suggests a trend towards premium or higher-priced items. In contrast, non-food products experienced a significant uptick, with fragrances and personal care items experiencing a 6.0 percent rise. However, games and toys experienced a modest decline. Large-scale and small-scale businesses, as well as e-commerce, all reported upticks in sales in comparison to July 2023 in terms of distribution channels. Sales outside of physical stores experienced a minor fall, while e-commerce experienced a substantial 4.1 percent uptick.
This trend stresses a growing predilection for online purchasing and suggests that, despite the continued importance of traditional retail channels, digital platforms are becoming more critical to the development of the retail industry.
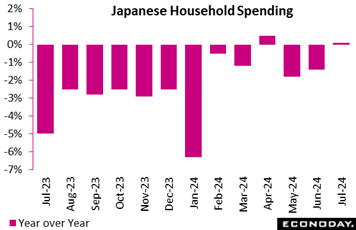 Japan's real household spending posted its first year-over-year rise in three months in July but with a sluggish undertone of rising just 0.1 percent, as severely hot and humid weather kept people indoors while demand for air conditioners and beverages skyrocketed. Japan's real household spending posted its first year-over-year rise in three months in July but with a sluggish undertone of rising just 0.1 percent, as severely hot and humid weather kept people indoors while demand for air conditioners and beverages skyrocketed.
The core measure of real average household spending (excluding housing, motor vehicles and remittance), a key indicator used in GDP calculation, dipped 0.8 percent after rising 1.3 percent in June for the first increase in 16 months.
The headline increase was led by high spending on home maintenance and repairs, induction cooktops as well as TVs (replacement demand amid Paris Summer Olympics). These gains were largely offset by drops in motorcycles, car parts, and gift money.
Compared to the previous month, real average expenditures by households with two or more people fell a steep 1.7 percent after edging up 0.1 percent in June. July came in well below the expected 0.6 percent slip.
The average real income of households with salaried workers rose at a 5.5 percent rate in July after rising 3.1 percent in June. In nominal terms, average income grew 8.1 percent following a 6.5 percent gain the previous month. This indicates that a high pace of wage growth by Japanese standards is spreading to smaller firms that employ about 70 percent of the workforce.
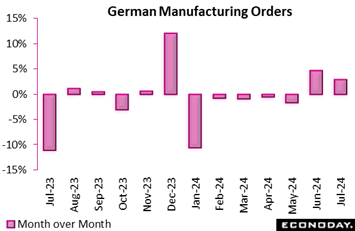 New manufacturing orders in July increased by 2.9 percent month-over-month, primarily due to substantial gains in the transport equipment sector, which increased by 86.5 percent. These gains were a result of large-scale orders for aircraft and military vehicles. It is also worth noting that electrical equipment experienced an 18.6 percent increase. Nevertheless, when these large scale orders are removed from the analysis, the absence of these substantial orders result in a 0.4 percent reduction in new manufacturing orders and a 6.1 percent decrease in machinery orders, suggesting that development was unequal across sectors. New manufacturing orders in July increased by 2.9 percent month-over-month, primarily due to substantial gains in the transport equipment sector, which increased by 86.5 percent. These gains were a result of large-scale orders for aircraft and military vehicles. It is also worth noting that electrical equipment experienced an 18.6 percent increase. Nevertheless, when these large scale orders are removed from the analysis, the absence of these substantial orders result in a 0.4 percent reduction in new manufacturing orders and a 6.1 percent decrease in machinery orders, suggesting that development was unequal across sectors.
Euro-area orders experienced a 5.9 percent rise in response to the surge in foreign demand, while domestic orders remained unchanged. Intriguingly, capital and intermediate goods experienced positive growth by 3.5 percent and 4.4 percent, respectively. Consumer goods, on the other hand, experienced a 5.8 percent decline, indicative of cautious household demand. Despite these increases in orders, turnover decreased by 2.3 percent in July, suggesting a potential delay between the increase in orders and actual sales.
These data indicate a bifurcated recovery, with certain sectors experiencing rapid growth as a result of substantial contracts, while others encounter challenges. This suggests that manufacturing performance may become unpredictable.
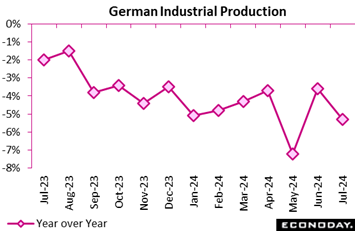 German industrial production experienced a dramatic decline in July 2024, with a 2.4 percent decrease from June and a 5.3 percent year-over-year decline. This marks a notable reversal from 1.7 percent monthly growth seen in June. The automotive industry was the most severely affected, experiencing an 8.1 percent monthly decline following a robust performance in June at 7.9 percent, which underscores the sector's volatility. Overall output was further impacted by the struggles for other critical sectors, including fabricated metal products and electrical equipment. German industrial production experienced a dramatic decline in July 2024, with a 2.4 percent decrease from June and a 5.3 percent year-over-year decline. This marks a notable reversal from 1.7 percent monthly growth seen in June. The automotive industry was the most severely affected, experiencing an 8.1 percent monthly decline following a robust performance in June at 7.9 percent, which underscores the sector's volatility. Overall output was further impacted by the struggles for other critical sectors, including fabricated metal products and electrical equipment.
Capital goods declined 4.2 percent on the month with consumption goods declining by 1.2 percent, excluding energy and construction. Construction provided an uncommon shining light with a modest growth of 0.3 percent, despite a 1.9 percent decrease in energy production.
Energy-intensive industries experienced a milder contraction of 1.8 percent. Consequently, Germany's industrial base is significantly impacted by rising costs and sluggish demand, as evidenced by the broader decline across sectors, particularly in vital manufacturing sectors. This is underscored by the prospective challenges that may arise in maintaining growth in one of Europe's economic powerhouses.
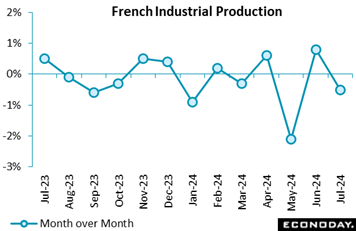 French industrial production experienced a decline in several critical sectors in July over the month of June, thereby reverting the progress achieved in June. Aggregate industrial output experienced a 0.5 percent decline, while manufacturing output experienced a 0.9 percent decline following a 0.9 percent rise in June. Transport equipment manufacturing experienced the most severe declines, with a 4.9 percent drop, primarily due to a substantial decrease in motor vehicle production which fell by 4.6 percent and other transport equipment which fell by 5.1 percent. Following a substantial 12.8 percent increase in June, the overall downturn was also influenced by a remarkable 9.9 percent monthly decline in coke and refined petroleum products. French industrial production experienced a decline in several critical sectors in July over the month of June, thereby reverting the progress achieved in June. Aggregate industrial output experienced a 0.5 percent decline, while manufacturing output experienced a 0.9 percent decline following a 0.9 percent rise in June. Transport equipment manufacturing experienced the most severe declines, with a 4.9 percent drop, primarily due to a substantial decrease in motor vehicle production which fell by 4.6 percent and other transport equipment which fell by 5.1 percent. Following a substantial 12.8 percent increase in June, the overall downturn was also influenced by a remarkable 9.9 percent monthly decline in coke and refined petroleum products.
The other manufacturing industries sector experienced a 0.6 percent decline, while the food and beverage sector continued to decline by 0.3 percent. Nevertheless, there were some encouraging developments: machinery and equipment manufacturing experienced a 2.0 percent rise, while output in mining, quarrying, energy, and water supply increased by 1.8 percent.
Year-over-year, the situation remains grim. Manufacturing output decreased by 3.0 percent between May and July, compared to the previous year. Motor vehicle manufacturing experienced a severe 17.8 percent decline, while the transport equipment sector experienced a 7.1 percent decline. Despite this, the energy sector posted 1.1 percent growth and other transport equipment experienced a modest 0.8 percent growth, providing some stability amid the broader industrial struggles.
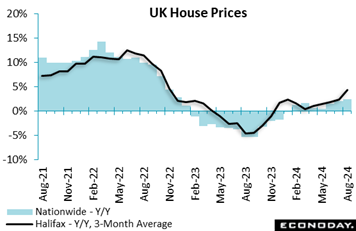 UK house prices as measured by Halifax rose 0.3 percent on the month in August, a tick stronger than the market consensus and following a marginally steeper revised 0.9 percent spurt in July. With prices falling sharply a year ago, annual inflation climbed from 2.4 percent to 4.3 percent, its highest mark since November 2022. The average UK house price is now £292,505, a level not seen since August 2022 and just £1,000 shy of its record peak. UK house prices as measured by Halifax rose 0.3 percent on the month in August, a tick stronger than the market consensus and following a marginally steeper revised 0.9 percent spurt in July. With prices falling sharply a year ago, annual inflation climbed from 2.4 percent to 4.3 percent, its highest mark since November 2022. The average UK house price is now £292,505, a level not seen since August 2022 and just £1,000 shy of its record peak.
At the same time, the 3-monthly change increased from 0.1 percent in July to 0.8 percent, matching its firmest print since March and showing a clear uptrend in underlying prices. Moreover, with market activity gaining momentum and further interest rate reductions likely, Halifax expects prices to continue their modest growth over the remainder of the year.
The August report contrasts with Nationwide’s survey released in the prior week which showed prices slipping 0.2 percent on the month for annual growth of 2.4 percent. However, both measures show a rising underlying trend.
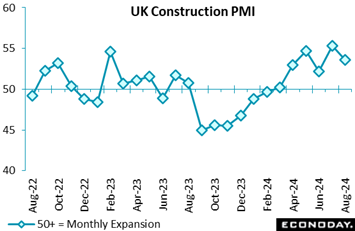 Construction activity in the UK continued to motor ahead at a respectable pace in mid-quarter. At 53.6, the August sector PMI was above the 50-expansion threshold for a sixth straight month, albeit down from July's 54.3, itself a 26-month high. The latest reading was also 0.8 points short of the market consensus. Construction activity in the UK continued to motor ahead at a respectable pace in mid-quarter. At 53.6, the August sector PMI was above the 50-expansion threshold for a sixth straight month, albeit down from July's 54.3, itself a 26-month high. The latest reading was also 0.8 points short of the market consensus.
All of the three main categories posted fresh positive growth, led by commercial building (53.7). Residential construction (52.7) actually enjoyed its best month in nearly two years but civil engineering (51.8) slowed markedly.
August saw another healthy increase in new orders, in part attributed to a more stable political environment. Confidence was also well up on a year ago but sub-contractor usage still fell for the first time since January and higher wage pressures helped to hold headcount flat after three successive rises. Even so, overall input costs eased versus July.
While on the soft side of expectations, the August results remain relatively upbeat and, depending upon the speed with which the Bank of England cuts Bank Rate, look likely to stay that way through year-end.
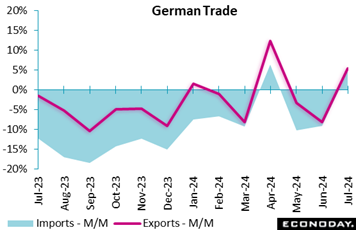 Germany's trade dynamics reveal a nuanced recovery in July, as exports increased by 1.7 percent and imports increased by 5.4 percent in calendar and seasonally adjusted over the previous month. Conversely, imports increased by 4.8 percent annually, while exports increased by 5.4 percent. The foreign trade balance decreased marginally, with a value of €16.8 billion, a decrease from €20.4 billion recorded in June. Germany's trade dynamics reveal a nuanced recovery in July, as exports increased by 1.7 percent and imports increased by 5.4 percent in calendar and seasonally adjusted over the previous month. Conversely, imports increased by 4.8 percent annually, while exports increased by 5.4 percent. The foreign trade balance decreased marginally, with a value of €16.8 billion, a decrease from €20.4 billion recorded in June.
Despite Germany's resilient export performance to EU member states, particularly within the euro area at 4.0 percent, its imports from these countries grew at a quicker rate, an indicator of domestic demand pressures. It is intriguing that exports to non-EU nations experienced a minor decrease by minus 0.2 percent, with significant decreases in trade with key partners such as the US at minus 1.7 percent, China at minus 8.0 percent, and the UK at minus 2.7 percent. Nevertheless, imports from China experienced a significant increase of 6.6 percent, suggesting that Germany continues to depend on Chinese products. Trade with Russia exhibited intricate patterns as exports increased by 18.9 percent month-over-month, but they remained 6.5 percent lower than in July 2023 as a result of persistent geopolitical tensions.
In addition, Germany's nominal trade surplus increased year-over-year, reaching €20.7 billion in July 2024, from €19.0 billion in 2023, despite the challenges it faces in non-EU markets. This growth is primarily due to the constant growth of exports and the increase in imports.
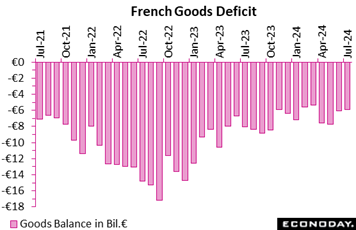 France's trade balance continued its negative trajectory, although narrowing to minus €5.9 billion in July. This shift was largely driven by a €0.6 billion drop in imports, which fell to €56.3 billion, while exports remained steady at €50.4 billion. France's trade balance continued its negative trajectory, although narrowing to minus €5.9 billion in July. This shift was largely driven by a €0.6 billion drop in imports, which fell to €56.3 billion, while exports remained steady at €50.4 billion.
The energy sector continues to play a key role in stabilizing the trade balance, with a €0.4 billion improvement. Capital goods and consumer goods also contributed positively, with improvements of €0.2 billion and €0.1 billion, respectively. Notably, the consumer goods sector has been in surplus since November 2023, reflecting strong performance and demand for French products. However, the decline in intermediate commodities at minus 0.1 €billion signifies potential disruptions.
Overall, while France's trade deficit remains significant, these positive trends in energy and consumer goods suggest resilience, positioning the country to further stabilize its trade balance in the months ahead.
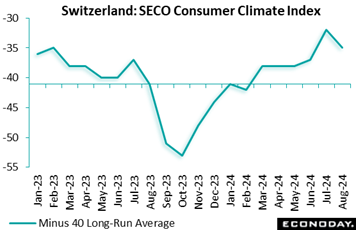 Swiss consumer sentiment deteriorated in August. At minus 35, the unadjusted headline index was 3 points below its July outturn and 2 points short of the market consensus. However, it was 6 points stronger than a year ago and still well above its minus 40 long-run average. Swiss consumer sentiment deteriorated in August. At minus 35, the unadjusted headline index was 3 points below its July outturn and 2 points short of the market consensus. However, it was 6 points stronger than a year ago and still well above its minus 40 long-run average.
The monthly fall was largely due to a worse economic outlook (minus 22 after minus 16) and weaker spending intentions (minus 32 after minus 30). However, job security improved slightly (minus 22 after minus 23) and year-ahead ahead inflation expectations (97) held steady and so remained some 6 points below their historic norm.
Despite the setback, August's report leaves a fairly flat profile to consumer confidence – indeed, the third quarter will probably be a little more robust than the second and well above its level a year ago. Even so, the outlook for household spending would seem subdued and points to another rate cut from the SNB later this month.
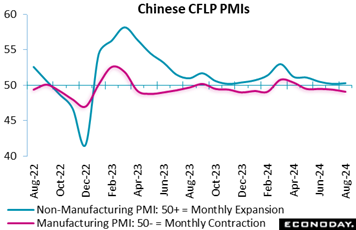 Official Chinese PMI survey data show conditions in China's aggregate economy were close to stagnant in August. CFLP’s manufacturing PMI fell from 49.5 to 49.1, below the consensus forecast of 49.4 and indicating contraction in the sector for the fourth consecutive month. The CFLP non-manufacturing PMI rose slightly from 50.2 to 50.3, just above the consensus forecast of 50.1 but indicating only modest expansion in the sector. The composite index covering the entire economy fell from 50.2 in June to 50.1 in July, its lowest level since December 2022. Official Chinese PMI survey data show conditions in China's aggregate economy were close to stagnant in August. CFLP’s manufacturing PMI fell from 49.5 to 49.1, below the consensus forecast of 49.4 and indicating contraction in the sector for the fourth consecutive month. The CFLP non-manufacturing PMI rose slightly from 50.2 to 50.3, just above the consensus forecast of 50.1 but indicating only modest expansion in the sector. The composite index covering the entire economy fell from 50.2 in June to 50.1 in July, its lowest level since December 2022.
Global economic data have been consistently underperforming economist forecasts since the beginning of August, though only to a limited degree. Econoday’s Relative Performance Index (RPI) held unchanged in the week at minus 10, just within the low end of consensus ranges. When excluding prices (RPI-P) which have been coming in near estimates, the index falls to minus 17 which is likewise little changed to indicate that real economic activity has been, as it has for the last five weeks, generally subpar relative to expectations.
In the Eurozone, the RPI and RPI-P slipped to 8 and 4 respectively as a surprise downward revision to second-quarter growth simply boosted expectations for another ECB interest rate cut on Thursday.
In the UK, fresh signs of surprisingly respectable third-quarter GDP lifted the RPI to minus 4 and the RPI-P to exactly zero. With the economy performing much as expected, speculators remain split over this month’s MPC decision. Tuesday’s labour market update will be a key input.
In Switzerland, the RPI (14) and RPI-P (25) extended their move above zero. Even so, with inflation a little softer than forecast and superficially robust second-quarter growth masking soft domestic demand, financial markets still anticipate another cut by the Swiss National Bank later this month.
In Japan, unexpectedly soft household spending sank the RPI to minus 36 and the RPI-P to a lowly minus 71. Wage pressures may be rising but overall economic activity rates still argue in favour of only cautious monetary tightening.
In China, fresh data questioning the attainability of the government’s 5 percent growth forecast for 2024 saw the RPI and RPI-P close the week at minus 29 and minus 42 respectively. Both measures have been in largely negative surprise territory since May, sustaining pressure on the central bank to expand its monetary policy toolbox.
Both the US and Canada are performing exactly as expected, at scores of zero and plus 1 respectively overall and at zero and minus 1 when excluding inflation. The US scores assure a rate cut at the FOMC’s September 18 announcement though not necessarily justifying an upsized 50-point move; Canada’s scores won’t question the Bank of Canada’s decision during the week to cut interest rates with a third straight 25-point move.
**Contributing to this article were Jeremy Hawkins, Brian Jackson, Mace News, Max Sato, Olajide Oyadeyi, and Theresa Sheehan
There’s no doubt among forecasters that the European Central Bank will cut its deposit rate by 25 basis points at its Thursday announcement, a move that could take second billing in the week’s events should Wednesday’s US CPI report miss expectations. August’s CPI is expected to cool to 2.6 from 2.9 percent though the core rate is seen holding steady at 3.2 percent. Cooler-than-expected results could heat up talk of a 50-basis-point cut at the Federal Reserve’s September 18 announcement while higher-than-expected results would likely settle expectations at 25 points.
Chinese merchandise trade will open the week on Saturday local time with only a modest narrowing in the country’s surplus expected. Monthly UK GDP on Wednesday is expected to show marginal growth while US consumer sentiment on Friday, in what will be the first indication for September, is expected to remain flat.
Chinese Merchandise Trade Balance for August (Estimated for Saturday local time, release time not set)
Consensus Forecast: US$82.0 billion
Consensus Forecast: Imports - Y/Y: 3.0%
Consensus Forecast: Exports - Y/Y: 6.6%
China's trade surplus for August is expected to narrow to US$82.0 billion versus a narrower-than-expected surplus of US$84.65 billion in a July report that showed an increase in imports and slowing growth in exports.
Chinese CPI for August (Mon 0930 CST; Mon 0130 GMT; Sun 2130 EDT)
Consensus Forecast, Year over Year: 0.7%
August’s year-over-year rate is expected to see an increase to 0.7 percent versus July’s 0.5 percent rate that compared with expectations for 0.3 percent. China’s CPI has been depressed, last peaking in January last year at 2.1 percent.
Chinese PPI for August (Mon 0930 CST; Mon 0130 GMT; Sun 2130 EDT)
Consensus Forecast, Year over Year: -1.5%
Producer prices have been in long annual contraction though July’s minus 0.8 percent headline was the smallest year-over-year decline since January 2023. August’s consensus is minus 1.5 percent.
UK Labour Market Report (Tue 0700 BST; Tue 0600 GMT; Tue 0200 EDT)
Consensus Forecast, ILO Unemployment Rate for three months to July: 4.2%
Consensus Forecast, Average Earnings for three months to July: 4.1%
The ILO unemployment rate for the three months to July is expected to hold at 4.2 percent which was sharply lower versus expectations for 4.5 percent. Average earnings growth for the three months to July is seen easing to 4.1 percent from the second quarter’s as-expected 4.5 percent.
UK GDP for July (Wed 0700 BST; Wed 0600 GMT; Wed 0200 EDT)
Consensus Forecast, Month over Month: 0.1%
GDP in the month of July is expected to rise 0.1 percent versus no change in June which was a tick short of expectations.
UK Industrial Production for July (Wed 0700 BST; Wed 0600 GMT; Wed 0200 EDT)
Consensus Forecast, Month over Month: 0.2%
Manufacturing Output
Consensus Forecast, Month over Month: 0.2%
Industrial production is expected to rise 0.2 percent in July after a surprisingly robust 0.8 percent gain in June. Manufacturing output, which in June jumped 1.1 percent, is also expected to rise 0.2 percent.
US CPI for August (Wed 1230 GMT; Wed 0830 EDT)
Consensus Forecast, Month over Month: 0.2%
Consensus Forecast, Year over Year: 2.6%
US CPI Core, Less Food & Energy
Consensus Forecast, Month over Month: 0.2%
Consensus Forecast, Year over Year: 3.2%
Overall prices are expected to rise 0.2 percent in August that would match the as-expected 0.2 percent rise in July. Core prices also increased an as-expected 0.2 percent in July with August’s consensus also at 0.2 percent. Annual rates, which in July were 2.9 percent overall and 3.2 percent for the core (both 1 tenth lower than June), are expected at 2.6 and 3.2 percent, respectively.
European Central Bank Announcement, Deposit Rate (Thu 1215 GMT; Thu 1415 CEST; Thu 0815 EST)
Consensus Forecast, Change: 25 basis points
Consensus Forecast, Level: 3.5%
With inflation easing and economic activity flat, the European Central Bank is widely expected to cut its deposit rate by 25 basis points to 3.5 percent. The bank held policy steady at its meeting in July after easing in June.
Eurozone Industrial Production for July (Fri 1100 CEST; Fri 0900 GMT; Fri 0500 EDT)
Consensus Forecast, Month over Month: -0.2%
Production in July is expected to fall a monthly 0.2 percent after an unexpected 0.1 percent decline in June that was well off expectations for a 0.7 percent rebound.
US Consumer Sentiment Index, Preliminary September (Fri 1000 EDT; Fri 1400 GMT)
Consensus Forecast: 68.0
In the first indication for September, consumer sentiment is expected to hold steady at 68.0 versus August’s 67.9. Consumer sentiment has been flat and historically depressed.
|

