|
As the first rate cut since March 2020 and the first change since the 5.25-5.50 percent target range was set in July last year, Wednesday’s 50-basis-point reduction in the Fed funds rate by the FOMC surprised and likely punished financially the half of market participants quite reasonably expecting a smaller cut of 25 basis points. Their expectations were partly shaped by lingering though muted inflation concerns, and partly by signs of economic strength, including those given by GDP Nowcasts from Fed district banks that are tracking above 2 percent in the third quarter following the second quarter’s 3.0 percent rise. But it was a worrisome deceleration in payroll increases over the last two quarters, particularly in the last two months, and a massive downward revision that erased 818,000 non-farm payroll gains originally reported between April last year and March this year that tilted the balance toward the larger cut. The bigger move and the accompanying rhetoric also signal the FOMC’s willingness to take more aggressive action to address weakness on the employment front.
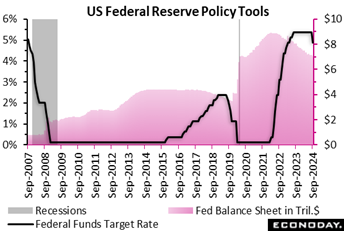
The FOMC cut the fed funds target rate range by 50 basis points to 4.75-5.00 percent at the end of the September 17-18 meeting. The vote was 11-1 with Governor Michelle Bowman preferring a 25-basis point cut. The statement said FOMC has achieved the "greater confidence" it sought on the path of disinflation. The risks to the dual mandate are now "roughly in balance" for price stability and maximum employment. The larger rate cut is not wholly a surprise to markets, but was not a certainty.
The statement said, "The Committee is strongly committed to supporting maximum employment and returning inflation to its 2 percent objective." This wording regarding employment is new and suggests that the decision for a larger cut was due to the deceleration in hiring and the FOMC wanting to signal that they want to avoid further cooling in the labor market.
The update to the summary of economic projections (SEP) shows that GDP growth is little revised. GDP for 2024 is down a tenth to 2.0 percent, 2025 and 2026 are still forecast at 2.0 percent, and the new forecast for 2027 is at 2.0 percent. The longer-run projection remains 1.8 percent.
The forecast for the unemployment rate is revised up four-tenths to 4.4 percent in 2024, up two-tenths to 4.4 percent in 2025, up two-tenths to 4.3 percent in 2026, and is 4.2 percent in 2027. The longer-run projection is 4.2 percent.
Forecasts for inflation as measured by the PCE deflator is revised down. PCE inflation is revised down three-tenths to 2.3 percent in 2024, down two-tenths to 2.1 percent in 2025, unrevised at 2.0 percent in 2026, and at 2.0 percent in 2027. Core PCE inflation is revised down two-tenths to 2.6 in 2024, down at tenth to 2.2 percent in 2025, and unrevised at 2.0 percent in 2026, with 2.0 percent for 2027. The longer-run projection remains at 2.0 percent.
The projection for the midpoint of the fed funds target range at the end of 2024 is 4.4 percent, a sharp seven-tenths lower than in the June projection. This suggests two more rate cuts of 25 basis points each at the November and December FOMC meetings. The midpoint for 2025 is now 3.4 percent, five-tenths below the prior forecast. In 2026 the midpoint is forecast at 2.9 percent, two-tenths below the previous forecast and 2027 is also forecast at 2.9 percent.
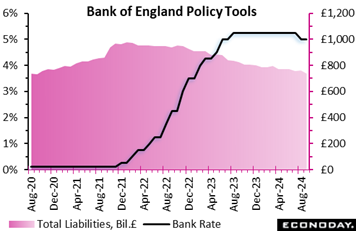 The monetary policy committee reiterated its determination to meeting the 2 percent inflation target in the face of persistent economic uncertainties. Despite the preference of one member for a minor reduction, the decision to maintain the Bank Rate at 5 percent is indicative of a cautious approach to managing persistent inflation. On QT, there was a unanimous vote to retain the target for net gilt sales at £100 billion over the coming year, essentially the neutral choice. The monetary policy committee reiterated its determination to meeting the 2 percent inflation target in the face of persistent economic uncertainties. Despite the preference of one member for a minor reduction, the decision to maintain the Bank Rate at 5 percent is indicative of a cautious approach to managing persistent inflation. On QT, there was a unanimous vote to retain the target for net gilt sales at £100 billion over the coming year, essentially the neutral choice.
Three prospective inflation dynamics scenarios were examined by the MPC in its analysis. The initial scenario anticipates a gradual reduction in global inflationary pressures, which implies that a less restrictive monetary policy may be sufficient. The second scenario suggests that economic flexibility is necessary, necessitating a more stringent posture to normalise pay and price-setting. The third scenario emphasises structural changes that have occurred as a result of recent supply disruptions, suggesting that protracted policy restrictiveness may be necessary.
The Committee recognises the intricacies of the current economic environment, despite a modest increase in inflation to 2.2 percent and sustained global growth. The committee noted its commitment to maintain a gradual approach to policy restraint to ensure that inflation risks are effectively managed, thereby promoting sustainable growth and employment.
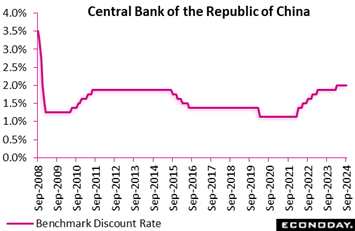 The Central Bank of the Republic of China (Taiwan) left its main policy rate unchanged at 2.00 percent at its quarterly policy meeting today, in line with the consensus forecast for no change. This follows an increase of 12.5 basis points at its meeting in March, which was the first increase in twelve months and took the rate to its highest level since 2008. The Central Bank of the Republic of China (Taiwan) left its main policy rate unchanged at 2.00 percent at its quarterly policy meeting today, in line with the consensus forecast for no change. This follows an increase of 12.5 basis points at its meeting in March, which was the first increase in twelve months and took the rate to its highest level since 2008.
Data released since the CBC's previous policy meeting in June have shown low and relatively steady headline inflation after some holiday-related volatility early in the year. PMI surveys have also shown modest expansion in the manufacturing sector recent months after an extended period of contraction.
In the statement accompanying today's decision, officials expressed confidence about the growth outlook, with further strength in external demand expected to be supported by domestic consumption and investment also expected to support stronger headline GDP growth. Officials revised up their annual GDP growth forecast for 2024 from 3.77 percent to 3.82 percent and forecast growth of 3.08 percent in 2025. Officials remain confident that price pressures will moderate in the near-term, revising their forecast for annual headline inflation in 2024 from 2.12 percent to 2.16 percent and their forecast for annual core inflation from 2.00 percent to 1.94 percent. They expect further moderation in 2025, forecasting headline CPI inflation to fall to 1.89 percent and core CPI inflation to fall to 1.79 percent.
Reflecting their forecasts now for growth to remain solid and inflation to moderate further in 2025, officials concluded that current policy settings remain appropriate. Nevertheless, they also noted risks to the outlook and stressed that they are ready to adjust policy "in a timely manner as warranted", but provided little guidance on whether they see a rate increase or rate cut as more likely.
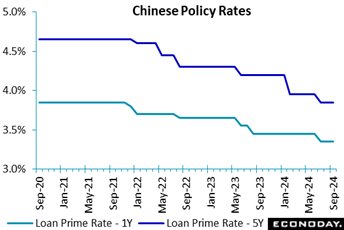
The People's Bank of China left the one-year and five-year loan prime rates unchanged at 3.35 percent and 3.85 percent respectively at its monthly review, in line with the consensus forecast. Both rates were reduced by 10 basis points in July.
Officials characterized monthly activity data published last weekend as showing that "the national economy maintained stability in general while making steady progress", broadly in line with comments made in recent months. However, they also cautioned that "the adverse impacts arising from the changes in the external environment are increasing, effective demands remain insufficient at home, and the sustained economic recovery is still confronted with multiple difficulties and challenges". Officials provided little guidance about whether additional policy measures would be considered in the near-term, and today's decision to leave loan prime rates on hold suggest they currently believe that the reductions implemented in July will provide sufficient support to economic conditions.
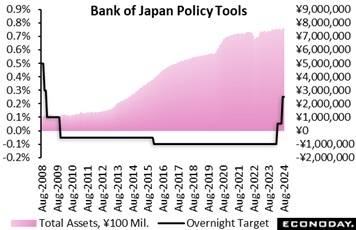 The Bank of Japan's nine-member board decided in a unanimous vote to maintain the target for the overnight interest rate at 0.25 percent after a two-day meeting on Friday. The bank's assessment of the economy unchanged since its view expressed in the quarterly Outlook Report issued in July. It has recovered moderately, although some weakness has been seen in part, and that it is likely to keep growing at a pace above its potential growth rate. The Bank of Japan's nine-member board decided in a unanimous vote to maintain the target for the overnight interest rate at 0.25 percent after a two-day meeting on Friday. The bank's assessment of the economy unchanged since its view expressed in the quarterly Outlook Report issued in July. It has recovered moderately, although some weakness has been seen in part, and that it is likely to keep growing at a pace above its potential growth rate.
The risk assessment also remains the same: "There remain high uncertainties surrounding Japan's economic activity and prices, including developments in overseas economic activity and prices, developments in commodity prices, and domestic firms' wage- and price-setting behavior."
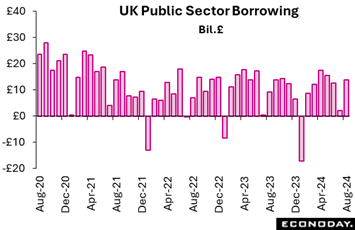 Overall net borrowing (PSNB) was £13.73 billion, larger than July's upwardly revised £3.10 billion and even further above the £9.54 billion recorded a year ago. Excluding public sector banks (PSNB-X), the red ink stood at £13.73 billion, a larger deficit than July's £3.10 billion and last year's £10.47 billion. Both August readings were the highest for the month since 2021 and the third highest August reading ever. Overall net borrowing (PSNB) was £13.73 billion, larger than July's upwardly revised £3.10 billion and even further above the £9.54 billion recorded a year ago. Excluding public sector banks (PSNB-X), the red ink stood at £13.73 billion, a larger deficit than July's £3.10 billion and last year's £10.47 billion. Both August readings were the highest for the month since 2021 and the third highest August reading ever.
Total public sector spending was up £4.6 billion on the year as the effects of inflation more than offset a reduction in debt interest payments. Receipts were up £3.7 billion. Net debt was 100.0 percent of GDP, 4.3 percentage points higher than in August 2023 and roughly in line with the levels last seen in the early 1960s.
The August PSNB-X was £2.5 billion more than forecast by the Office for Budget Responsibility (OBR) and again underlines the fiscal problems facing the new Labour government. Today's update trims the UK RPI to plus 6 and the RPI-P to minus 3, both measures showing that overall economic performance is roughly within market forecast.
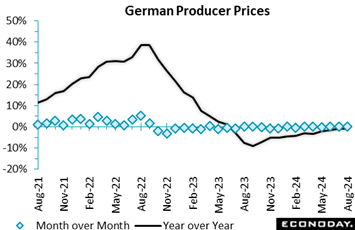
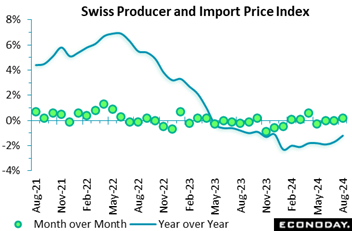 The producer and import price index experienced a slight 0.2 percent increase in August, primarily due to price increases in pharmaceuticals and organic chemical products. This suggests that the costs of critical health-related industries are increasing, which may indicate broader inflationary pressures within the medical supply chain. Nevertheless, the decrease in the price of petroleum products, in conjunction with the availability of lower electricity for large-scale consumers, provides some relief, particularly for energy-intensive industries. The producer and import price index experienced a slight 0.2 percent increase in August, primarily due to price increases in pharmaceuticals and organic chemical products. This suggests that the costs of critical health-related industries are increasing, which may indicate broader inflationary pressures within the medical supply chain. Nevertheless, the decrease in the price of petroleum products, in conjunction with the availability of lower electricity for large-scale consumers, provides some relief, particularly for energy-intensive industries.
The overall index experienced a 1.2 percent decline year-over-year, indicating that the broader economic environment is experiencing deflationary tendencies, despite short-term fluctuations. This could be associated with a decrease in global demand, particularly as petroleum prices continue to decline, which is consistent with international market trends.
The report suggests contrasting sectoral trends, where pharmaceutical products are becoming more expensive, while commodities such as petroleum and non-ferrous metals are declining. This reflects the intricate dynamics of international trade and supply chains.
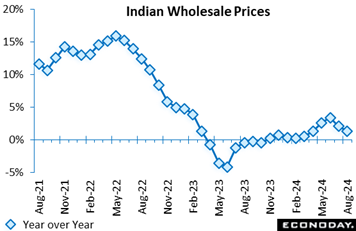 India's wholesale price index rose 1.31 percent on the year in August after increasing 2.04 percent in July. Consumer price data published last week showed a small increase in headline inflation from 3.60 percent in July to 3.65 percent in August, holding below the mid-point of the Reserve Bank of India's target range of two percent to six percent for the second consecutive month. India's wholesale price index rose 1.31 percent on the year in August after increasing 2.04 percent in July. Consumer price data published last week showed a small increase in headline inflation from 3.60 percent in July to 3.65 percent in August, holding below the mid-point of the Reserve Bank of India's target range of two percent to six percent for the second consecutive month.
The smaller year-over-year increase in wholesale prices in August was broad-based across major categories. Food prices, which account for around 15 percent of the index, rose 3.26 percent on the year after increasing 3.55 percent previously. Manufacturing prices, around 64 percent of the index, rose 1.22 percent on the year after a previous increase of 1.58 percent, while fuel prices, around 13 percent of the index, fell 0.67 percent on the year, down from the previous increase of 1.72 percent.
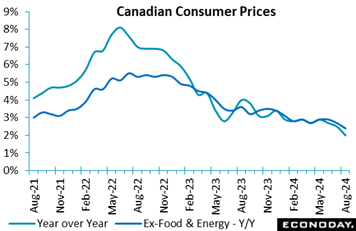 Consumer prices in Canada slipped by 0.2 percent in August from July after rising 0.4 percent in July, not seasonally adjusted, bringing the 12-month increase to 2.0 percent in August from 2.5 percent in July. Forecasters in an Econoday survey looked for increases of 0.1 percent on the month and 2.1 percent from a year ago. Consumer prices in Canada slipped by 0.2 percent in August from July after rising 0.4 percent in July, not seasonally adjusted, bringing the 12-month increase to 2.0 percent in August from 2.5 percent in July. Forecasters in an Econoday survey looked for increases of 0.1 percent on the month and 2.1 percent from a year ago.
Excluding food and energy, the consumer price index declined 0.1 percent on the month and rose 2.4 percent year-over-year. Seasonally adjusted, overall CPI rose 0.1 percent in August from July.
The slowing in consumer prices reduced the annual headline increase to its lowest since February 2021, and is likely to bolster the Bank of Canada's dovish stance. The decline in annual price inflation partly reflected lower gasoline prices, which dropped 5.1 percent, partly due to a base-year effect and partly due to global oil prices. Excluding gas, CPI rose 2.2 percent in August, down from 2.5 percent in July.
Mortgage interest costs and rent remained the biggest factors pushing annual CPI higher. Having said that, the rate of increase in mortgage interest costs slowed for a 12th straight month to 18.8 percent in August, down from a peak of 30.9 percent in August 2023.
The Bank of Canada's own core measures of inflation came in at 2.2 percent year-over-year on average in August, down from 2.4 percent in July and 2.5 percent in June, with all three measures remaining well below 3.0 percent, the top of the bank's one percent to three percent target range.
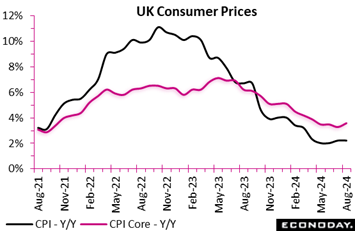
Annual inflation in August remained at 2.2 percent, the same as the annual growth rate in July. Also, the consumer prices index, including owner occupiers' housing costs (CPIH), increased by 3.1 percent year-over-year, consistent with July's rate. The CPIH and CPI monthly inflation rates increased by 0.4 percent and 0.3 percent, respectively, in line with the August 2023 inflation rate.
The increase in airfares was substantial, reversing the decline of the previous year. Inflationary pressures were mitigated by motor fuel prices, restaurants, and hotels. Core CPIH, which excludes volatile components such as energy, food, alcohol, and tobacco, increased from 4.1 percent in July to 4.3 percent. This increase was primarily due to an increase in service costs, which increased from 5.7 percent to 5.9 percent. However, goods prices experienced a more significant decline, going from minus 0.5 percent to minus 0.9 percent. In the same vein, the core CPI increased from 3.3 percent to 3.6 percent, with services inflation increasing to 5.6 percent and commodities inflation falling further into negative territory, from minus 0.6 percent to minus 0.9 percent.
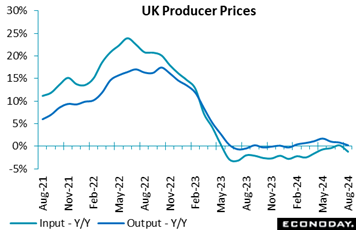
Factory gate prices fell 0.3 percent on the month. With no revisions for July, annual inflation rate eased from July's 0.8 to 0.2. On the month, prices fell sharply for coke and refined petroleum products (4.7 percent) and food products (0.2 percent) but there were gains in alcohol and tobacco products (0.7 percent), chemicals and pharmaceuticals (0.4 percent) and paper and printed materials (0.4). Consequently, core prices fell, trimming the underlying yearly rate to 0.2 percent.
At the same time, raw material and fuel costs dipped 0.5 percent versus June. Following a steeper revised 0.3 percent fall in July. Positive base effects dropped yearly inflation 1.2 percent from July's revised 0.2 percent. Prices of beverages and tobacco rose 0.3 percent and chemicals also rose 0.3 percent but there were falls in crude petroleum and natural gas falling 6.1 percent and domestic food falling 1.6 percent.
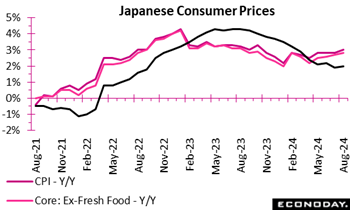 Japan's core inflation (excluding fresh food) picked up to 2.8 percent in August from 2.7 percent in July, as expected. This data series has no direct impact on the Bank of Japan's policy stance at this stage of gradual normalization process. The bank is looking at medium-term inflation expectations, which are still tame. Japan's core inflation (excluding fresh food) picked up to 2.8 percent in August from 2.7 percent in July, as expected. This data series has no direct impact on the Bank of Japan's policy stance at this stage of gradual normalization process. The bank is looking at medium-term inflation expectations, which are still tame.
 Producer prices decreased by 0.8 percent year-over-year, primarily due to a substantial decrease in energy costs, specifically in natural gas and electricity which fell by 10.1 percent and 9.2 percent respectively. Despite a minor month-over-month increase of 0.8 percent, energy prices have decreased, which is indicative of the energy market's volatility. Producer prices increased by 1.2 percent, excluding energy, indicating inflationary pressures in other sectors. Producer prices decreased by 0.8 percent year-over-year, primarily due to a substantial decrease in energy costs, specifically in natural gas and electricity which fell by 10.1 percent and 9.2 percent respectively. Despite a minor month-over-month increase of 0.8 percent, energy prices have decreased, which is indicative of the energy market's volatility. Producer prices increased by 1.2 percent, excluding energy, indicating inflationary pressures in other sectors.
The prices of intermediate products increased slightly by 0.7 percent year-over-year, with electric transformers and building materials experiencing significant increases. Nevertheless, the price of metals experienced a decline of 2.0 percent, with iron and steel experiencing substantial declines. In the interim, machinery and motor vehicles experienced a price increase, while capital goods and consumer goods experienced moderate price growth. Overall, food prices experienced a modest increase; however, commodity-specific inflation was evident in the 41.7 percent increase in the price of specific products, such as butter.
In essence, the data indicates a significant disparity between energy prices, which have experienced a substantial decline, and other sectors such as capital and consumption products, which continue to experience inflationary pressures. The complex dynamics that affect industrial producers are exemplified by this divergence, leaving the RPI at minus 11 and the RPI-P at minus 13, well below market forecasts of the German economy.
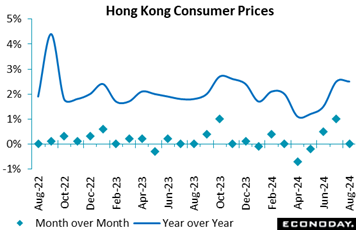 Hong Kong's headline consumer price index rose 2.5 percent on the year in August, as it did in July. The index was flat on the month after rising 1.0 percent previously. Excluding the impact of one-off government measures, Hong Kong's underlying inflation rate was also unchanged at 1.2 percent. Officials expressed confidence that inflation will remain "mild" in the near-term. Hong Kong's headline consumer price index rose 2.5 percent on the year in August, as it did in July. The index was flat on the month after rising 1.0 percent previously. Excluding the impact of one-off government measures, Hong Kong's underlying inflation rate was also unchanged at 1.2 percent. Officials expressed confidence that inflation will remain "mild" in the near-term.
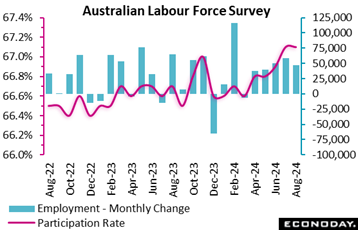
Labour market conditions in Australia remained strong in August, with employment recording an increase well above the consensus forecast and the unemployment and participation rates continuing to indicate tight conditions. This strength will likely keep the focus of the Reserve Bank of Australia on risks to the inflation outlook.
The number of people employed in Australia rose by 47,500 in August, down from an increase of 58,200 in July but well above the consensus forecast for an increase of 31,000. Full-time employment fell by 3,100 persons after a very strong increase of 60,500 last month, while part-time employment rose by 50,600 persons after a previous fall of 2,300 persons. Hours worked rose 0.4 percent on the month, as they did previously.
Today's data also show the unemployment rate was unchanged at 4.2 percent in August. The participation rate was also unchanged at a record high of 67.1 percent.
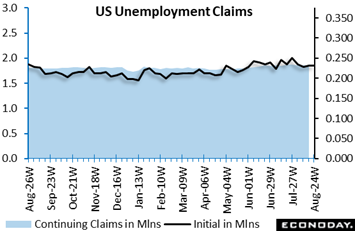
Initial jobless claims are down 12,000 to 219,000 in the September 14 week after a negligible upward revision to 231,000 in the prior week. The level is below the consensus of 230,000 in the Econoday survey of forecasters. The level is the lowest since 216,000 in the May 18 week. The decrease is exaggerated by seasonal adjustment factors which had anticipated a larger increase than occurred. The four-week moving average is down 3,500 to 227,500 in the September 14 week. Despite some week-to-week fluctuations, the underlying trend for new filings for benefits remains consistent with a healthy labor market with relatively normal layoff activity.
The level of insured jobless claims is down 14,000 to 1.829 million in the September 7 week. The change is small but is the third week in a row of declines that suggests the unemployment rolls are coming down slightly. The four-week moving average is down 6,500 to 1.844 million from 1.851 million in the prior week. The decline is small but is the fourth week in a row of declines. Unemployment among those eligible for benefits is consistent with a labor market able to absorb laid-off workers. The insured rate of unemployment is unchanged at 1.2 percent in the September 7 week where it has been with almost no variation since March 2023.
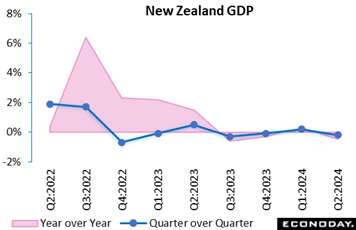 New Zealand's economy contracted modestly in the three months to June for the fifth time in the last seven quarters. Conditions remain impacted by ongoing tight monetary policy put in place by the Reserve Bank of New Zealand, with today's data covering the period prior to officials' decision to cut policy rates by 25 basis points at their most recent meeting last month. Officials noted then that economic growth remains below trend and that the economy is contracting faster than they had anticipated. New Zealand's economy contracted modestly in the three months to June for the fifth time in the last seven quarters. Conditions remain impacted by ongoing tight monetary policy put in place by the Reserve Bank of New Zealand, with today's data covering the period prior to officials' decision to cut policy rates by 25 basis points at their most recent meeting last month. Officials noted then that economic growth remains below trend and that the economy is contracting faster than they had anticipated.
GDP fell 0.2 percent on the quarter in the three months to June after increasing 0.1 percent in the three months to March, with year-over-year growth weakening from an increase of 0.5 percent to a decline of 0.5 percent. The small quarter-over-quarter decline in headline GDP largely reflects slightly weaker growth in private consumption spending and a slowdown in investment spending, offset by a positive contribution to growth by net exports. On a sectoral basis, however, conditions were weak across most major sectors.
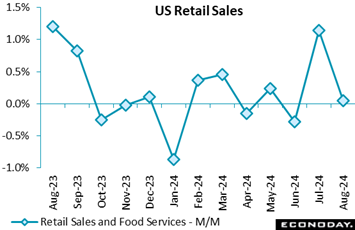 Retail and food services sales are up 0.1 percent in August after a small upward revision to up 1.1 percent in July. The August increase is well above the consensus of down 0.3 percent in the Econoday survey of forecasters. Sales excluding motor vehicles are up 0.1 percent in August after up 0.4 percent in July which is below the consensus of up 0.3 percent in the survey. Motor vehicle sales are up 0.1 percent despite the dip in the number of units sold. Sales at gasoline stations are down 1.2 percent in August after up 0.5 percent in July. Gasoline prices declined in August and likely accounted for most of the decrease. Excluding motor vehicles and gasoline, sales are up 0.2 percent and slightly below the survey consensus of up 0.3 percent. Retail and food services sales are up 0.1 percent in August after a small upward revision to up 1.1 percent in July. The August increase is well above the consensus of down 0.3 percent in the Econoday survey of forecasters. Sales excluding motor vehicles are up 0.1 percent in August after up 0.4 percent in July which is below the consensus of up 0.3 percent in the survey. Motor vehicle sales are up 0.1 percent despite the dip in the number of units sold. Sales at gasoline stations are down 1.2 percent in August after up 0.5 percent in July. Gasoline prices declined in August and likely accounted for most of the decrease. Excluding motor vehicles and gasoline, sales are up 0.2 percent and slightly below the survey consensus of up 0.3 percent.
The narrow increase in retail sales in August suggests that worries that consumer spending will decline sharply in the third quarter 2024 may not come to pass. Spending on big-ticket items that are frequently financed may be deferred as consumers wait to see if more favorable rates are to be had in the near future. Some caution on spending may be creeping in the miasma surrounding the outcome of the US presidential election. Overall, consumers are shopping for items where they see good value and/or are necessary like school supplies.
Motor vehicles and gasoline accounted for 18.9 and 7.3 percent of sales in August, respectively. Elsewhere sales were mixed. The increase with the largest impact in August is a 1.4 percent rise in sales at nonstore retailers, or 17.4 percent of all sales. Nonstore retailers include e-tailers and this suggests that online shopping was relatively strong in August. Sales at food and beverage stores are down 0.7 percent in August but still accounted for 11.7 percent of the total. Sales at general merchandise stores are down 0.3 percent in August and accounted for 10.6 percent of all sales. Restaurant sales are flat in August and are 13.3 percent of the total.
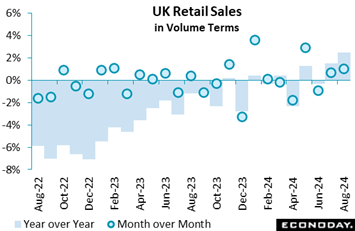 Retail sales experienced substantial growth in August, with volumes increasing by 1.0 percent, following a revised 0.7 percent increase in July. In particular, supermarkets and textile retailers have experienced a significant increase in sales, which can be primarily attributed to favourable weather conditions and end-of-season sales. The sales volumes in August reached their greatest level since July 2022, indicating a 2.5 percent annual growth. This represents the largest annual increase since February 2022. Retail sales experienced substantial growth in August, with volumes increasing by 1.0 percent, following a revised 0.7 percent increase in July. In particular, supermarkets and textile retailers have experienced a significant increase in sales, which can be primarily attributed to favourable weather conditions and end-of-season sales. The sales volumes in August reached their greatest level since July 2022, indicating a 2.5 percent annual growth. This represents the largest annual increase since February 2022.
Nevertheless, retail volumes were marginally lower by 0.4 percent in comparison to pre-pandemic levels (February 2020), suggesting that the effects of COVID-19 are still being felt. Supermarkets were the primary driver of the 1.8 percent increase in sales volumes that food stores experienced in August. In contrast, non-food stores experienced a more modest 0.6 percent increase; however, textile stores were the exception, as they capitalised on end-of-season promotions.
It is intriguing that online expenditure did not increase in August, despite a 4.3 percent year-over-year increase. The total sales expenditure, which encompassed both online and in-store sales, increased by 0.4 percent. However, the proportion of online sales decreased marginally from 27.8 percent in July to 27.6 percent in August.
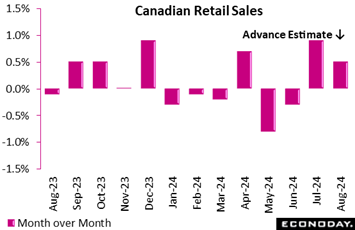 Retail sales in Canada rose by a surprising 0.9 percent in July from June, well above the expected 0.6 percent rebound from June's decline. In volume terms, sales rose an even stronger 1.0 percent on the month. Sales were also up 0.9 percent year-over-year. The advance estimate for August sales suggests nice ongoing resilience with an increase of 0.5 percent. Retail sales in Canada rose by a surprising 0.9 percent in July from June, well above the expected 0.6 percent rebound from June's decline. In volume terms, sales rose an even stronger 1.0 percent on the month. Sales were also up 0.9 percent year-over-year. The advance estimate for August sales suggests nice ongoing resilience with an increase of 0.5 percent.
In July, when consumer prices appreciated 2.5 percent year-over-year, retail sales increases were evident in eight of nine subsectors, led by motor vehicles and parts, which rebounded from a weak showing in June to rise 2.2 percent in July from June. On the downside, sales at gas stations and fuel vendors dipped by 0.6 percent, and in volume terms were down 1.7 percent.
Core retail sales, which omit gasoline and motor vehicles, rose by 0.6 percent in July from June, and were up 0.5 percent from a year ago. The rise in core sales reflected a 0.8 percent rise in food and beverage and a 0.8 percent gain in general merchandise sales.
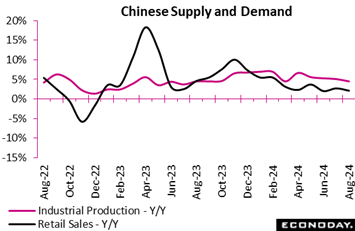 Chinese retail sales rose 2.1 percent on the year in August, slowing from growth of 2.7 percent in July and growth of 2.0 percent in June. Note the latter was the lowest rate since December 2022. In month-over-month terms, retail sales in August fell 0.01 percent after advancing 0.35 percent previously. Chinese retail sales rose 2.1 percent on the year in August, slowing from growth of 2.7 percent in July and growth of 2.0 percent in June. Note the latter was the lowest rate since December 2022. In month-over-month terms, retail sales in August fell 0.01 percent after advancing 0.35 percent previously.
Chinese industrial production rose 4.5 percent on the year in August, slowing from growth of 5.1 percent in July for the lowest growth rate since March. In month-over-month terms, industrial production rose 0.32 percent in August after increasing 0.35 percent in July.
Within the industrial sector, manufacturing output rose 4.3 percent on the year in August after increasing 5.3 percent in July. Utilities output and mining output rose 6.8 percent and 3.7 percent on the year respectively after increasing 4.0 percent and 4.7 percent respectively in July.
Chinese fixed asset investment rose 3.4 percent year-to-date in August, moderating from growth of 3.6 percent in July for the lowest rate of the year. In month-over-month terms, fixed asset investment increased 0.16 percent after falling 0.17 percent previously.
Officials characterized the monthly data published today as showing that "the national economy maintained stability in general while making steady progress", broadly in line with comments made in recent months. However, they also cautioned that "the adverse impacts arising from the changes in the external environment are increasing, effective demands remain insufficient at home, and the sustained economic recovery is still confronted with multiple difficulties and challenges". Officials, however, provided little guidance about whether changes to policy settings will be considered in the near-term.
Data were slightly weaker than consensus expectations.
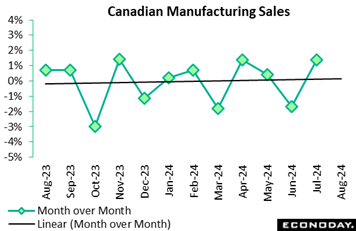
Manufacturing sales rose by 1.4 percent in July from June, slightly better than expectations for a 1.1 percent increase. July rebounded after a revised 1.7 percent drop in June. Real sales also rose 0.9 percent on the month. In year-over-year terms, nominal sales were down 1.1 percent and dropped by a nasty 4.1 percent in real terms.
Look-ahead indicators improved as new orders jumped 3.7 percent on the month and unfilled orders gained 0.6 percent. Inventories increased 0.9 percent, and the inventory-to-sales ratio was flat at 1.73 in July from June and versus 1.69 a year ago.
The unadjusted capacity utilization rate dropped to 78.7 percent in July from 80.2 percent in June and versus 77.7 percent in July a year ago.
The big movers in July were petroleum and coal, up 6.7 percent on the month, and chemical products, up 5.3 percent. On the downside, wood products dropped by 4.8 percent.
By region, sales rose in seven of 10 provinces in July with Saskatchewan up big, 28 percent on the month, and Ontario, the heavyweight, showing the largest decline, down 0.6 percent.
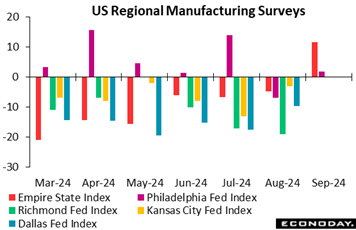
The general business conditions index in the New York Fed's Empire State survey of manufacturing is up sharply this month to 11.5 after minus 4.7 in August. The September reading is substantially higher than the consensus of minus 3.9 in the Econoday survey of forecasters and is the first positive reading since 9.1 in November 2023. The future business conditions index is up to 30.6 after 22.9 in August and is the highest since 36.6 in March 2022.
The general business conditions index can see significant month-to-month fluctuations, so the one-month jump of 16.2 points should be interpreted with caution. Nonetheless, in the context of the performance of the detail index, it does suggest that the regional factory sector is coming out of its long contraction.
The index for new orders is up 17.3 points in September to 9.4, its first positive reading since 5.1 in September 2023. The index for unfilled orders is up 9.5 points to 2.1 in September after flat or contractionary readings since June 2022 apart from a scant expansion at 1.0 in June 2024. The shipments index points to new orders moving out quickly at 17.9 in September after 0.3 in August. The delivery time index is at minus 1.1 in September after minus 3.2 in August and is consistent with a supply chain that is running neither too slow nor too fast. The inventories index is at 0.0 (zero) and indicative of stocks on hand that are neither increasing or decreasing.
The index for employment does remain in contraction at minus 5.7 in September but is firming with modest improvements since June. The index for the average workweek is up to 2.9 in September after minus 17.8 in August and is the first positive since 2.2 in October 2023. While manufacturers may not be hiring, they are offering more hours to those already on payrolls.
The index for prices paid is essentially unchanged at 23.2 in September after 23.4 in August and hints at relatively stable input prices. The index for prices received is down to 7.4 in September after 8.5 in August. Manufacturers are seeing less upward pressure in costs and maintaining some ability to pass through those costs.
The Philadelphia Fed manufacturing index recovered into marginal growth territory in September after contracting in August. The underlying details are mixed, with a notable improvement in employment lifting the overall result while new orders fell back.
The manufacturing index rose to 1.7 from minus 7.0 in August, but the forward-looking new orders component eased to minus 1.5 from a relatively healthy 14.6 in August. The September result nearly matched expectations for 2.0.
Employment, the one to watch these days, rebounded to 10.7 from minus 5.7 in August but its companion, workweek, dropped to minus 13.6 from minus 2.3 in August.
Prices received, the barometer of pricing power, rose to 24.6 from 13.7 and prices paid rose to 34.0 from 24.0, which suggested upward pressure on commodities prices.
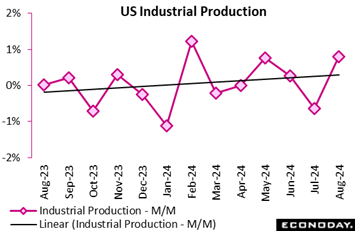
Industrial production rebounds in August to up 0.8 percent after falling 0.9 percent in July when Hurricane Beryl affected a wide area. The August increase is above the consensus of up 0.1 percent in the Econoday survey of forecasters. Output was up 0.9 percent in manufacturing, 0.8 percent in mining, and flat in utilities.
Durables manufacturing is up 2.1 percent in August. It got a boost from a 9.8 percent surge in motor vehicles and parts in August after falling 8.9 percent in the prior month. Nondurables manufacturing is down 0.2 percent with much of it related to a 2.3 percent decline in petroleum and coal products. Excluding motor vehicles, manufacturing is up 0.3 percent.
Mining rose in part as oil and gas well drilling is up 0.3 percent in August after falling 0.3 percent in July when Beryl shut down drilling in the Gulf of Mexico.
Utilities production did not pick up in August as weather was cooler in much of the US during the month. Electricity output is down 0.1 percent while natural gas is up 0.4 percent.
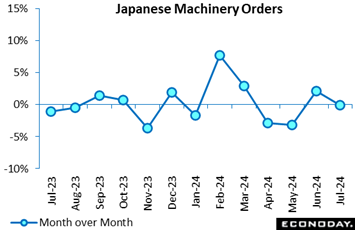 Japanese core machinery orders, the key leading indicator of business investment in equipment, posted their first drop in two months in July, down 0.1 percent after rising 2.1 percent in June and falling 3.2 percent in May. It was largely in line with the median economist forecast of a 0.2 percent drop. Japanese core machinery orders, the key leading indicator of business investment in equipment, posted their first drop in two months in July, down 0.1 percent after rising 2.1 percent in June and falling 3.2 percent in May. It was largely in line with the median economist forecast of a 0.2 percent drop.
The Cabinet Office maintained its assessment, saying, "The pickup in machinery orders is pausing."
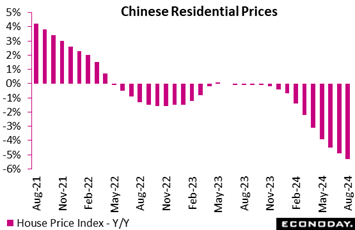 China's residential property prices fell 5.3 percent on the year in August, weakening further from a decline of 4.9 percent in July. This is the biggest year-over-year decline in house prices since 2015 and may prompt additional policy measures to support conditions in the property market. China's property market has been very weak for two years, representing a major drag on investment and consumer spending. China's residential property prices fell 5.3 percent on the year in August, weakening further from a decline of 4.9 percent in July. This is the biggest year-over-year decline in house prices since 2015 and may prompt additional policy measures to support conditions in the property market. China's property market has been very weak for two years, representing a major drag on investment and consumer spending.
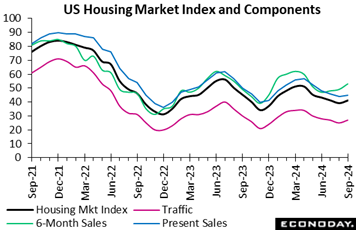 The NAHB/Wells Fargo housing market index is up 2 points to 41 in September after an unrevised 39 in August. The index is above the consensus of 40 in the Econoday survey of forecasters and is up after four months of declines. Recent moderation in mortgage interest rates have returned some optimism to homebuilders with improved affordability for buyers and lower financing costs for construction projects. The NAHB/Wells Fargo housing market index is up 2 points to 41 in September after an unrevised 39 in August. The index is above the consensus of 40 in the Econoday survey of forecasters and is up after four months of declines. Recent moderation in mortgage interest rates have returned some optimism to homebuilders with improved affordability for buyers and lower financing costs for construction projects.
The present sales index is up to 45 in September after 44 in August. The index for buyer traffic is up 2 points to 27 in September and has been little changed for the last four months. The current pace of sales and home shopping reflects ongoing patience on the part of some potential homebuyers who are hoping mortgage rates will come down further. Rates are likely to trend somewhat lower – especially if the FOMC signals more cuts soon. The index for expected sales is up 4 points to 53 in September to its highest since 60 in April.
The Freddie Mac rate for a 30-year fixed rate mortgage is down to 6.20 percent as of the September 12 data, its lowest since 6.02 percent in the September 11 week of 2022. The current rates are enough to bring at least some buyers into the market, although there will be hesitation to commit with the prospect of rates nearer – or even below – 6 percent.
The improvement in builder confidence is seen with less inclination to cut prices or offer incentives in September. The share of builders cutting prices is down to 32 percent in September after 33 percent in August with the average size of the price cut down to 5 percent after 6 percent in the prior month. The share of builders offering incentives is down to 61 percent in September after rising to 64 percent in August.
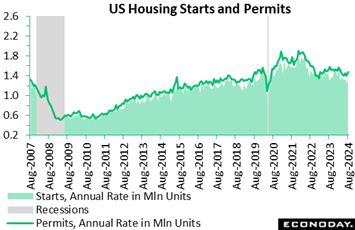 Housing starts are up 9.6 percent in August to 1.356 million units at a seasonally adjusted annual rate after an upward revision to 1.237 million units in July. The increase is above the consensus of 1.300 million units in the Econoday survey of forecasters. Starts are up 3.9 percent year-over-year in August. The jump in starts in August may be partially attributed to Hurricane Beryl in July which limited building activity in some regions. However, declines in mortgage interest rates have renewed builder confidence and willingness to engage in new construction. Housing starts are up 9.6 percent in August to 1.356 million units at a seasonally adjusted annual rate after an upward revision to 1.237 million units in July. The increase is above the consensus of 1.300 million units in the Econoday survey of forecasters. Starts are up 3.9 percent year-over-year in August. The jump in starts in August may be partially attributed to Hurricane Beryl in July which limited building activity in some regions. However, declines in mortgage interest rates have renewed builder confidence and willingness to engage in new construction.
Importantly, it is the single-family home sector which is supporting starts in August. Single-family units are up 15.8 percent to 992,000 units in August while the volatile multi-unit sector is down 4.2 percent to 364,000 units. This suggests that builders see demand returning in segments of the market that were less competitive when more existing housing units came on to the market, particularly for the entry level market.
Moderation in home prices has helped bring some buyers back into the housing market. More compelling may be that mortgage rates started to decline rapidly in early August when it was clear that the Fed was likely to cut rates when the FOMC meets September 17-18. The Freddie Mac rate for a 30-year fixed rate mortgage dropped from 6.73 percent in the August 1 data to 6.47 percent one week later and remained close to that throughout the month.
The number of permits issued in August shows that builders have projects in the pipeline to keep them busy. The number of permits issued are up 4.9 percent to 1.475 million in August after 1.406 million in July. The increase is above the consensus of 1.410 million units in the Econoday survey.
Permits for single family homes are up 2.8 percent to 967,000 in August after 941,000 in July, but down 0.5 percent from a year earlier. Despite the chilling effect of rising prices and relatively high mortgage rates, the demand for single family homes has not been much changed over the past year while housing stock for single-family units has been lean. Permits for multi-unit projects are up 9.2 percent in August to 508,000 from 465,000 in the prior month, but down 16.2 percent from August 2023. Demand for multi-unit housing can be volatile. The August increase is the highest in nearly a year and suggests that the decline in mortgage rates will make homebuying more attractive to renters and/or first-time buyers.
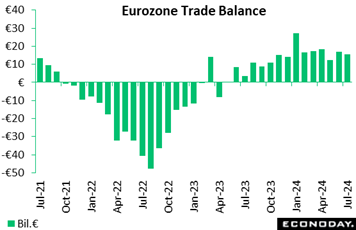 The euro area's trade surplus was reduced from a revised €17.0 billion in June to €15.5 billion in July, as exports increased a monthly 0.8 percent and imports grew 1.6 percent versus prior contraction. The aggregate trade surplus decreased as a result of a diminishing surplus for “other” manufactured products and an increase in the energy deficit, which increased from €22.6 billion to €25.3 billion. Nevertheless, the negative impact was partially mitigated by a substantial rise in the surplus of the chemicals sector, which increased from €20.7 billion to €25.1 billion. The euro area's trade surplus was reduced from a revised €17.0 billion in June to €15.5 billion in July, as exports increased a monthly 0.8 percent and imports grew 1.6 percent versus prior contraction. The aggregate trade surplus decreased as a result of a diminishing surplus for “other” manufactured products and an increase in the energy deficit, which increased from €22.6 billion to €25.3 billion. Nevertheless, the negative impact was partially mitigated by a substantial rise in the surplus of the chemicals sector, which increased from €20.7 billion to €25.1 billion.
Year-over-year, the euro area's exports increased by 11.6 percent in July, reaching €252.0 billion, while imports increased by 4.8 percent. This growth resulted in a remarkable improvement in the euro area’s annual trade balance, with the surplus increasing from €6.7 billion in July 2023 to €21.2 billion in July 2024. This expansion underscores the robust export demand that persists despite the ongoing pressures of rising energy costs. This report takes the RPI to minus 3, within the market consensus of the Eurozone, and the RPI-P to minus 12, signalling the underperformance of the Eurozone relative to market estimates.
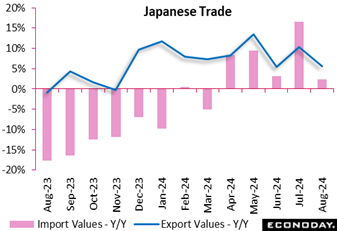
Japanese export values rose 5.6 percent for the ninth straight year-over-year increase in August, led by solid demand for semiconductors and semiconductor-making equipment, but the rate of growth was slower than the consensus forecast of a 10.0 percent. Import values gained 2.3 percent, also much smaller than the consensus call of 13.7 percent. The fifth straight increase was led by drugs, refined petroleum products and computers.
The trade balance recorded a ¥695.3 billion deficit, much that the median forecast of a ¥1,456.25 billion deficit and followed a revised ¥628.7 billion shortfall.
Shipments to China, a key export market for Japanese goods, posted their ninth straight increase. Japanese exports to the European Union fell on year for the fifth straight month and even to exports to the U.S. marked their first drop in 35 months.
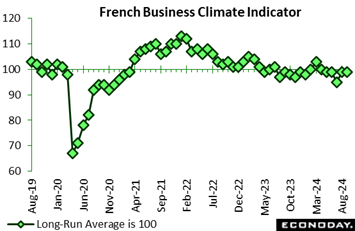 The manufacturing industry's business climate remained stable in September, reporting an index value of 99, which is just below the long-term average of 100. The balance of opinion regarding past production has bounced back, indicating a positive outlook. Nevertheless, order books experienced a decline, which implies that there is some uncertainty regarding future demand. The manufacturing industry's business climate remained stable in September, reporting an index value of 99, which is just below the long-term average of 100. The balance of opinion regarding past production has bounced back, indicating a positive outlook. Nevertheless, order books experienced a decline, which implies that there is some uncertainty regarding future demand.
After a fleeting recovery in August, the food products and beverages sector experienced a decline, with its business climate indicator declining to 94. This was due to the deterioration of order books and production expectations. The manufacturing of apparatus and equipment products also encountered difficulties, extending a four-month downward trend and reaching its lowest point since August 2020.
In the interim, the transport equipment sector demonstrated resilience, with motor vehicles, trailers, and semi-trailers exhibiting robust performance. The indicator remained substantially above the long-term average as production levels rebounded. Conversely, the production of other transport equipment experienced a minor decline, despite remaining above the average.
The business climate indicator in the other manufacturing category decreased to 94, indicating challenges in a variety of sub-sectors, except other industrial products, which exhibited some stability. The manufacturing industry's overall stability is maintained; however, sector-specific vulnerabilities, primarily in the agricultural and machinery sectors, continue to weigh on the overall outlook, leaving the RPI at 14 and RPI-P at 20 respectively, well ahead of market forecasts of the French economy.
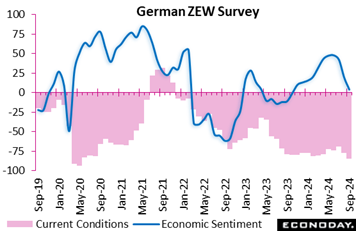
The steep decline in the ZEW indicator of economic sentiment indicates swiftly diminishing optimism regarding Germany's economic recovery. The indicator experienced a 15.6-point fall in September to 3.6, its lowest level since November 2023. This steep decline suggests increasing pessimism, as the optimism that prevailed in previous months has dissipated. In addition, Germany's current economic situation was evaluated at a dismal minus 84.5 points, the lowest since May 2020. This was attributed to several economic concerns, as financial specialists are evenly divided between optimists and pessimists.
The Eurozone is also experiencing a rise in pessimism, as its economic sentiment indicator has decreased by 8.6 points, resulting in a reading of 9.3 points. Similarly, the Eurozone's situation indicator decreased by 8 points to minus 40.4 points, indicating a heightened level of apprehension throughout the region. The rapid declines indicate that financial analysts have already taken into consideration the European Central Bank's interest rate decisions, underscoring the more extensive obstacles that Europe's economic recovery is currently encountering.
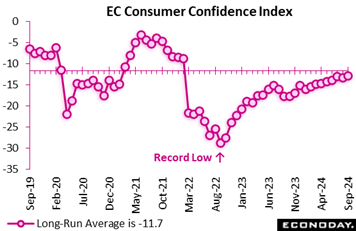 Consumer confidence for the euro area edged up in September to minus 12.9 from minus 13.4 in August and the expected minus 13.3, a welcome sign of modest improvement. The latest outturn narrows the gap with its long-run average of minus 11.7 to 1.2 points from 1.7 in August. Consumer confidence for the euro area edged up in September to minus 12.9 from minus 13.4 in August and the expected minus 13.3, a welcome sign of modest improvement. The latest outturn narrows the gap with its long-run average of minus 11.7 to 1.2 points from 1.7 in August.
Global data held steady in the underperformance column, ending the week at minus 13 on Econoday’s Relative Performance Index (RPI) and at minus 17 when excluding price data (RPI-P), the latter indicating only slightly greater underperformance in real economic activity.
In the Eurozone, economic activity continued to undershoot market forecasts but much less so than previously, with the RPI ending the week RPI at minus 5 and the RPI-P at minus 17.
In the UK, upside and downside surprises effectively cancelled each other out. This left both the RPI at 6 and RPI-P at -3 and so close enough to zero to indicate overall economic activity performing much as expected.
In Japan, the RPI (-9) has moved down from slightly positive to slightly negative surprise territory while the RPI-P (2) is positive, but only just, indicating that overall economic activity is performing close to expectations.
China’s RPI and RPI-P plunged to minus 65 and minus 70 respectively indicating that Chinese data in sum are coming in well below consensus forecasts. Such levels were not weak enough to prompt another cut in loan prime rates but must at least keep the door open to further monetary easing down the road.
Ironically considering the Fed’s aggressive easing this week, Both the RPI and RPI-P for the US ended the week at plus 30, indicating that recent US data are now coming in generally ahead of Econoday's consensus forecasts.
Canada data in contrast have begun to underperform Econoday’s consensus estimates, with the RPI falling to minus 24 and the RPI-P to minus 14. Economic activity is generally moving even weaker market forecasts for this economy meaning that not only is another 25-basis-point ease by the Bank of Canada next month a probability, but even a larger 50 basis point move is at least a possibility.
**Contributing to this article were Jeremy Hawkins, Brian Jackson, Mace News, Max Sato, Olajide Oyadeyi, and Theresa Sheehan
PMI flashes for September will kick off the week Monday with the newest insights into the state of the economies of India, France, Germany, the UK, the European Union, and the US from the purchasing managers’ perspective.
German PMI Flashes for September (Mon 0930 CEST; Mon 0730 GMT; Mon 0330 EDT)
Consensus Forecast, Composite: 48.3
Consensus Forecast, Manufacturing: 42.0
Consensus Forecast, Services: 51.0
Manufacturing in August remained deeply depressed at 42.4. Not much further improvement is expected for September where the consensus is 42.0. Services, which in August fell 1.3 points to 51.2, are seen at 51.0. Consensus for September’s composite is 48.3 following August’s 48.4.
Eurozone PMI Flashes for September (Mon 1000 CEST; Mon 0800 GMT; Mon 0400 EDT)
Consensus Forecast, Composite: 50.6
Consensus Forecast, Manufacturing: 45.5
Consensus Forecast, Services: 52.5
The composite is expected to fall 0.4 points to 50.6 in September versus 51.0 in August. Strength in services lifted August’s composite, rising 1 full point to 52.9 with September seen at 52.5. Manufacturing in September is expected to weaken further to 45.5 versus a very weak score of 45.8 score in each of the prior three months.
UK PMI Flashes for September (Mon 0930 BST; Mon 0830 GMT; Mon 0430 EDT)
Consensus Forecast, Composite: 53.3
Consensus Forecast, Manufacturing: 52.5
Consensus Forecast, Services: 53.5
Manufacturing, up 4 tenths to 52.5 in August, has held over the 50 line the last four reports with September seen at 52.5 again. Services, climbing 1.2 points in August to 53.7, has held over 50 the last 10 reports, with September’s consensus at 53.5. The composite is expected to fall to 53.3 from 53.8.
US Chicago Fed National Activity Index for August (Mon 0830 EDT; Mon 1230 GMT)
Consensus Forecast: 0.0
Consensus Range: -0.6 to 0.2
The national activity index is expected to rise to 0.0 in August versus minus 0.34 in a July report that saw three of four components in the negative column, including production that was likely hit by Hurricane Beryl.
US PMI Composite Flash for September (Mon 0945 EDT; Mon 1345 GMT)
Consensus Forecast, Composite: 53.0
Consensus Range: 53.0 to 53.3
Consensus Forecast, Manufacturing: 48.5
Consensus Range: 48.0 to 50.2
Consensus Forecast, Services: 55.2
Consensus Range: 54.0 to 56.0
September’s consensus for manufacturing is up 0.6 points at 48.5 versus August’s 47.9 which was down 1.7 points from July and down 3.7 points from June. Services, in contrast, rose 7 tenths in August to a very solid 55.7 with the consensus for September at 55.2.
Composite is seen at 53.0, down from 54.6 in August.
Republic Bank of Australia Announcement (Tue 1430 AEST; Tue 0430 GMT; Tue 0030 EDT)
Consensus Forecast, Change: 0 basis points
Consensus Forecast, Level: 4.4%
The Reserve Bank of Australia kept its policy rate steady at 4.35 percent at its August meeting, warning that inflation was high, and Governor Bullock told reporters that the board discussed raising rates but not cutting them. The RBA is expected to hold steady once again.
German Ifo for September (Tue 1000 CEST; Tue 0900 GMT; Tue 0400 EDT)
Consensus Forecast, Business Climate: 86.1
Consensus Forecast, Current Conditions: 86.0
Consensus Forecast, Business Expectations: 86.4
September’s business climate is expected to fall 0.5 points to 86.1 following August’s steady reading of 86.6.
Case-Shiller, 20-City Unadjusted Index (Tue 0900 EDT; Tue 1300 GMT)
Consensus Forecast, Y/Y: 5.9%
Consensus Range: 5.8% to 5.9%
Forecasters see the unadjusted annual growth is seen at 5.9 percent versus July’s percent 6.5 percent rate that was down from June’s 6.9 percent.
US FHFA House Price Index for July (Tue 0900 EDT; Tue 1300 GMT)
Consensus Forecast - M/M: -0.1%
Consensus Range: -0.2% to 0.2%
The house price index is expected to edge down 0.1 percent on the month in July following the 0.1 percent contraction in June. Month-to-month readings in this report are tied to changes in mortgage rates which can be volatile.
US Consumer Confidence Index for September (Tue 1000 EDT; Tue 1400 GMT)
Consensus Forecast: 103.0
Consensus Range: 102.0 to 104.4
The consumer confidence index in September is expected to edge down 0.3 points to the consensus forecast of 103.0 from 103.3 in August. US confidence has been flat and subdued.
Australian August CPI (Wed 1130 AEST; Wed 0130 GMT; Tue 2130 EDT)
Consensus Forecast, Year over Year: 2.9%
Consumer prices in August are expected to slow to a 2.9 percent year-over-year growth rate versus July’s 3.5 percent rate which was down from June’s 3.8 percent.
US New Home Sales for August (Wed 1000 EDT; Wed 1400 GMT)
Consensus Forecast: 700.0 K
Consensus Range: 650.0 K to 744.0 K
After missing estimates in the prior three reports, July’s 739,000 rate exceeded Econoday’s high estimate by nearly 100,000 and, along with upward revisions, repositioned new homes as a new force in the economy. The consensus forecast for September calls for sales to come in only slightly weaker, at 700,000.
German GfK Consumer Climate for October (Thu 0800 CEST; Thu 0600 GMT; Thu 0200 EDT)
Consensus Forecast: -22.3
Consumer confidence in Germany took a sharp downturn in the outlook for September, dampened by declining income expectations and a slight rise in the propensity to save. After September’s minus 22.0, the consumer climate index in October is expected to fall further to minus 22.3.
Swiss National Bank Monetary Policy Assessment (Thu 0930 CEST; Thu 0730 GMT; Thu 0330 EST)
Consensus Change Forecast: -25
Consensus Level Forecast: 1.0%
After a cut of 25 basis points to 1.25 percent in June following March’s unexpected 25-point reduction, forecasters are calling for another cut of 25 basis points this time, and the rate level at 1.00 percent.
Eurozone M3 Money Supply for August (Thu 1000 CEST; Thu 0800 GMT; Thu 0400 EST)
Consensus Forecast, Year-over-Year: 2.5%
The 3-month moving average is expected to increase 2.5 percent in August following July’s 2.0 percent increase that extended a trend of gains consistent with gradual economic recovery.
US Durable Goods Orders for August (Thu 0830 EDT; Thu 1230 GMT)
Consensus Forecast: Month over Month: -2.7%
Consensus Forecast: Ex-Transportation - M/M: 0.0%
Consensus Forecast: Core Capital Goods Orders - M/M: 0.0%
Forecasters see durable goods orders falling 2.7 percent in August following a 9.8 percent aircraft-driven rebound in July. Ex-transportation orders are seen unchanged in August with core capital goods, which dropped 0.1 percent in July, expected to remain unchanged as well.
US GDP for Second Quarter (Final) (Thu 0830 EDT; Thu 1230 GMT)
Consensus Forecast: 3.0%
Consensus Range: 2.9% to 3.0%
Personal Consumption Expenditures
Consensus Forecast: 2.9%
Consensus Range: 2.9% to 2.9%
Consensus for the third estimate of second-quarter GDP is 3.0 percent growth versus 3.0 percent in the second estimate. Personal consumption expenditures, at 2.9 percent growth in the second estimate, is expected to come in at 2.9 percent in the third estimate.
US Jobless Claims for week of September 21 (Thu 0830 EDT; Thu 1230 GMT)
Consensus Forecast: 224.5 K
Consensus Range: 218.0 K to 230.0 K
Jobless claims appear to have settled near the 230,000-level consistent with tight labor conditions. Consensus for the September 21 week is at 224,500.
US Pending Home Sales Index for August (Thu 1000 EDT; Thu 1400 GMT)
Consensus Forecast: 3.1%
Consensus Range: 1.2% to 4.3%
Pending home sales in August, which in July fell an unexpected 5.5 percent despite lower rates in the month, are seen rising 3.1 percent.
German Unemployment Rate for September (Fri 0955 CEST; Fri 0755 GMT; Fri 0355 EDT)
Consensus Forecast: 6.1%
September’s unemployment rate is expected to rise 1 tenth to 6.1 percent. Despite a steady unemployment rate, the number of unemployed has been on the rise and job vacancies have been on the decline.
Eurozone: EC Economic Sentiment for September (Fri 1100 CEST; Fri 0900 GMT; Fri 0500 EDT)
Consensus Forecast: 96.3
Consensus Forecast, Industry Sentiment: -10.0
Consensus Forecast, Consumer Sentiment: -12.9
Economic sentiment in September is expected to decline by 0.3 points to 96.3 from August’s 96.6 which, despite rising 0.6 points to its highest level since May last year, extended a long flat trend well short of the 100 long-run average.
Canadian Monthly GDP for July (Fri 0830 EDT; Fri 1230 GMT)
Consensus Forecast, Month over Month: 0.1%
After no change in June and only a 0.1 percent rise in May, GDP in July is expected to rise 0.1 percent.
US International Trade in Goods (Advance) for August (Fri 0830 EDT; Fri 1230 GMT)
Consensus Forecast, Balance: -$100.0 billion
The US goods deficit (Census basis) is expected to narrow by $2.8 billion to $100.0 billion in August after deepening by $6.4 billion in July to $102.8 billion.
US Personal Income for August (Fri 0830 EDT; Fri 1230 GMT)
Consensus Forecast, Month over Month: 0.4%
Consensus Range: 0.2% to 0.6%
US Consumption Expenditures
Consensus Forecast, Month over Month: 0.3%
Consensus Range: 0.1% to 0.4%
US PCE Price Index
Consensus Forecast, Month over Month: 0.1%
Consensus Range: 0.1% to 0.2%
Consensus Forecast, Year over Year: 2.3%
Consensus Range: 2.2% to 2.4%
US Core PCE Price Index
Consensus Forecast, Month over Month: 0.2%
Consensus Range: 0.1% to 0.2%
Consensus Forecast, Year over Year: 2.7%
Consensus Range: 1.7% to 2.7%
Personal income is expected to rise 0.4 percent in August with consumption expenditures expected to crease 0.3 percent. These would compare with July’s increases of 0.3 percent for income and 0.5 percent for consumption. Inflation readings for August are expected at monthly increases of 0.1 percent overall and 0.2 percent for the core (versus 0.2 percent in July for both). Annual rates are expected at 2.3 percent overall and 2.7 percent for the core (versus 2.5 and 2.6 percent).
US Wholesale Inventories (advance) for August, M/M (Fri 0830 EDT; Fri 1230 GMT)
Consensus Forecast: 0.2%
Consensus Range: 0.1% to 0.2%
Wholesale inventories are seen rising 0.2 percent in August following July’s 0.3 percent increase.
US Consumer Sentiment for September (final) (Fri 1000 EDT; Fri 1400 GMT)
Consensus Forecast: 69.0
Consensus Range: 69.0 to 69.3
Year-Ahead Inflation Expectations
Consensus Forecast: 2.7
Consensus Range: 2.7 to 2.7
Consumer sentiment is expected at 69.0 for final September versus the preliminary reading of 69.0 which was up 1.1 points from August. Year-ahead inflation expectations for final August are expected at 2.7 percent, unchanged from the preliminary report.
|
