|
Data released in the week ended September 27 is somewhat out of date given the FOMC decision to cut the fed funds target rate by a hefty 50 basis points on September 18. The cut in short-term rates means that financial market conditions have eased further along with rising hopes for another cut of 25 basis points at the November 6-7 FOMC meeting and/or at the December 17-18 deliberations. Any boost to the US economy will not be particularly visible before the September economic data reports, and more likely to show up in the October data.
 In particular, the data on the housing market reflects mortgage rates as they were in June, July, and August when consumers were pre-qualifying for home loans. The monthly average for a Freddie Mac 30-year fixed rate mortgage was 6.92 percent in June, had dipped to 6.82 percent in July, and then slid to 6.44 percent in August. As of the September 26 week, the rate on a 30-year note is down to 6.08 percent which is the lowest since 6.09 percent in the February 2, 2023 week. In particular, the data on the housing market reflects mortgage rates as they were in June, July, and August when consumers were pre-qualifying for home loans. The monthly average for a Freddie Mac 30-year fixed rate mortgage was 6.92 percent in June, had dipped to 6.82 percent in July, and then slid to 6.44 percent in August. As of the September 26 week, the rate on a 30-year note is down to 6.08 percent which is the lowest since 6.09 percent in the February 2, 2023 week.
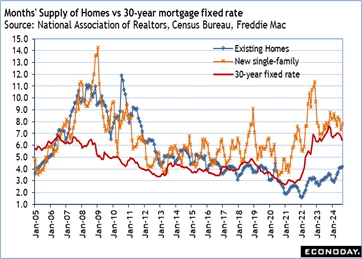 If sales of existing homes were reported down 2.5 percent to a 3.86 million annual rate for August in the September 20 week, in the current week, sales of new single-family homes for August are reported down 4.7 percent to 716,000 units at an annual rate. Purchase activity remains cautious with the prospect of lower rates ahead. Interestingly, the MBA weekly data on mortgages has shown rising refinancing activity in recent weeks. Current mortgage holders who took out loans while rates were close to or above 7 percent are locking in lower monthly housing costs. In some cases these are holders of adjustable rate mortgages getting ahead of any reset in the near future, or these could be fixed rate mortgages that were taken out when rates were more than 100 basis points higher. If sales of existing homes were reported down 2.5 percent to a 3.86 million annual rate for August in the September 20 week, in the current week, sales of new single-family homes for August are reported down 4.7 percent to 716,000 units at an annual rate. Purchase activity remains cautious with the prospect of lower rates ahead. Interestingly, the MBA weekly data on mortgages has shown rising refinancing activity in recent weeks. Current mortgage holders who took out loans while rates were close to or above 7 percent are locking in lower monthly housing costs. In some cases these are holders of adjustable rate mortgages getting ahead of any reset in the near future, or these could be fixed rate mortgages that were taken out when rates were more than 100 basis points higher.
In any case, the ability to lock in a fixed rate mortgage at around 6 percent should help bring some homebuyers into the market, especially with more inventory to choose from and greater power to negotiate on terms of sale.
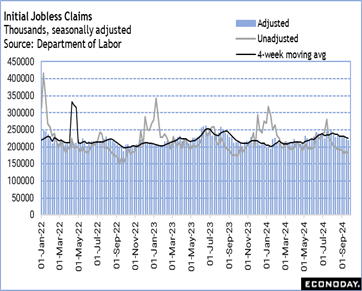
Much of the justification for a larger rate cut at the September FOMC meeting was to ensure that the job market did not decelerate further. It is too soon to say that the easing in monetary policy restriction will have the desired effect and keep hiring from slowing further. However, Fed policymakers will be able to look at the weekly data on jobless claims and feel some assurance that the number of workers being laid off is not rising even if fewer hires are taking place.
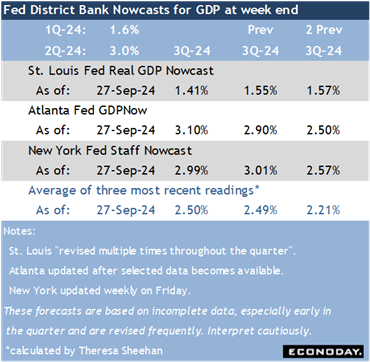
The US economy turned in solid growth in the second quarter 2024 with GDP up 3.0 percent, while early forecasts for the third quarter point to growth of around 2.5 percent based on available data. Underlying conditions should be strong enough to absorb any workers being laid off as well as new entrants to the labor force.
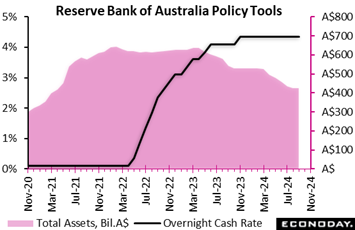 The Reserve Bank of Australia left its main policy rate, the cash rate, unchanged at 4.35 percent at its meeting Tuesday, in line with the consensus forecast. Officials increased this rate by 25 basis points in November 2023 but have since left it unchanged. Over this period, officials have noted that previous policy tightening should help return inflation to within their target range of two percent to three percent over the forecast period. The Reserve Bank of Australia left its main policy rate, the cash rate, unchanged at 4.35 percent at its meeting Tuesday, in line with the consensus forecast. Officials increased this rate by 25 basis points in November 2023 but have since left it unchanged. Over this period, officials have noted that previous policy tightening should help return inflation to within their target range of two percent to three percent over the forecast period.
In the statement accompanying the decision, however, officials expressed concern about recent inflation data, with quarterly CPI data showing underlying inflation at 3.9 percent in the three months to June. Although officials expect the monthly CPI data to show a near-term fall in headline inflation in response to government measures aimed at easing cost of living pressures, they noted again that they do not expect inflation to return to the target range until 2026.
Although officials left policy on hold, they reiterated that returning inflation to target remains their highest priority. Speaking after the decision, RBA Governor Michele Bullock advised that officials did not "explicitly consider" raising rates at today's meeting, as they did in their two previous meetings, but she also reiterated that she currently does not expect policy will be loosened in coming months. The RBA's next meeting is scheduled for early November.
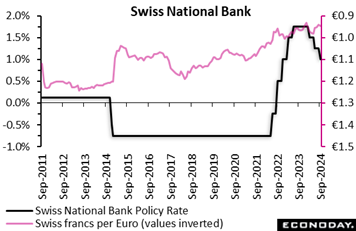 In line with market expectations, the SNB reduced its main policy rate by 25 basis points to 1.00 percent at its quarterly Monetary Policy Assessment (MPA). The latest cut was the third in a row with the benchmark rate having already been lowered by 25 basis points in both March and June. The new level matches the lowest since December 2022. Officials also reiterated that they remain willing to be active in the foreign exchange market "as necessary". In line with market expectations, the SNB reduced its main policy rate by 25 basis points to 1.00 percent at its quarterly Monetary Policy Assessment (MPA). The latest cut was the third in a row with the benchmark rate having already been lowered by 25 basis points in both March and June. The new level matches the lowest since December 2022. Officials also reiterated that they remain willing to be active in the foreign exchange market "as necessary".
The bank’s move reflects surprisingly low inflation since the June MPA, in part attributed by the bank to the appreciation of the Swiss franc. As a result, the new forecast is significantly lower than last time. Hence, annual inflation is now seen at 1.2 percent this year (versus 1.3 percent in June), 0.6 percent in 2025 (1.1 percent) and 0.7 percent in 2026 (1.0 percent). The revised projection is within the SNB's price stability definition but at the weaker end. As such, the bank noted that further easing may be needed to ensure price stability over the medium-term. Without today's cut, the new forecast would be even weaker.
In terms of the real economy, GDP growth is still expected to be quite modest at 1.0 percent in 2024 before accelerating slightly to 1.5 percent in 2025. Unemployment should continue to rise slightly while capacity utilization declines. However, uncertainty surrounding the global economy remains high.
In sum, today's policy statement is clearly dovish and points to more rate cuts should inflation continue to decline. The real policy rate is now minimally negative but that may not be enough to put a floor under consumer prices, especially should the franc stay strong.
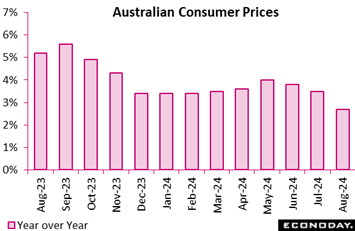 Monthly CPI data show headline inflation in Australia fell from 3.5 percent in July to 2.7 percent in August, below the consensus forecast of 2.9 percent. This is the third consecutive decline in headline inflation and takes the level to within the Reserve Bank of Australia's target range of two percent to three percent for the first time in nearly three years. This monthly indicator measures the year-over-year change in the CPI index compared with the same month twelve months earlier. Monthly CPI data show headline inflation in Australia fell from 3.5 percent in July to 2.7 percent in August, below the consensus forecast of 2.9 percent. This is the third consecutive decline in headline inflation and takes the level to within the Reserve Bank of Australia's target range of two percent to three percent for the first time in nearly three years. This monthly indicator measures the year-over-year change in the CPI index compared with the same month twelve months earlier.
The fall in headline inflation in August was largely driven by energy costs, with automotive fuel prices falling 7.6 percent on the year after a previous increase of 4.0 percent and electricity prices falling 17.9 percent on the year after a previous decline of 5.1 percent. This fall in electricity prices was driven by government rebates. Were it not for these rebates, electricity prices would have risen by 0.1 percent in August. Other categories of spending also recorded smaller price increases, including food, clothing, communications, and education.
Today's data show a moderation in underlying price pressures in August. The measure of inflation that excludes volatile items – including fuel and holiday travel – fell from 3.7 percent in July to 3.0 percent in August while the monthly trimmed mean measure fell from 3.8 percent to 3.4 percent.
At the RBA's previous meeting, held earlier in the week, officials highlighted uncertainties impacting the inflation outlook and again reiterated that returning inflation to target remains their highest priority. Officials also noted that they see little prospect of reducing policy rates over the rest of the year. Though August's update showing a moderation in underlying prices pressures will be welcomed by the RBA, officials have previously advised that they will discount the impact of the government rebates on headline inflation.
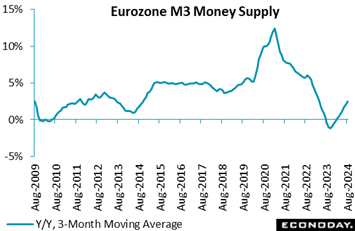 M3 growth accelerated quite sharply in August. At 2.9 percent, the highest since January 2023, the yearly rate was up 0.6 percentage points versus July and strong enough to lift the headline 3-month moving average rate from 2.0 percent to 2.5 percent, a tick above the market consensus. Monthly growth was a solid 0.5 percent. M3 growth accelerated quite sharply in August. At 2.9 percent, the highest since January 2023, the yearly rate was up 0.6 percentage points versus July and strong enough to lift the headline 3-month moving average rate from 2.0 percent to 2.5 percent, a tick above the market consensus. Monthly growth was a solid 0.5 percent.
As usual, the pick-up in the yearly change was dominated by narrow money M1 where growth rose from minus 3.1 percent to minus 2.1 percent. Amongst the main M3 counterparts, private sector loans were up 1.4 percent after a 1.0 percent increase previously. Adjusted for the effects of transfers to and from MFI balance sheets as well as for notional cash pooling services, the rate increased from 1.3 percent to 1.6 percent, its fastest pace since July 2023. Within this, lending to households edged up from 0.5 percent to 0.6 percent as borrowing for consumption climbed from 2.9 percent to 3.1 percent. Loans for house purchase were also a tick firmer at 0.6 percent and borrowing by non-financial corporations increased from 0.6 percent to 0.8 percent, a 13-month peak.
In line with recent months, the August update is consistent with only a sluggish recovery in the Eurozone economy. Another cut in key ECB interest rates would be welcomed by businesses and households alike. Today's data put the Eurozone RPI at minus 19 and the RPI-P at minus 22. Economic activity in general continues to undershoot market expectations.
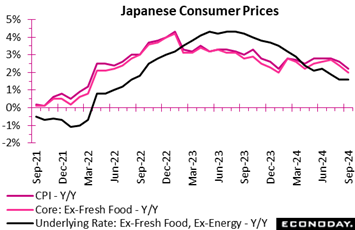 Consumer inflation in Tokyo, the leading indicator of the national average, eased or steadied as expected in September, in line with an expected deceleration in utility markups. The core reading (only fresh food is excluded) showed a 2.0 percent increase after accelerating to 2.4 percent in August from July's 2.2 percent. The year-over-year rise in the total CPI also slowed to 2.2 percent from 2.6 percent. The annual rate for the core-core CPI (excluding fresh food and energy) was unchanged at 1.6 percent after rising from 1.5 percent. Consumer inflation in Tokyo, the leading indicator of the national average, eased or steadied as expected in September, in line with an expected deceleration in utility markups. The core reading (only fresh food is excluded) showed a 2.0 percent increase after accelerating to 2.4 percent in August from July's 2.2 percent. The year-over-year rise in the total CPI also slowed to 2.2 percent from 2.6 percent. The annual rate for the core-core CPI (excluding fresh food and energy) was unchanged at 1.6 percent after rising from 1.5 percent.
The government ended its 18-month-long subsidies in June for July bill payments, which pushed up overall energy costs in July and its impact lingered in August. Dangerously high temperatures of around 40 degrees Celsius boosted prices for air conditioners in August but their effects have eased slightly in September, leading to a smaller increase in durable goods prices.
The Bank of Japan is focused on medium-term inflation outlook and its process of raising interest rates gradually toward more normal levels from around zero percent is not dictated by CPI data.
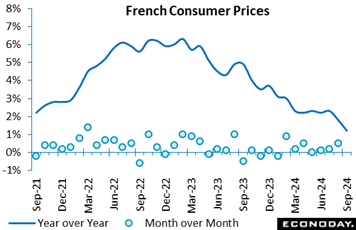 The consumer price index rose 1.2 percent year-over-year in September, significantly less than the 1.8 percent rise recorded in August. The primary cause of this decline is the fall in energy prices, particularly petroleum products. This trend is also influenced by a delayed increase in service prices and a quicker decline in the prices of manufactured products. In contrast, food and tobacco prices remain stable compared to the previous month. The consumer price index rose 1.2 percent year-over-year in September, significantly less than the 1.8 percent rise recorded in August. The primary cause of this decline is the fall in energy prices, particularly petroleum products. This trend is also influenced by a delayed increase in service prices and a quicker decline in the prices of manufactured products. In contrast, food and tobacco prices remain stable compared to the previous month.
Month-over-month, consumer prices dipped 1.2 percent, the most significant decline since 1990. This is influenced by seasonal factors, a significant decrease in energy and healthcare costs, and reduced transport and accommodation prices following the Olympic Games.
The harmonised index of consumer prices showed a 1.5 percent year-over-year increase and a 1.2 percent monthly decline, indicating substantial price adjustments in a variety of economic sectors. These dynamics indicate that inflation is decreasing, primarily due to price adjustments in the energy and service sectors.
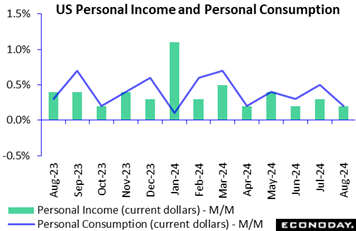
Personal income is up 0.2 percent in August from July after an unrevised up 0.3 percent in July from June. The increase in August is below the consensus of up 0.4 percent in the Econoday survey of forecasters. However, wages and salaries are up 0.5 percent in August. There is a 0.5 percent decline in personal income receipts on assets and proprietors' income with inventory valuation and capital consumption adjustments are down 0.2 percent due to a decline of 0.3 percent in nonfarm proprietors' income.
Personal consumption expenditures are up 0.2 percent in August from July after an unrevised up 0.5 percent in July from June. The increase is just below the consensus of up 0.3 percent in the Econoday survey. Spending on durables is down 0.2 percent in August and probably due to the weakness in motor vehicle sales and other big-ticket items for which financing is necessary. Some spending may have been deferred as consumers wait for lower interest rates. Spending on nondurables is down 0.1 percent in August at least in part due to lower prices for motor fuels. Spending on services is up 0.4 percent and probably related things like vacation costs and the start of a new school year.
The PCE deflator – the Fed's preferred measure of inflation – is up a scant 0.1 percent month-over-month in August and up 2.2 percent year-over-year. The core PCE deflator – excluding food and energy – is also up 0.1 percent in August from the prior month, and up 2.7 percent year-over-year. The all-items deflator is nearing the Fed's 2 percent inflation objective, although the core increase remains somewhat elevated. While commodities price inflation has moderated significantly, prices in the non-housing services sector and for shelter costs are less responsive to restrictive monetary policy.
The report includes annual revisions to the national economic accounts and run back through January 2019.
Initial jobless claims are down 4,000 to 218,000 in the September 21 week after a 3,000 upward revision to 222,000 in the prior week. The level is well below the consensus of 225,000 in the Econoday survey of forecasters. The four-week moving average is down 3,500 to a revised 224,750 in the September 14 week. Despite some week-to-week fluctuations, the underlying trend for new filings for benefits has been coming down a bit and remains consistent with a healthy labor market with relatively normal layoff activity. Markets should find it reassuring that the job market is holding up. The latest report supports Federal Reserve's Chair Jerome Powell's reassurance that the economy and employment remain robust even as inflation is slowing.
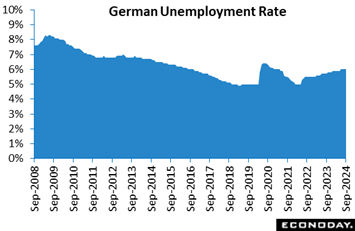 In September, Germany's labour market showed clear signs of continued strain as unemployment rose for the 21st consecutive month, keeping the unemployment rate steady at 6.0 percent. This sustained increase in unemployment, coupled with a decrease in job vacancies, down by 1,000 in September after a 10,000 drop in August, highlights a concerning trend of weakening demand for new hires. In September, Germany's labour market showed clear signs of continued strain as unemployment rose for the 21st consecutive month, keeping the unemployment rate steady at 6.0 percent. This sustained increase in unemployment, coupled with a decrease in job vacancies, down by 1,000 in September after a 10,000 drop in August, highlights a concerning trend of weakening demand for new hires.
These figures suggest that the German economy is facing significant challenges. The persistent rise in unemployment may point to broader economic issues such as slowing growth. The decline in job vacancies indicates that companies are cautious about expanding their workforce, potentially due to declining business confidence.
For the German economy, these developments could imply slower consumer spending, as higher unemployment often leads to reduced household income and spending power. Additionally, a less dynamic labour market might affect overall economic productivity and growth, creating a challenging environment for policymakers. Addressing these labour market issues will be crucial to bolstering economic resilience and ensuring sustainable recovery in the months ahead.
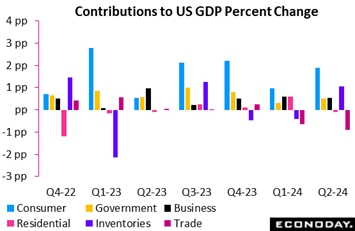 The third estimate of second quarter 2024 GDP is up 3.0 percent, unrevised from the second estimate. The increase matches the consensus of up 2.8 percent in the Econoday survey of forecasters. Overall, the revisions to the underlying data are small and offsetting. The third estimate of second quarter 2024 GDP is up 3.0 percent, unrevised from the second estimate. The increase matches the consensus of up 2.8 percent in the Econoday survey of forecasters. Overall, the revisions to the underlying data are small and offsetting.
Second quarter growth continues to be powered by personal consumption expenditures which are up 2.8 percent for the quarter. This is a negligible downward revision from up 2.9 percent in the second estimate and a 1.90 contribution to growth. In the second quarter, personal consumption is up 5.5 percent for durables, 1.7 percent for nondurables, and 2.7 percent for services. Government consumption expenditures are up 3.1 percent in the second quarter and make a 0.52 contribution to GDP.
Also strong in the second quarter is gross investment at up 8.3 percent in the third estimate, up from 7.5 percent in the second estimate and a 1.47 contribution to GDP. Fixed investment is up 2.3 percent in the second quarter with nonresidential investment up 3.9 percent and residential investment down 2.8 percent.
The change in private inventories is another source of growth in the second quarter and up to $96.8 billion after $21.4 billion in the first quarter. This makes a positive contribution of 1.05 in the second quarter. Net exports made a negative contribution of 0.90 in the second quarter, widening to a deficit of $906.9 billion after a deficit of $841.6 billion in the first quarter.
Gross domestic income (GDI) – another measure of the underlying health of the economy – rises 3.4 percent in the second quarter after up 3.0 percent in the first quarter. It suggests that consumers broadly continue to see increases in income.
The price index for personal consumption is up 2.5 percent in the second quarter, a sharp reduction from up 3.4 percent in the first quarter. The core price index for personal consumption is up 2.8 percent in the second quarter after rising 3.7 percent in the first quarter. Underlying inflation pressures have moderated in recent months.
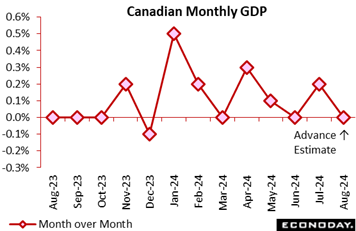 The Canadian economy was up 0.2 percent in July after no change in June, just above the modest 0.1 percent rise expected in the Econoday survey. Year over year, the economy expanded by 1.5 percent in July. The Canadian economy was up 0.2 percent in July after no change in June, just above the modest 0.1 percent rise expected in the Econoday survey. Year over year, the economy expanded by 1.5 percent in July.
The advance estimate for August points to another flat showing, underscoring sluggishness in the third quarter, and growth below the Bank of Canada's 2.8 percent forecast, with declining per capita GDP to boot.
For July, services and goods-producing sectors both showed growth with goods up 0.1 percent and services up 0.2 percent on the month. Overall, 13 of 20 sectors expanded in July.
Services did well despite the ill effect of wildfires on transportation, warehousing and accommodation. Gains largely reflected a strong showing in retail trade, the public sector and finance and insurance.
Goods-producing industries got their biggest lift from the utilities and manufacturing sectors.
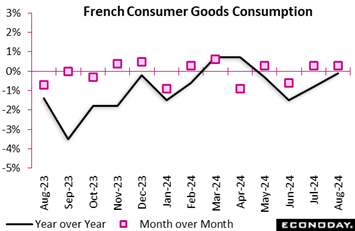 In August, household consumption of goods rose by a modest 0.3 percent, consistent with the previous month's growth. The primary factor contributing to this increase was a 0.8 percent increase in food consumption, driven by strong demand for essential commodities, thereby increasing the purchases of a diverse selection of agri-food products. In August, household consumption of goods rose by a modest 0.3 percent, consistent with the previous month's growth. The primary factor contributing to this increase was a 0.8 percent increase in food consumption, driven by strong demand for essential commodities, thereby increasing the purchases of a diverse selection of agri-food products.
Conversely, energy consumption experienced a minor decrease, with expenditures on fuel, electricity, and petrol increasing by only 0.2 percent in comparison to the previous month. The complex dynamics of household spending are reflected in the ongoing decline in engineered goods consumption, which fell by minus 0.4 percent, with durable goods such as electronics and appliances experiencing a significant decline by minus 1.5 percent. On the other hand, textile and garment purchases experienced a 1.4 percent rise, indicating a renewed interest in non-durable products.
The overall decline in durable products, particularly capital items such as electronics and furniture which declined by minus 4.2 percent suggests a cautious approach to significant expenditures. However, other engineered goods demonstrated sustained growth, albeit at a modest rate of 0.4 percent. These consumption trends underscore conflicting economic behavior, as households prioritize food and essentials while reducing their expenditures on larger, long-term purchases.
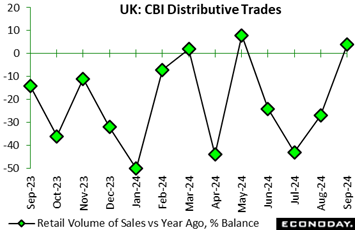
The September findings were a good deal stronger than expected. Having undershot forecasts in August, this month's sales balance climbed fully 31 percentage points to 4 percent, some 23 percentage points above the market consensus and its first positive print since May. In addition, at 5 percent, the CBI's forecast for October is the highest since April 2023.
Even so, it was not all goods news as retailers reported sales below normal for the time of year and consumers remain cautious ahead of what is expected to be a tight budget next month.
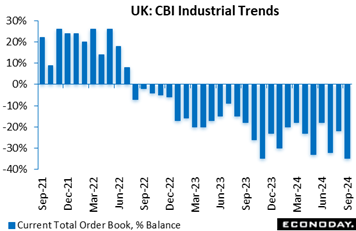 The CBI's September trends survey found orders still weak and falling by more than expected. At minus 35 percent, the headline balance was down 13 percentage points versus August and almost as far short of the market consensus. The latest print matched the lowest since January 2021 and, accordingly, moved further below its long-run average of minus 13 percent. The CBI's September trends survey found orders still weak and falling by more than expected. At minus 35 percent, the headline balance was down 13 percentage points versus August and almost as far short of the market consensus. The latest print matched the lowest since January 2021 and, accordingly, moved further below its long-run average of minus 13 percent.
Today's poor results contrast with the flash sector PMI findings released earlier. In practice, something between the two probably gives the best idea of actual developments.
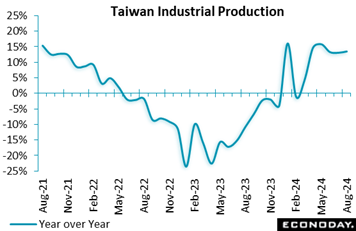 Taiwan's industrial production index rose 13.42 percent on the year in August, picking from an increase of 12.30 percent in July. Output in the manufacturing sector rose 14.07 percent on the year after a previous increase of 12.97 percent, with today's data also showing a year-over-year increase in output in the electricity and gas sector and in the mining sector. PMI survey data showed that the manufacturing sector expanded for the fourth consecutive month in August but at a slower pace. Taiwan's industrial production index rose 13.42 percent on the year in August, picking from an increase of 12.30 percent in July. Output in the manufacturing sector rose 14.07 percent on the year after a previous increase of 12.97 percent, with today's data also showing a year-over-year increase in output in the electricity and gas sector and in the mining sector. PMI survey data showed that the manufacturing sector expanded for the fourth consecutive month in August but at a slower pace.
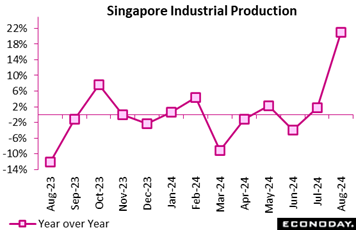 Singapore industrial production recorded further strong growth in August, with output increasing 6.7 percent on the month after increasing 10.1 percent in July. Previously published trade data, in contrast, showed a fall in exports in August while PMI survey data showed stronger conditions in the aggregate economy. Singapore industrial production recorded further strong growth in August, with output increasing 6.7 percent on the month after increasing 10.1 percent in July. Previously published trade data, in contrast, showed a fall in exports in August while PMI survey data showed stronger conditions in the aggregate economy.
In year-over-year terms, industrial production rose 21.0 percent in August after increasing 1.8 percent in July. This increase in year-over-year growth was largely driven by the electronics industry, which accounts for nearly half of the sector, with output there increasing 49.1 percent on the year after increasing 2.9 percent previously. This large increase partly reflects base effects from weakness in semiconductor production twelve months earlier. In the biomedical industry, where conditions are often volatile, output fell 16.1 percent after a previous decline of 17.4 percent. Output growth was mixed in other parts of the sector. Excluding the biomedical industry, output advanced 27.5 percent on the year in August after increasing 3.6 percent in July.
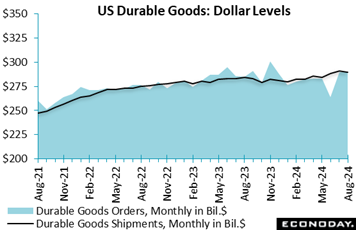 Durable goods orders showed no change in August from July after an enormous jolt higher in July on a surge in aircraft orders. That compared with the consensus forecast for a decline of 2.7 percent for August, and followed an unrevised 9.9 percent rise in July from June. Durable goods orders showed no change in August from July after an enormous jolt higher in July on a surge in aircraft orders. That compared with the consensus forecast for a decline of 2.7 percent for August, and followed an unrevised 9.9 percent rise in July from June.
Ex-transportation, orders rose by 0.5 percent in August, better than the unchanged figure expected. Electrical equipment, appliances, and components, up two of the last three months, was the big mover in this category, up 1.9 percent. Transportation orders fell 0.8 percent in August after rising a giant 34.6 percent in July.
Core capital goods rose 0.2 percent versus the no change expected, and that followed a revised 0.2 percent decline in July. That suggests manufacturing remains sluggish but not so bad as the ISM manufacturing data would suggest.
Shipments of manufactured durable goods declined 0.5 percent in August after a 1.1 percent rise in July. Transportation equipment was the big mover in shipments, down 1.9 percent on the month.
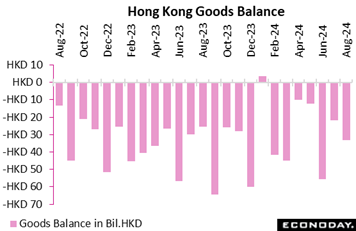 Hong Kong's merchandise trade deficit widened from HK$21.8 billion in July to HK$33.1 billion in August. Exports rose 6.4 percent on the year in August after advancing 13.1 percent in July, while imports rose 7.9 percent after a previous increase of 9.9 percent. Officials noted further mixed growth in exports to major trading partners in August and again cautioned that "geopolitical and trade tensions will present risks". Hong Kong's merchandise trade deficit widened from HK$21.8 billion in July to HK$33.1 billion in August. Exports rose 6.4 percent on the year in August after advancing 13.1 percent in July, while imports rose 7.9 percent after a previous increase of 9.9 percent. Officials noted further mixed growth in exports to major trading partners in August and again cautioned that "geopolitical and trade tensions will present risks".
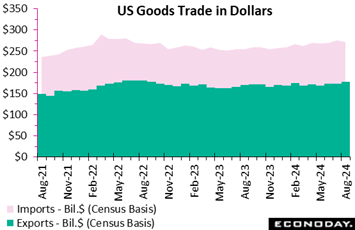 August was a surprisingly strong month for US goods exports and a a surprisingly weak month for US goods imports, making for a big 8.3 percent fall in the nation's goods deficit to $94.3 billion, down from $102.8 billion in July. August was a surprisingly strong month for US goods exports and a a surprisingly weak month for US goods imports, making for a big 8.3 percent fall in the nation's goods deficit to $94.3 billion, down from $102.8 billion in July.
The Econoday consensus called for a $100.0 billion deficit for August. The much narrower deficit suggests a bigger boost for growth from the trade sector in the quarter. Note that the Atlanta Fed's GDPNow model now sees GDP growth at 3.1 percent, up from 2.9 percent previously, factoring in better net exports and better growth in domestic investment.
Goods exports surged by 2.4 percent in August from July and were up 4.1 percent compared to August last year. Imports dropped by 1.6 percent on the month and were up 6.9 percent from a year ago. On the export side, autos, consumer goods and other goods showed good gains. On the import side, autos and industrial goods were the bigger movers to the downside.
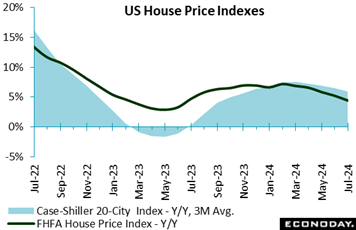 Case-Shiller's latest report shows house price inflation slowed further in July on an annual basis. The 20-city adjusted index rose 0.3 percent on the month in July, seasonally adjusted, and the unadjusted annual rate of increase eased again to 5.9 percent from June's 6.5 percent and from 6.9 percent in May. The consensus was 5.9 percent for the year-on-year figure in July. Case-Shiller's latest report shows house price inflation slowed further in July on an annual basis. The 20-city adjusted index rose 0.3 percent on the month in July, seasonally adjusted, and the unadjusted annual rate of increase eased again to 5.9 percent from June's 6.5 percent and from 6.9 percent in May. The consensus was 5.9 percent for the year-on-year figure in July.
The unadjusted month on month figure showed no change in July from June.
In a separate report, the FHFA house price index for July is up 0.1 percent on a seasonally adjusted basis after a small upward revision to unchanged in June. The July reading is above the consensus of down 0.1 percent in the Econoday survey of forecasters. The data on home prices for sales of existing units and refinancings have been little changed month-over-month since March. The index for July is up 4.5 percent compared to a year earlier, a sharp deceleration from up 5.3 percent in June and the lowest year-over-year increase since 3.2 percent in June 2023.
On an unadjusted basis, the price index is down 0.3 percent in July after rising 0.1 percent in June. Year-over-year the index is up 4.6 percent, its lowest increase since up 3.4 percent in June 2023.
In July, rising mortgage rates and hopes for lower rates in the near future kept homebuyers out of the market. With a larger supply of homes available for sale, price increases were kept in check in a buyers' market.
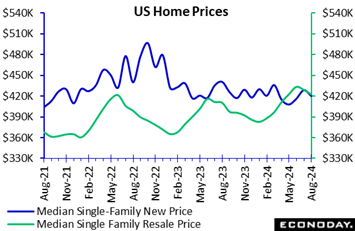 Sales of new single-family homes are down 4.7 percent to 716,000 in August after an upward revision to 751,000 in July. Sales are up 9.8 percent compared to a year ago. The August level is above the consensus of 700,000 in the Econoday survey of forecasters. The decrease in sales likely reflects constraint on the part of potential homebuyers as they anticipate lower mortgage rates and more inventory in the existing home market. The Freddie Mac rate for a 30-year fixed rate mortgage was at 6.73 percent in the week ending August 1 and had fallen to 6.35 percent by the week ending August 29 with every sign that the FOMC would lower the fed funds target rate at the September 17-18 meeting and which would mean further declines in mortgage rates. Sales of new single-family homes are down 4.7 percent to 716,000 in August after an upward revision to 751,000 in July. Sales are up 9.8 percent compared to a year ago. The August level is above the consensus of 700,000 in the Econoday survey of forecasters. The decrease in sales likely reflects constraint on the part of potential homebuyers as they anticipate lower mortgage rates and more inventory in the existing home market. The Freddie Mac rate for a 30-year fixed rate mortgage was at 6.73 percent in the week ending August 1 and had fallen to 6.35 percent by the week ending August 29 with every sign that the FOMC would lower the fed funds target rate at the September 17-18 meeting and which would mean further declines in mortgage rates.
The median price of a single-family home is down 2.0 percent to $420,600 in August from $429,000 in July, and down 4.6 percent from August 2023. Some of the decline is a shift to building small units to meet demand, but homebuilders are offering discounts and incentives to keep sales going. The supply of homes available for sale is up to 7.8 months' worth in August after 7.3 months in July, but similar to the 7.9 months in August 2023.
Sales of homes not yet started decline to a 13 percent share of all sales, another indication that homebuyers are finding more supply and taking more time before committing to a purchase in a cooler housing market. Sales of homes under construction is 35 percent of the total, while homes completed account for 52 percent of all sales in August.
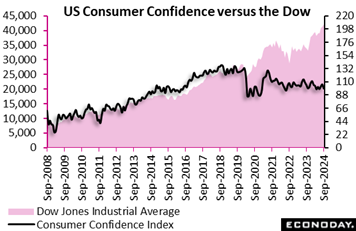 The Conference Board's consumer confidence index for September is down 6.9 points to 98.7 after a substantial upward revision to 105.6 in August. The September index is well below the consensus of 103.0 in the Econoday survey of forecasters. The September drop nearly erases the gains in confidence in July and August after 97.8 in June. The decline reflects recent softening in labor market conditions and less optimism about the job market in the near future as well as less hope for higher household incomes. Consumer confidence can be affected in the months ahead of a presidential election as conditions are viewed with greater uncertainty. This may be especially true in 2024 against a backdrop of highly contentious political rhetoric. The Conference Board's consumer confidence index for September is down 6.9 points to 98.7 after a substantial upward revision to 105.6 in August. The September index is well below the consensus of 103.0 in the Econoday survey of forecasters. The September drop nearly erases the gains in confidence in July and August after 97.8 in June. The decline reflects recent softening in labor market conditions and less optimism about the job market in the near future as well as less hope for higher household incomes. Consumer confidence can be affected in the months ahead of a presidential election as conditions are viewed with greater uncertainty. This may be especially true in 2024 against a backdrop of highly contentious political rhetoric.
The present situation index is down to 124.3 in September after 134.6 in August. It shows consumers slightly less confidence about present business conditions compared to the prior month, and with an essentially unchanged perception of job market conditions where jobs are seen as both less plentiful and harder to get.
The expectations index is down to 81.7 in September after 86.3 in August. Consumers see business conditions as weaker about six months from now and that the job market will be weaker as well along with prospects for higher income.
The Conference Board's measure of one-year inflation expectations is up to 5.2 percent in September, retracing some of the decrease to 4.9 percent in August after 5.4 percent in July. Inflation expectations can be somewhat volatile based on items closely related to day-to-day household items like food and energy. However, the backtracking in September is likely more related to an overstated decline in August as consumers anticipated a rate cut but are now more worried about their spending power in light of slowing wage growth.
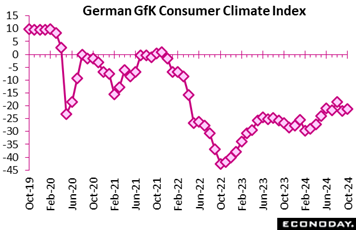 The September consumer climate report indicates that consumer sentiment has experienced a modest recovery after experiencing a significant decline in the previous month. A modest increase of 0.7 points to -21.2 in the consumer climate forecast for October was attributed to improved income expectations and purchasing willingness. Nevertheless, the recovery is impeded by a growing inclination to save, which is indicative of the persistent apprehensions regarding economic stability. The September consumer climate report indicates that consumer sentiment has experienced a modest recovery after experiencing a significant decline in the previous month. A modest increase of 0.7 points to -21.2 in the consumer climate forecast for October was attributed to improved income expectations and purchasing willingness. Nevertheless, the recovery is impeded by a growing inclination to save, which is indicative of the persistent apprehensions regarding economic stability.
Although consumers are slightly more optimistic about their incomes, the economy's outlook over the next 12 months is more circumspect due to rising unemployment, company insolvencies, and job insecurity. The economic forecast decreased by 1.3 points to 0.7, suggesting that expectations regarding Germany's economic performance are stagnant. Even though income expectations have rebounded by 6.6 points, reflecting the recovery from the decline in August, lingering concerns regarding employment security have dampened enthusiasm for expenditure.
In general, consumer sentiment remains fragile due to the persistence of broader economic uncertainties, although income and propensity to spend have improved. The September report takes the RPI to minus 16 and the RPI-P to minus 31. This means that the German economy is underperforming compared to market expectations.
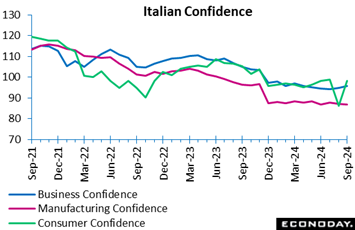 The September consumer and business confidence report provided an overall optimistic outlook, with only manufacturing and construction confidence dropping. Consumer confidence experienced a substantial increase, rising from 96.1 to 98.3, with enhancements in all critical domains, including economic, personal, future, and current expectations. This implies that consumers are generally optimistic, which suggests that both their immediate and long-term personal and economic outlooks are improving. The September consumer and business confidence report provided an overall optimistic outlook, with only manufacturing and construction confidence dropping. Consumer confidence experienced a substantial increase, rising from 96.1 to 98.3, with enhancements in all critical domains, including economic, personal, future, and current expectations. This implies that consumers are generally optimistic, which suggests that both their immediate and long-term personal and economic outlooks are improving.
Overall confidence in the business sector also increased, as evidenced by the rise from 94.7 in August to 95.7 in September. Nevertheless, certain sectoral issues were encountered. Manufacturing confidence experienced a minor decrease from 87.0 to 86.7, which was indicative of a decrease in opinions regarding order books. However, production expectations remained consistent. Confidence in the construction sector decreased from 103.3 to 101.9, primarily due to more pessimistic expectations regarding employment and orders.
In contrast, market services experienced an increase in confidence from 98.0 to 100.6, which was primarily due to enhanced contentment with business activity and order books. In addition, retail trade confidence increased from 101.5 to 102.3, which is indicative of improved present business conditions. However, future sales expectations declined marginally.
In general, the report indicates that consumer optimism is increasing, but it also emphasizes some persistent obstacles in particular business sectors such as manufacturing and construction.
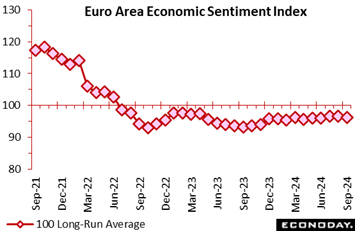
Economic sentiment deteriorated slightly at quarter-end. The headline gauge dipped 0.3 points from a marginally weaker revised August print to 96.2, only a 2-month low and just a tick below the market consensus but still well short of its 100 long-run average.
At a sector level, confidence worsened in industry (minus 10.9 after minus 9.9) and retail (minus 8.5 after minus 7.9) but improved in services (6.7 after 6.4), construction (minus 5.8 after minus 6.3) and in the household sector (minus 12.9 after minus 13.5).
Regionally, national sentiment weakened in France (97.2 after 98.6) and Germany (89.3 after 90.5), the latter hitting a 7-month low, but was more optimistic in both Italy (100.2 after 99.0) and, in particular, Spain (107.3 after 105.4). Accordingly, among the four larger economies, only Spain and Italy are now on the right side of the common 100 historic mean.
Inflation expectations were moderately favourable. Hence, while expected selling prices were unchanged (6.2) in manufacturing, they eased marginally in services (12.2 after 12.4) and inflation expectations in the consumer sector (10.9 after 11.3) saw their lowest level since last December. Planned major purchases (minus 16.0 after minus 15.8) also hit a 3-month low.
The September update leaves overall economic sentiment on a flat and soft trend that warns of continued sluggish household spending over at least the near-term. Consequently, with inflation expectations behaving themselves, speculation about another ECB cut as soon as next month is likely to grow. Indeed, today's report reduces the Eurozone RPI to minus 25 and the RPI-P to minus 29, both measures showing recent economic activity in general falling quite well short of market expectations.
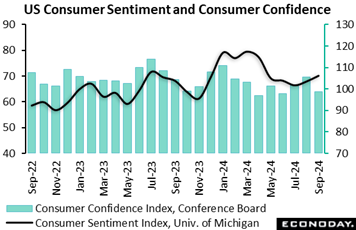
The University of Michigan consumer sentiment index is revised higher to 70.1 in the final report for September, up from 69.0 in the preliminary estimate and 67.9 in the final August report. The index was 67.9 a year ago. The final September reading is above the consensus of 69.0 in the Econoday survey of forecasters. The indexes for current and future conditions are both revised up. Consumers likely responded to signs that borrowing costs are coming down and that although hiring is slowing, layoff activity isn't increasing.
The index for current conditions is 63.3 in September, up from 61.3 in August, but below 71.1 a year ago. The hot job market with its solid wage increases has now cooled to something near normal for an economy in modest expansion. The expectations index is up to 74.4 in September after 72.1 in August and above 65.8 in September 2023. Concerns about a recession are lower and optimism that inflation is gradually improving is higher.
The one-year inflation expectations measure is at 2.7 percent in September, its lowest since 2.5 percent in December 2020. Consumers are seeing less upward price pressure on household commodities, especially energy costs. The five-year inflation expectations measure is 3.1 percent in September, the highest since 3.1 percent in May 2023. Consumers continue to project that over the medium term, prices will continue to rise a bit above the Fed's 2 percent inflation objective, although the underlying trend is stable in a narrow range right around the 3-percent mark.
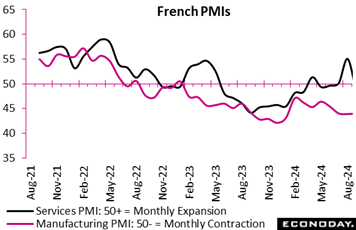 Following a fleeting surge during the Paris Olympics, the French economy experienced a substantial decline in September. The composite PMI output index experienced a significant decline to 47.4, its lowest level in eight months, indicating a significant decline in private sector activity. The manufacturing PMI edged up only marginally to 44.0 and the services PMI dropped to 48.3, a 6-month low. Following a fleeting surge during the Paris Olympics, the French economy experienced a substantial decline in September. The composite PMI output index experienced a significant decline to 47.4, its lowest level in eight months, indicating a significant decline in private sector activity. The manufacturing PMI edged up only marginally to 44.0 and the services PMI dropped to 48.3, a 6-month low.
The demand surge that was induced by the Olympics dissipated rapidly, as new orders contracted at the quickest rate since June. This decline had a particularly significant impact on the manufacturing sector. The number of customers decreased, and there was a decrease in interest from the North American and European markets. Additionally, the rate of decrease in backlogs of work was the fastest since November 2022, which serves as an additional illustration of the decrease in demand.
Nevertheless, there was a degree of optimism in the services sector, as firms were more optimistic about a recovery in the latter half of 2024. The country is currently dealing with post-Olympics market readjustments, and even though cost pressures have eased and input prices have declined, the overall economic outlook remains fragile.
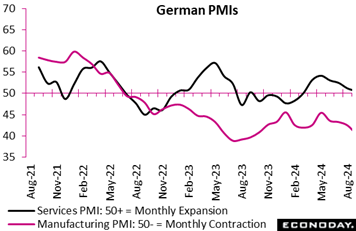 The composite PMI output index, which decreased to 47.2, demonstrated that Germany's economy experienced a more severe contraction in September, primarily due to a significant decline in the manufacturing sector. This represents the biggest decline in business activity since February. With a substantial decrease in new orders and export business, manufacturing output plummeted to a 12-month low of 40.5. The composite PMI output index, which decreased to 47.2, demonstrated that Germany's economy experienced a more severe contraction in September, primarily due to a significant decline in the manufacturing sector. This represents the biggest decline in business activity since February. With a substantial decrease in new orders and export business, manufacturing output plummeted to a 12-month low of 40.5.
At a modest 50.6, the services sector PMI signalled little more than stagnation in overall business activity. Employment decreased for the fourth consecutive month, and the rate of job cuts reached its highest level in 15 years, excluding the pandemic. Businesses became increasingly pessimistic, with more firms anticipating a decrease in output than a rise for the first time in a year, particularly in the automotive and construction sectors.
On the inflation front, cost pressures decreased in both sectors, with input prices in manufacturing decreasing and service sector costs increasing at their weakest rate in over three years. Despite a minor reduction in inflationary pressures, Germany's economic prognosis remains dismal, as recession concerns continue to escalate.
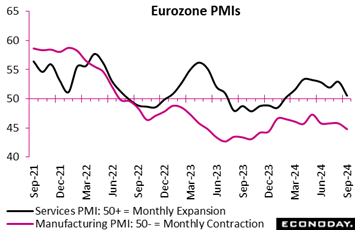 Private sector business activity unexpectedly contracted in September. The flash composite output index dropped from August's final 51.0 to 48.9, some 0.7 points short of the market consensus and below the 50-expansion threshold for the first time in seven months. Today's reading supports the view that the August data benefited from the Paris Olympics. Private sector business activity unexpectedly contracted in September. The flash composite output index dropped from August's final 51.0 to 48.9, some 0.7 points short of the market consensus and below the 50-expansion threshold for the first time in seven months. Today's reading supports the view that the August data benefited from the Paris Olympics.
The headline deterioration in part reflected the ongoing weakness of manufacturing where the flash sector PMI dropped from August's already soft final 45.8 to just 44.8, a 9-month low. Its services also lost ground and, at 50.5 after 52.9, signalled little more than stagnation and a 7-month trough.
Aggregate new orders and backlogs declined again, the former sliding by the most since January. Manufacturing output (44.5) also declined at the steepest pace in 9-months. Consequently, total headcount was trimmed for a second straight month as business confidence in the year ahead continued to worsen and hit its weakest point in 10 months.
Inflation pressures eased. Input cost inflation slowed to its lowest mark since November 2020, paving the way for output prices to increase by the least since February last year.
The disappointingly poor September results will boost speculation about another cut in ECB interest rates before year-end. An apparent preference for easing when the quarterly economic forecasts are updated probably leaves December as the most likely month but the odds on an October move have now shortened.
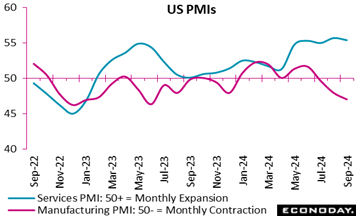 The manufacturing PMI, falling further into contraction territory by another 0.9 points after a two-point drop previously and at 47.0 coming in well below the consensus calling for a rebound to 48.5, is signaling deterioration in the goods producing sector for the third month in a row. The manufacturing PMI, falling further into contraction territory by another 0.9 points after a two-point drop previously and at 47.0 coming in well below the consensus calling for a rebound to 48.5, is signaling deterioration in the goods producing sector for the third month in a row.
The services PMI edged down 3 tenths to a still favorable 55.4, extending to 17 months its run of plus-50 scores and three straight months in the mid-50s. The expansion in services remains strong with new orders coming in at a level just shy of August's 27-month high while backlog rose slightly, suggesting lack of spare capacity. Future sentiment nevertheless sharply deteriorated, amid concerns about the outlook for the economy and about demand, which may be linked to the Presidential election.
Details for manufacturing include a 0.7-point rise for output to 48.9 but new orders dropping at the sharpest rate since December 2022 and employment declining at the fastest pace since June 2020. And excluding the pandemic, the decline was the most pronounced since January 2010 as a growing number of firms said they need to reduce capacity due to weak sales. Supplier performance was also a drag, with delivery times shortening to a degree not seen since February.
Price readings for September will not allay inflationary fears, as prices charged in both sectors rose at the fastest pace in six months while input growth accelerated to a one-year high in services even as input prices for manufacturing declined to a six-month low. S&P Global commented that these inflation readings suggest the FOMC may need to move more cautiously in implementing further rate cuts despite the deterioration in manufacturing sector jobs.
The PMI composite, weighted overwhelmingly towards services, fell to 54.4, only a small loss of momentum from August that still signals a sustained economic expansion consistent with annualized GDP growth of 2.2 percent in the third quarter. But strong disparities between the strength of services and the contraction in manufacturing persist, and are worrisome given manufacturing's role as a leading indicator.
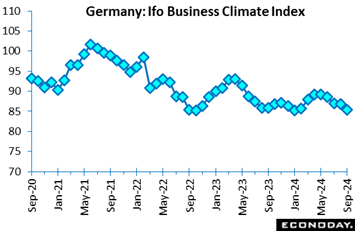 Germany's Ifo business climate index fell slightly from 86.6 in August to 85.4 in September, leaving it below the prior six months' figures, indicating continued cautiousness among German businesses. The current conditions index slipped to 84.4 from 86.4, well below expectations. This suggests that German businesses are still grappling with a challenging economic environment as companies were pessimistic about the business environment. Germany's Ifo business climate index fell slightly from 86.6 in August to 85.4 in September, leaving it below the prior six months' figures, indicating continued cautiousness among German businesses. The current conditions index slipped to 84.4 from 86.4, well below expectations. This suggests that German businesses are still grappling with a challenging economic environment as companies were pessimistic about the business environment.
Furthermore, there was a slight downtick in business expectations, which reached 86.3 from August's 86.8, slightly below the forecast. This could signal a slightly negative outlook among firms regarding future economic conditions. The downward results indicate that the overall economic mood remains wary.
Despite these slight changes, the indices reflect ongoing uncertainty in the market. Overall, the levels still point to a fragile economic climate that requires careful monitoring by policymakers and business leaders to foster a more robust recovery.
Global economic data continue to underperform relative to forecasts. Econoday’s Relative Performance Index (RPI) fell 11 points in the week to minus 24 and edged a further 9 points lower to minus 26 less prices (RPI-P), the latter indicating that real economic activity has been, as it has for the last six weeks, subpar relative to expectations.
By contrast, US data continue to come in above Econoday’s consensus estimates, at plus 13 overall and plus 18 excluding prices.
The Canadian RPI ended the week at minus 10 and the RPI-P at plus 3.
In the Eurozone, the RPI and RPI-P continue to undershoot market forecasts and to a greater extent than in the previous week, with the former falling 20 points to minus 25 and the latter dropping 12 points to minus 29. Recent data were soft enough to justify speculation about further easing by the ECB before the end of the year.
UK economic data have generally continued to perform in line with expectations, with the RPI moving down 5 points from the previous week to 1 while the RPI-P fell 6 points to minus 4.
In Japan, the RPI has moved up 8 points to minus 1 while the RPI-P rose 14 points from last week to 16, indicating that data has outperformed expectations.
The China RPI, at minus 64, and RPI-P, at minus 70, remain in deep negative territory where they have spent much of the year, indicating that Chinese data in sum continues to come in well below consensus forecasts.
**Contributing to this article were Jeremy Hawkins, Brian Jackson, Mace News, Max Sato, Olajide Oyadeyi, Theresa Sheehan, and Simisola Fagbola
The week begins early, on Monday Korean and Japanese time with both countries’ releases of monthly industrial production and retail sales data. Wrapping up the week on Friday will be the US Employment Situation report for September, one of the two or three reports that will be key for determining the rate decision at the next FOMC meeting on November 7.
Japanese Industrial Production
Consensus Forecast, Month over Month: -0.5%
Consensus Range, Month over Month: -1.1% to 0.7%
Consensus Forecast, Year over Year: -2.1%
Consensus Range, Year over Year: -2.7% to 0.1%
Japan's industrial production is forecast to slip 0.5 percent on the month in August after an upwardly revised 3.1 percent in July and slumping 4.2 percent in June. Forecasters are split, with a few projecting a modest gain. The dampening effects of an earthquake in southwestern Japan and a powerful typhoon are believed to be partially offset by solid demand for semiconductors. METI's survey of producers indicated that output is expected to dip 0.9% in August before falling a further 3.3 percent in September.
From a year earlier, factory output is expected to drop 2.1 percent, following an upwardly revised 2.9 percent gain.
Last month, the ministry upgraded its assessment, saying industrial output is "taking one step forward and one step back" Previously, it said, output "has weakened while taking one step forward and one step back."
Japanese Retail Sales for August (Mon 0850 JST; Sun 2350 GMT; Sun 1950 EDT)
Consensus Forecast, Month over Month: 0.7%
Consensus Range, Month over Month: -0.4% to 2.1%
Consensus Forecast, Year over Year: 1.9%
Consensus Range, Year over Year: 0.2% to 2.6%
Japanese retail sales are forecast to have lost further steam, slowing to a 1.9 percent rise on year in August from a 2.6 percent gain in July in light of a dip in new vehicle sales, solid but slower department store sales and lower gasoline prices. On the month, retail sales are expected to rise 0.7 percent for a fifth straight increase after edging up 0.2 percent.
Last month, the METI maintained its assessment after upgrading it for the second straight month for the June data, saying retail sales are "on an uptrend."
Chinese CFLP Manufacturing PMI for September (Mon 0930 CST; Mon 0130 GMT; Sun 2130 EDT)
Consensus Forecast: 49.5
Consensus Range: 49.2 to 49.5
Chinese CFLP Non-Manufacturing PMI for September
Consensus Forecast: 50.5
Consensus Range: 50.1 to 50.5
The CFLP manufacturing PMI is expected to rise in September to 49.5 after edging down to 49.1 in August. The non-manufacturing PMI, expected at 50.5 versus August's 50.3, has held above 50 for more than a year.
Chinese S&P Global PMI Manufacturing for September (Mon 0945 CST; Mon 0145 GMT; Sun 2145 EDT)
Consensus Forecast: 50.5
Consensus Range: 50.5 to 50.7
After rebounding from a 2-point plunge in July back to expansion at 50.4 in August, the manufacturing PMI for September is expected to tick up to 50.5.
Italian CPI for September (p) (Mon 1100 CEST; Mon 0900 GMT; Mon 0500 EDT)
Consensus Forecast, Month over Month: 0.4%
Consumer prices are forecast to rise 0.4 percent on the month after a 0.2 percent rise in August.
German CPI, Preliminary September (Mon 1400 CEST; Mon 1200 GMT; Mon 0800 EDT)
Consensus Forecast, Month over Month: 0.1%
Consensus Range, Month over Month: -0.1% to 0.2%
Consensus Forecast, Year over Year: 1.7%
Consensus Range, Year over Year: 1.5% to 2.0%
HICP, Preliminary September
Consensus Forecast, Year over Year: 1.9%
Consensus Range, Year over Year; 1.8% to 1.9%
September's consensus is a year-over-year rise of 1.7 percent versus 1.9 percent in August and 2.3 percent in July. The consensus for the HICP is 1.9 percent versus 2.0 percent in the prior month that followed 2.6 percent in July.
US Chicago PMI for September (Mon 0945 EDT; Mon 1345 GMT)
Consensus Forecast: 46.0
Consensus Range: 45.0 to 46.8
The Chicago PMI is expected to tick down in September to 46.0 versus August's 46.1. This index has been in long and deep contraction.
Dallas Fed Manufacturing Survey for September (Mon 1030 EDT; Mon 1430 GMT)
Consensus Forecast: -10.0
Consensus Range: -11.0 to -4
The Dallas Fed general activity index is expected to edge deeper into contraction to minus 10 after August’s minus 9.7.
Japanese Tankan for Third Quarter (Tue 0730 JST; Mon 2230 GMT; Mon 1830 EDT)
Consensus Forecast, Large Manufacturer Sentiment Index: 13
Consensus Forecast, Large Non-Manufacturer Sentiment Index: 32
Consensus Forecast, Large Firms Capital Expenditures Plans: 11.9%
The Bank of Japan's quarterly Tankan business survey is forecast to show confidence among major manufacturers stagnated in the September quarter, hit by limping exports, particularly to China still reeling from its property market woes, and despite solid global demand for semiconductors. Non-manufacturers including restaurants, hotels and retailers continued suffering from chronic labor shortages, which have mitigating the uplifting effects of strong inbound spending.
The Tankan diffusion index showing sentiment among major manufacturers is forecast at 13, unchanged from June. The index measuring sentiment among major non-manufacturers is seen at 32, down slightly from 33 the previous three months earlier.
Japanese Unemployment Rate for August (Tue 0830 JST; Mon 2330 GMT; Mon 1930 EDT)
Consensus Forecast: 2.7%
Consensus Range: 2.6% to 2.7%
Japanese payrolls are expected to post their 25th straight rise on year in August amid widespread labor shortages. The unemployment rate is forecast at 2.7 percent, unchanged from July, when it unexpectedly worsened to the level from 2.5 percent in June but that was because a lot more people quit to look for better openings. Some project a slight improvement to 2.6 percent. In July, sharp gains in medical/welfare and academic/tech services led the employment gain. Manufacturers and transporters continued trimming jobs from year-earlier levels.
In its monthly economic report for September, the government continued to describe employment conditions as "showing signs of improvement." It maintained its overall economic assessment, saying the economy is recovering "moderately."
Australian Retail Sales for August (Tue 1130 AEST; Tue 0130 GMT; Mon 2130 EDT)
Consensus Forecast, Month over Month: 0.2%
Consensus Range, Month over Month: 0.1% to 0.9%
Retail sales in August are expected to increase 0.2 percent on the month after July's disappointing flat reading.
French PMI Manufacturing Final for September (Tue 0950 CEST; Tue 0750 GMT; Tue 0350 EDT)
Consensus Forecast: 44.0
Consensus Range: 44.0 to 44.0
No revision is expected to the flash estimate.
German PMI Manufacturing Final for September (Tue 0955 CEST; Tue 0755 GMT; Tue 0355 EDT)
Consensus Forecast: 40.3
Consensus Range: 40.3 to 40.3
No revision is expected to the flash estimate.
Eurozone PMI Manufacturing Final for September (Tue 10000 CEST; Tue 0800 GMT; Tue 0400 EDT)
Consensus Forecast: 44.8
Consensus Range: 44.8 to 44.8
No revision is expected to the flash estimate.
UK PMI Manufacturing Final for September (Tue 0930 BST; Tue 0830 GMT; Tue 0430 EDT)
Consensus Forecast: 44.8
Consensus Range: 44.8 to 44.8
No revision is expected to the flash estimate.
Eurozone HICP Flash for September (Tue 1100 CEST; Tue 0900 GMT; Tue 0500 EDT)
Consensus Forecast, Year over Year: 2.0%
Consensus Range, Year over Year: 1.8% to 2.0%
Narrow Core
Consensus Forecast, Year over Year: 2.8%
Consensus Range, Year over Year: 2.7% to 3.0%
Consensus for September’s HICP flash is 2.0 percent and 2.8 percent for the narrow core. These would compare respectively with August’s 2.2 and 2.8 percent and July’s 2.6 and 2.9 percent.
US PMI Manufacturing Final for September (Tue 0945 EDT; Tue 1345 GMT)
Consensus Forecast: 47.0
Consensus Range: 47.0 to 47.5
No revision is expected to the flash estimate.
US ISM Manufacturing Index for September (Tue 1000 EDT; Tue 1400 GMT)
Consensus Forecast: xx
Consensus Range: to
After a small bounce back to 47.2 in August from July’s 1.7 point decline to the 46.8 yearly low, ISM manufacturing is expected to rise/fall xx points to xx in September.
US Construction Spending (Tue 1000 EDT; Tue 0600 GMT)
Consensus Forecast, Month over Month: -0.3%
Consensus Range, Month over Month: -0.1% to 0.3%
Construction spending is expected to decline 0.3 percent in August, the same as in July.
US JOLTS Job Openings (Tue 1000 EDT; Tue 1400 GMT)
Consensus Forecast, Job Openings: 7.7 M
Consensus Range, Job Openings: 7.5 M to 7.7 M
The US labor market has been cooling in recent months but job openings are expected to remain steady. August’s consensus is 7.7 million versus 7.7 million in July and 7.9 M in June.
Eurozone Unemployment Rate for August (Wed 1100 CEST; Wed 0900 GMT; Wed 0500 EDT)
Consensus Forecast: 6.4%
Consensus Range: 6.4% to 6.5%
Consensus for August’s unemployment rate is 6.4 percent, unchanged from July. Unemployment in the Eurozone has been running at record lows.
US ADP Employment Report for September (Wed 0815 EDT; Wed 1215 GMT)
Consensus Forecast: Change in Private Payrolls: 121,500
Consensus Range: Change in Private Payrolls: 80,000 to 140,000
Forecasters see ADP's September employment number at 121,500. ADP's number for August was 99,000.
Australian International Trade in Goods for August (Thu 1130 AEST; Thu 0130 GMT; Wed 2130 EDT)
Consensus Forecast, Balance: A$5.5 B
Consensus range, Balance: A$2.0 B to A$9.7 B
Consensus for international trade in goods in August is a surplus of A$5.5 billion versus July's A$6.009 billion surplus that compared with expectations for a surplus of A$5.0 billion.
Eurozone PPI for August (Thu 1100 CEST; Thu 0900 GMT; Thu 0500 EDT)
Consensus Forecast, Month over Month: 0.3%
Consensus Forecast, Year over Year: -2.4%
Consensus Range, Year over Year: -2.6% to -2.3%
Producer prices are expected to have fallen deeper into contraction to minus 2.4 percent on the year in August from minus 2.1 percent in July. The monthly showing, at a consensus of 0.3 in August, rose 0.8 percent in July.
US Jobless Claims for week of September 28 (Thu 0830 EDT; Thu 1230 GMT)
Consensus Forecast, Initial Claims: 225 K
Consensus Range, Initial Claims: 219 K to 232 K
The consensus for initial claims in the September 28 week is at 225,000.
US Factory Orders for August (Thu 1000 EDT; Thu 1400 GMT)
Consensus Forecast, Month over Month: 0.2%
Consensus Range, Month over Month: -3.2% to 0.6%
Factory orders are expected to rise 0.2 percent in August after July's 5.0 percent surge that was driven by a rebound for commercial aircraft.
US ISM Services Index for September (Thu 1000 EDT; Thu 14:00 GMT)
Consensus Forecast: 51.5
Consensus Range: 51.0 to 52.0
ISM services in August, at 51.5, added another tick to July’s strong rebound from June's dip to 48.8. September's consensus is unchanged at 51.5.
US Employment Situation for September (Fri 0830 EDT; Fri 1230 GMT)
Consensus Forecast: Change in Nonfarm Payrolls: 132,500
Consensus Range: Change in Nonfarm Payrolls: 70,000 to 180,000
Consensus Forecast: Unemployment Rate: 4.2%
Consensus Range: Unemployment Rate: 4.2% to 4.3%
Consensus Forecast: Private Payrolls: 125,000
Consensus Range: Private Payrolls: 77,000 to 150,000
Consensus Forecast: Average Hourly Earnings M/M: 0.3%
Consensus Range: Average Hourly Earnings M/M: 0.1% to 0.3%
Consensus Forecast: Average Hourly Earnings Y/Y: 3.7%
Consensus Range: Average Hourly Earnings Y/Y: 3.2% to 3.8%
Consensus Forecast: Average Workweek: 34.3
Consensus Forecast: Average Workweek: 34.3 to 34.5
A 132,500 rise is the call for nonfarm payroll growth in September versus August's lower-than-expected 142,000 rise. Average hourly earnings in September are expected to rise 0.3 percent on the month for a year-over-year rate of 3.7 percent; these would compare with August's rates of 0.4 percent on the month and 3.8 percent on the year. September's unemployment rate is expected to remain unchanged from August’s and July’s 4.2 percent.
|

