|
The week ended with a bang with the release of the monthly U.S. employment report for September. Nonfarm payrolls are up 254,000 in September along with a net upward revision of 72,000 in the prior two months. The September increase was an upside surprise compared to the consensus of up 132,500 in the Econoday survey of forecasters and surpassed the high end of the range of expectations of up 180,000. The unemployment rate was 4.1 percent for September and below the consensus of 4.2 percent in the Econoday survey. The report defies concerns sparked by the preliminary benchmark revision that indicated that payroll growth was going to be revised significantly for growth and which were compounded by the weakness in the August employment report.
Fed policymakers will not regret the 50-basis point rate cut announced on September 18 which was in part to preserve the labor market in its present state. Broadly, jobs data show that the labor market has rebalanced and normalized. As of the September data, the labor market looks able to absorb new workers, employ those who are in the market for a job after layoffs or a voluntary quit. Employers are able to find workers to fill empty slots although they have to offer higher compensation to do so. With the data on hand, the FOMC outlook will be comfortable further easing restrictive monetary policy at a tempered pace along the lines of its forecasts in the summary of economic projections.
 The consumer price index dropped by 0.2 percent on a monthly basis, but increased 0.7 percent annually, indicating a slowdown from the previous month's 1.1 percent rate. The primary factor behind the deceleration was the significant drop in energy prices, both regulated (falling from 14.3 percent to 10.0 percent) and non-regulated (from minus 8.6 percent to minus 11.0 percent). Additionally, reduced price growth in recreational, cultural, and personal care services contributed to the trend. The consumer price index dropped by 0.2 percent on a monthly basis, but increased 0.7 percent annually, indicating a slowdown from the previous month's 1.1 percent rate. The primary factor behind the deceleration was the significant drop in energy prices, both regulated (falling from 14.3 percent to 10.0 percent) and non-regulated (from minus 8.6 percent to minus 11.0 percent). Additionally, reduced price growth in recreational, cultural, and personal care services contributed to the trend.
However, this was partially offset by an uptick in food prices, both processed and unprocessed, alongside slight increases in durable goods. Core inflation, excluding volatile items like energy and fresh food, also dipped slightly to 1.8 percent. The inflationary gap between goods and services narrowed, highlighting a general deceleration in service prices.
The harmonized consumer price index, which accounts for seasonal factors like summer sales, rose 1.2 percent monthly but moderated to 0.8 percent annually, similarly reflecting a still subdued inflationary environment.
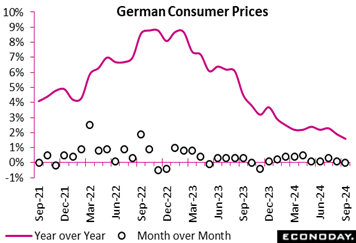 The provisional CPI data showed the yearly inflation rate falling from 1.9 percent to a lower than expected 1.6 percent in September. Prices were unchanged on the month. The provisional CPI data showed the yearly inflation rate falling from 1.9 percent to a lower than expected 1.6 percent in September. Prices were unchanged on the month.
The annual increase of the harmonised index of consumer prices was marginally higher at 1.8 percent but this too was well below the previous month's 2.0 percent post. Prices dipped 0.1 percent on the month.
Core inflation, which excludes volatile food and energy prices, remains higher at a 2.7 percent annual rate but this is also down from August's 2.8 percent.
Falls in both the overall and core German inflation rates bode well for a decline in the flash Eurozone data due tomorrow. This would help to underpin speculation about another ECB interest rate cut as soon as this month.
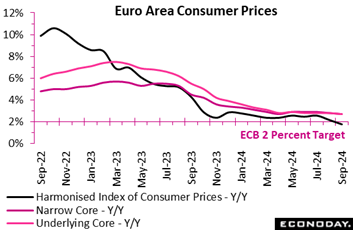
Inflation provisionally decelerated again in September and rather more quickly than expected. Prices dipped 0.1 percent on the month, reducing the yearly rate from August's final 2.2 percent to just 1.8 percent, a couple of ticks less than the market consensus and matching its lowest reading since April 2021. The rate now stands 0.2 percentage points below its medium-term target, the first negative gap in more than three years.
News on the core rates was also favourable, albeit less so. The narrowest measure dropped from a yearly 2.8 percent rate to 2.7 percent, a tick short of forecasts, and matching its weakest mark since January 2022. The wider measure that excludes just energy and unprocessed food followed suit, also shedding 0.1 percentage point at 2.7 percent. Inflation in the key services category similarly eased a tick but, at 4.0 percent, remains stubbornly firm with only a flat underlying trend. Lingering effects from the Paris Olympic Games might have been an issue. Elsewhere, the rate in non-energy industrial goods was steady at just 0.4 percent while energy (minus 6.0 percent after minus 3.0 percent) had a significant negative impact and food, alcohol and tobacco (2.4 percent after 2.3 percent) a minimal positive effect.
Regionally, headline inflation fell in France (1.5 percent after 2.2 percent), Germany (1.8 percent after 2.0 percent), Italy (0.8 percent after 1.2 percent) and Spain (1.7 percent after 2.4 percent). In other words, all the four larger member states now have national HICP inflation rates below the ECB's target.
Declining headline and core Eurozone inflation in September should be well received at the ECB and will boost speculation about another cut in policy rates as soon as this month. However, while an increasingly soft regional economy is certainly crying out for lower borrowing costs, the persistent stickiness of prices in the service sector will not sit well with the central bank's hawks. Another ease in October is now more probable, but is not yet a done deal. Today's update trims the Eurozone RPI to minus 23 and puts the RPI-P at minus 11, both gauges showing overall economic activity still lagging market expectations.
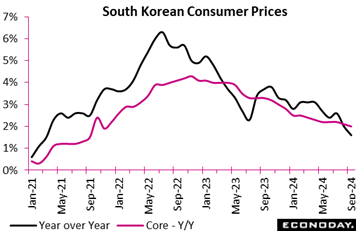
South Korea's headline consumer price index rose 1.6 percent on the year in September after an increase of 2.0 percent in August, in line with the Bank of Korea's 2.0 percent target. This is the first time headline inflation has been below the target level since March 2021. The index rose 0.1 percent on the month after advancing 0.4 percent previously. The fall in headline inflation was largely driven by transport prices. These fell 2.0 percent on the month after increasing 0.1 percent previously, with the year-over-year increase weakening from an increase of 1.8 percent to a fall of 1.2 percent. Food price inflation also moderated from 2.0 percent to 1.8 percent.
Underlying price pressures also eased in September. Core CPI, excluding food and energy, rose 2.0 percent on the year, down slightly from the 2.1 percent increase recorded in each of the previous three months, and fell 0.2 percent on the month after a previous increase of 0.1 percent. Core inflation has fallen only slightly from 2.5 percent at the start of the year to its current level. The year-over-year increase in prices was relatively steady for most major categories of spending.
At its most recent policy meeting, held August, the BoK left policy rates on hold. Officials advised then that they had retained their forecast for core inflation to average 2.2 percent this year. Although they noted uncertainties about the inflation, they advised that they now have "greater confidence that inflation will converge on the target level".
Although officials concluded that monetary policy should remain on hold for now, they also noted that they will "examine the proper timing of rate cuts while maintaining a restrictive monetary policy stance". Today's data showing a fall in both headline and core inflation could strengthen the case for a rate cut in upcoming meetings. The next BoK meeting is scheduled to be held next week.
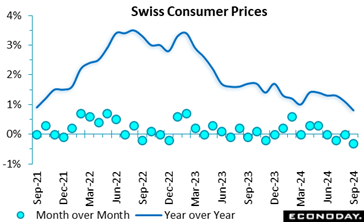 Consumer prices were again on the weak side of expectations in September. A 0.3 percent monthly fall was 0.2 percentage points steeper than the market consensus and sharp enough to reduce the annual inflation rate from 1.1 percent to just 0.8 percent, its lowest reading since July 2021. Consumer prices were again on the weak side of expectations in September. A 0.3 percent monthly fall was 0.2 percentage points steeper than the market consensus and sharp enough to reduce the annual inflation rate from 1.1 percent to just 0.8 percent, its lowest reading since July 2021.
The monthly drop in the headline rate in part reflected a 0.2 percent slide in domestic prices although this left their annual rate unchanged at 2.0 percent. Import prices were down 0.5 percent, cutting their yearly rate from minus 1.9 percent to minus 2.7 percent.
Within the CPI basket, monthly declines in petroleum (3.6 percent), recreation and culture (1.5 percent) and restaurants and hotels (0.7 percent) stood out. A partial offset came from a seasonal bounce in textiles and clothing (4.0 percent). As a result, core prices fell 0.2 percent versus August, trimming the annual underlying inflation rate by a tick to 1.0 percent.
Just yesterday, newly installed SNB Chairman Martin Schlegel warned that risks to inflation were on the downside. Today's update is consistent with that view and must increase the likelihood of another cut in the central bank's policy rate in December.
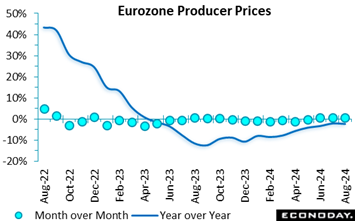 Producer prices continued to climb sharply in August. Following a slightly smaller revised 0.7 percent monthly increase in July, the headline index rose a further 0.6 percent, its third straight increase and double the market consensus. However, negative base effects still saw annual inflation ease from minus 2.2 percent to minus 2.3 percent. Producer prices continued to climb sharply in August. Following a slightly smaller revised 0.7 percent monthly increase in July, the headline index rose a further 0.6 percent, its third straight increase and double the market consensus. However, negative base effects still saw annual inflation ease from minus 2.2 percent to minus 2.3 percent.
As usual, the overall monthly change was dominated by energy where prices rose 1.9 percent after a 2.6 percent spike in July. Excluding this category, the PPI actually dipped 0.1 percent, its first decline in 2024 following a small positive revision to the previous month. The yearly core rate was unchanged at 0.3 percent, only its second positive print since October last year. Consumer goods were flat on the month, capital goods were up 0.1 percent and intermediates down 0.1 percent.
Accordingly, the headline data again paint a misleadingly firm picture of underlying pipeline pressures in Eurozone manufacturing. The sector remains mired in recession and looks likely to stay that way this quarter.
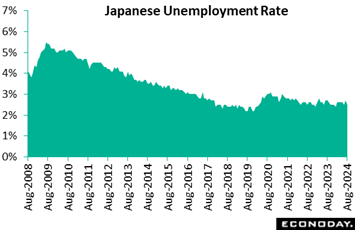 Japanese payrolls posted their 25th straight rise on year in August amid widespread labor shortages. The unemployment rate improved to 2.5 percent from 2.7 percent in July, matching the 2.5 percent rate in June and coming in lower than the consensus call of 2.7 percent. Job losses and retirements fell a seasonally adjusted 13.0 percent on the month while the number of people who quit for better positions also plunged 13.6 percent after rising 9.5 percent in July, which was the main factor for the higher jobless rate then. Japanese payrolls posted their 25th straight rise on year in August amid widespread labor shortages. The unemployment rate improved to 2.5 percent from 2.7 percent in July, matching the 2.5 percent rate in June and coming in lower than the consensus call of 2.7 percent. Job losses and retirements fell a seasonally adjusted 13.0 percent on the month while the number of people who quit for better positions also plunged 13.6 percent after rising 9.5 percent in July, which was the main factor for the higher jobless rate then.
Employment surged 420,000 on the year to 68.15 million in August after rising 230,000 in July. The number of unemployed fell a sharp 110,000 to 1.75 million, marking the first drop in five months after rising 50,000 in July. The high pace of job creation was led by a continued sharp rise in research/tech services and a renewed hiring spree by hotels/restaurants. Manufacturing jobs rebounded after recent drops while medical/welfare services trimmed some positions after a jump in July.
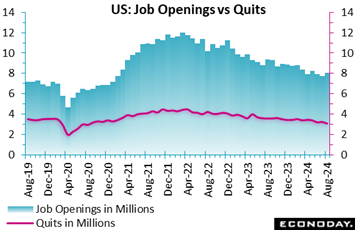 The data on job openings in August shows an increase of 329,000 to 8.040 million after an upward revision to 7.711 million in July. The August increase is above the consensus of 7.700 million in the Econoday survey of forecasters. Job openings in private industry are up 227,00 in August, led by an increase of 138,000 in construction. Government jobs openings are up 103,000, led by state and local government at up 106,000 in August. The job openings rate is up to 4.8 in August after 4.6 in July. While the number of jobs open has narrowed significantly since 9.358 million in August 2023, the current levels are consistent with a normal labor market in a period of modest expansion. The data on job openings in August shows an increase of 329,000 to 8.040 million after an upward revision to 7.711 million in July. The August increase is above the consensus of 7.700 million in the Econoday survey of forecasters. Job openings in private industry are up 227,00 in August, led by an increase of 138,000 in construction. Government jobs openings are up 103,000, led by state and local government at up 106,000 in August. The job openings rate is up to 4.8 in August after 4.6 in July. While the number of jobs open has narrowed significantly since 9.358 million in August 2023, the current levels are consistent with a normal labor market in a period of modest expansion.
There is some month-to-month fluctuation in the level of job openings, but the underlying trend appears to be similar to conditions prior to the pandemic in 2020. There are sufficient new jobs to absorb new entrants in the labor force and those already in the labor market seeking a job. Importantly, churn in the labor market from workers leaving one job for another is considerably less, but not absent. Overall layoff activity remains low. If businesses are not hiring, neither are they cutting payrolls aggressively.
The number of new hires is down 99,000 in August to 5.317 million after 5.416 million in the prior month. Hires were at 5.888 million in August 2023. New hires are down 98,000 in the private sector and unchanged among government hires. The hires rate in August is 3.3 after 3.4 in July, and 3.8 in August 2023.
Total separations are down 317,000 to 4.997 million in August after 5.314 million in July and 5.609 in August 2023. Private job separations are down 287,000 and government down 31,000 in August. The separations rate is down to 3.1 in August after 3.4 in July and 3.6 in August 2023.
Job quits – a subset of separations – are down 159,000 to 3.084 in August after 3.243 million in July and 3.595 million in the year-ago month. Job quits in the private sector are down 147,000 and government down 11,000 in August. The quits rate is down to 1.9 in August after 2.0 in July and 2.3 in August 2023.
Layoffs and discharges – another subset of separations – are down 105,000 to 1.608 million in August after 1.713 in July and 1.664 million in August 2023. The rate is 1.0 in August after 1.1 in July and in August 2023.
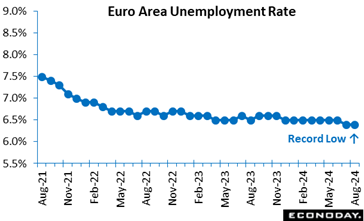 Joblessness continued to decline in August. A sizeable 94,000 drop to 10.925 million followed a steeper revised 89,000 decrease in July and means that the number of people out of work has fallen below 11 million for the first time on record. The jobless rate held steady at the previous period's 6.4 percent, matching both its all-time low and the market consensus. Joblessness continued to decline in August. A sizeable 94,000 drop to 10.925 million followed a steeper revised 89,000 decrease in July and means that the number of people out of work has fallen below 11 million for the first time on record. The jobless rate held steady at the previous period's 6.4 percent, matching both its all-time low and the market consensus.
Amongst the larger Eurozone countries, national unemployment rates eased in Italy (6.2 percent after 6.4 percent) and Spain (11.3 percent after 11.4 percent). However, they were unchanged in both France (7.5 percent) and Germany (3.5 percent) where growth has been particularly soft.
The ongoing tightness of the Eurozone labour market will be seen by the ECB's hawks as further justification for cutting interest rates only cautiously and reduces the likelihood of a unanimous decision to ease again this month. That said, today's update sees the Eurozone RPI at minus 22 and the RPI-P at minus 9, both gauges showing overall economic activity still struggling to keep up with market expectations.
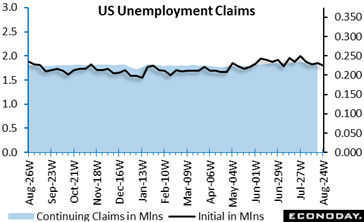 Initial jobless claims are up 6,000 in the week ending September 28 after a minor upward revision to 219,000 in the prior week. The September 28 level matches the consensus in the Econoday survey of forecasters. The four-week moving average is down 750 to 224,250 in the September 28 week after 225,000 in the prior week. The underlying trend for new filings for unemployment benefits as of the current data is still largely unaffected by recent developments. However, claims are likely to rise sharply, if temporarily, due to the wide area of destruction related to Hurricane Helena and to a lesser extent from the strikes at Boeing and US ports along the East and Gulf coasts. Initial jobless claims are up 6,000 in the week ending September 28 after a minor upward revision to 219,000 in the prior week. The September 28 level matches the consensus in the Econoday survey of forecasters. The four-week moving average is down 750 to 224,250 in the September 28 week after 225,000 in the prior week. The underlying trend for new filings for unemployment benefits as of the current data is still largely unaffected by recent developments. However, claims are likely to rise sharply, if temporarily, due to the wide area of destruction related to Hurricane Helena and to a lesser extent from the strikes at Boeing and US ports along the East and Gulf coasts.
Insured unemployment is essentially unchanged in the September 21 week. The level is down 1,000 to 1.826 million after 1.827 million in the prior week. The four-week moving average is down 4,750 to 1.829 million after 1.834 million in the September 14 week. The insured rate of unemployment remains steady at 1.2 percent in the September 21 and has seen almost no variation since March 2023. Like the numbers of new claims, there will probably be a temporary increase in the overall numbers in coming weeks.
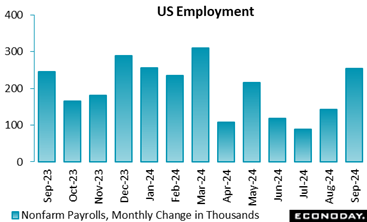 Nonfarm payrolls are up 254,000 in September along with a net upward revision of 72,000 in the prior two months. The September increase is a big upside surprise compared to the consensus of up 132,500 in the Econoday survey of forecasters and surpasses the high end of the range of expectations of up 180,000. Fed policymakers will not regret the 50-basis point rate cut announced on September 18 which was in part to preserve the labor market in its present state now that it has rebalanced and normalized. However, it also means that the FOMC will be comfortable further easing restrictive monetary policy at a tempered pace along the lines of its forecasts in the summary of economic projections. The monthly average in payroll gains for the third quarter is 186,000, somewhat above the monthly average for the second quarter of 147,000, but slower than 267,000 in the first quarter. Nonfarm payrolls are up 254,000 in September along with a net upward revision of 72,000 in the prior two months. The September increase is a big upside surprise compared to the consensus of up 132,500 in the Econoday survey of forecasters and surpasses the high end of the range of expectations of up 180,000. Fed policymakers will not regret the 50-basis point rate cut announced on September 18 which was in part to preserve the labor market in its present state now that it has rebalanced and normalized. However, it also means that the FOMC will be comfortable further easing restrictive monetary policy at a tempered pace along the lines of its forecasts in the summary of economic projections. The monthly average in payroll gains for the third quarter is 186,000, somewhat above the monthly average for the second quarter of 147,000, but slower than 267,000 in the first quarter.
Private payrolls are up 223,000 in September. Payrolls among goods-producers are up 21,000 with construction up 25,000, mining and logging up 3,000, and manufacturing down 7,000. Private service-providers' payrolls are up 202,000 with widespread increases led by 78,000 in leisure and hospitality and 81,000 in education and health services.
Average hourly earnings are up 0.4 percent in September from August and up 4.0 percent year-over-year. Although gains in hourly earnings have moderated since the start of 2024, these remain consistent with solidly rising incomes. The average workweek is down 0.1 hour to 34.2 hours in September.
The unemployment rate is down a tenth to 4.1 percent in September and the U-6 unemployment rate is down two-tenths to 7.7 percent. The participation rate is unchanged at 62.7 percent. The number of people employed is up 430,000 to 161,864 in September while the number of people unemployed is down 281,000 to 6.834 million.
Part-time employment for economic reasons is down 206,000 to 4.624 million in September. Job losers are down 95,000 to 3.233 million and job leavers are down 27,000 to 818,000. There are 662,000 new entrants in the labor force, down 56,000 in September.
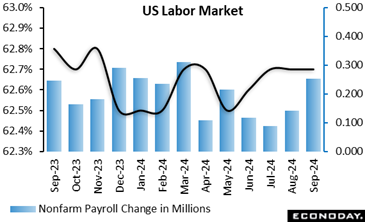 Overall, the report reflects a healthy labor market able to absorb new workers, employ those who are in the market for a job, and with employers able to find workers to fill empty slots although offering higher compensation to do so. Overall, the report reflects a healthy labor market able to absorb new workers, employ those who are in the market for a job, and with employers able to find workers to fill empty slots although offering higher compensation to do so.
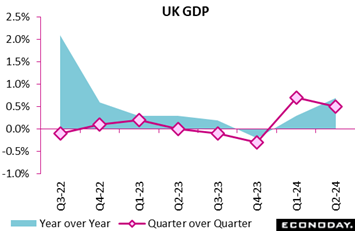 The economy expanded by slightly less than originally reported in the second quarter. A 0.5 percent quarterly rate was a tick less than shown in the provisional report and reduced annual growth from 0.9 percent to 0.7 percent, albeit still up on the first quarter's unrevised 0.3 percent pace. The economy expanded by slightly less than originally reported in the second quarter. A 0.5 percent quarterly rate was a tick less than shown in the provisional report and reduced annual growth from 0.9 percent to 0.7 percent, albeit still up on the first quarter's unrevised 0.3 percent pace.
Household consumption posted a modest and unrevised 0.2 percent quarterly gain, down from the previous period's 0.6 percent rise, while growth of gross fixed capital formation eased from 1.2 percent to a slightly stronger revised 0.6 percent. Within the latter, business investment now shows a 1.4 percent advance having dipped 0.1 percent in the earlier estimate. Government spending jumped 1.1 percent but business inventories subtracted 0.2 percentage points.
Net foreign trade had a sizeable negative impact, subtracting a larger revised 2.2 percentage points as a 0.3 percent drop in exports was compounded by a 6.3 percent spike in imports. At £22.5 billion, the real foreign trade deficit was the largest since the first quarter of 2022.
Still, despite the small downward adjustment to headline growth, the composition of final demand is more positive and confirms that the economy outperformed most expectations over the first half of the year. As such, it also reduces pressure on the BoE to cut Bank Rate again in November.
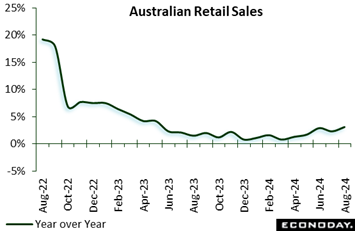 Retail sales in Australia advanced 0.7 on the month in August after no change in July, with year-over-year growth picking up from 2.2 percent to 3.1 percent. Performance was relatively even on a regional basis, with sales increasing close to the national average in all states and territories. Clothing and department stores sales recorded increases stronger than the headline increase, offset by a fall in sales of household goods. Officials noted that warmer-than-usual weather in many areas supported sales growth in August. Retail sales in Australia advanced 0.7 on the month in August after no change in July, with year-over-year growth picking up from 2.2 percent to 3.1 percent. Performance was relatively even on a regional basis, with sales increasing close to the national average in all states and territories. Clothing and department stores sales recorded increases stronger than the headline increase, offset by a fall in sales of household goods. Officials noted that warmer-than-usual weather in many areas supported sales growth in August.
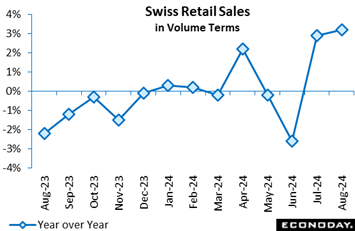 Retail sales made further progress in August. Volumes rose 0.4 percent versus July when they increased an upwardly revised 2.2 percent. Annual growth climbed from a stronger revised 2.9 percent to 3.2 percent, again well above the market consensus and the best performance since February 2022. Retail sales made further progress in August. Volumes rose 0.4 percent versus July when they increased an upwardly revised 2.2 percent. Annual growth climbed from a stronger revised 2.9 percent to 3.2 percent, again well above the market consensus and the best performance since February 2022.
August's monthly gain was attributable to a 0.6 percent rise in purchases of food, drink and tobacco and a 2.4 percent gain in auto fuel. Non-food sales, excluding auto fuel, dropped 0.4 percent but that came after a 2.0 percent spike in July.
Today's update sees average total volume sales in July/August 1.6 percent above their mean level in the second quarter and so puts the retail sector on course to provide a tidy boost to third quarter GDP growth.
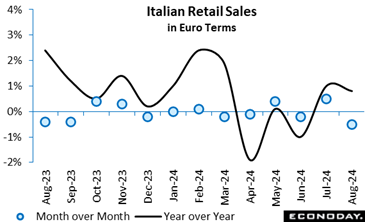 August retail sales fell 0.5 percent on the month in value, indicative of dwindling consumer appetite. Volumes were also down 0.4 percent, with food dropping 0.2 percent and non-food off a steeper 0.5 percent. August retail sales fell 0.5 percent on the month in value, indicative of dwindling consumer appetite. Volumes were also down 0.4 percent, with food dropping 0.2 percent and non-food off a steeper 0.5 percent.
On a yearly basis, nominal sales increased by 0.8 percent and volumes 0.2 percent, wholly due to gains in food. Non-food volumes decreased 0.2 percent, partly due to a significant decrease in sales of household utensils and hardware. This offset the increase in sales of perfumers and personal care products.
Compared to August last year, the value of retail sales for large-scale distribution is growing. On the other hand, sales on digital platforms are falling alongside more traditional retail channels. These updates leave the RPI at minus 14 and the RPI-P at minus 13, showing that recent overall economic activity is lagging market estimates.
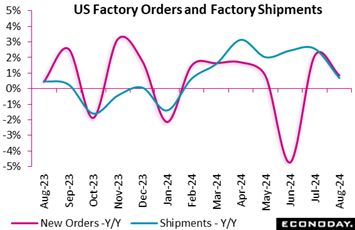
New orders for all factory goods are down 0.2 percent in August after rising 4.9 percent in July. The August decrease is below the consensus of up 0.2 percent in the Econoday survey of forecasters. New orders for durable goods are unrevised at unchanged in August while nondurable goods orders are down 0.5 percent. The August decline can be attributed to a larger than anticipated decrease of 2.3 percent in petroleum and coal products.
New orders for all factory goods excluding transportation are down 0.1 percent in August after up 0.3 percent in July while orders excluding defense are down 0.4 percent in August after up 4.9 percent in the prior month. Transportation orders are down 0.8 percent in August. Orders for defense capital goods are up 5.4 percent.
The so-called "core" new orders – nondefense capital goods excluding aircraft – are up 0.3 percent in August after falling 0.3 percent in July.
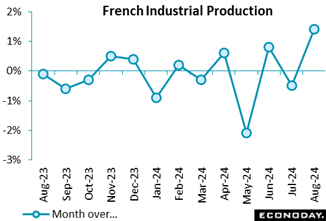 Industrial production experienced a strong rebound in August, with goods production rising by 1.4 percent following a revised increase in July. The pharmaceutical sector was the primary driver of this surge, experiencing a remarkable 22 percent increase, which was a reflection of the significant rise in pharmaceutical production. The transport equipment industry also rebounded, experiencing a 3.3 percent increase following a previous contraction. Nevertheless, the report emphasises the ongoing declines in critical sectors, such as petroleum products, agricultural products, and machinery, which fell by 2.4 percent, 0.5 percent and 1.1 percent respectively. Industrial production experienced a strong rebound in August, with goods production rising by 1.4 percent following a revised increase in July. The pharmaceutical sector was the primary driver of this surge, experiencing a remarkable 22 percent increase, which was a reflection of the significant rise in pharmaceutical production. The transport equipment industry also rebounded, experiencing a 3.3 percent increase following a previous contraction. Nevertheless, the report emphasises the ongoing declines in critical sectors, such as petroleum products, agricultural products, and machinery, which fell by 2.4 percent, 0.5 percent and 1.1 percent respectively.
The year-over-year data shows a 0.5 percent rise in industrial output and is less optimistic, despite the monthly recovery. The industries that brought down this rate of growth include the transport equipment sector, which experienced a significant decline of 6 percent, with motor vehicle manufacturing experiencing a 14.3 percent decline. However, the mining, energy, and water sectors, as well as the other manufacturing industries, demonstrated modest annual growth.
This report emphasises the inconsistent recovery in the industrial sector, with pharmaceutical output driving the growth, while other industries, primarily transport and machinery, continue to struggle. The uneven performance indicates that the industrial recovery as a whole remains fragile, leaving the RPI at minus 4 (within market consensus) and the RPI-P at 13, (outperforming market consensus).
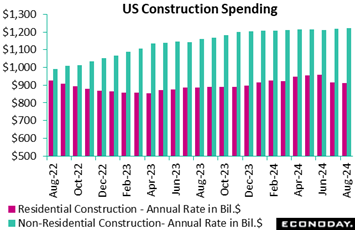 Construction spending is down 0.1 percent in August after a downward revision to down 0.5 percent in July. Construction spending is above the consensus of down 0.3 percent in the Econoday survey of forecasters. Construction spending is up 4.1 compared to a year ago. Total spending on residential building is down 0.3 percent in August and nonresidential is up 0.1 percent. Construction spending is down 0.1 percent in August after a downward revision to down 0.5 percent in July. Construction spending is above the consensus of down 0.3 percent in the Econoday survey of forecasters. Construction spending is up 4.1 compared to a year ago. Total spending on residential building is down 0.3 percent in August and nonresidential is up 0.1 percent.
Private residential construction is down 0.3 percent in August and reflects a decrease of 1.5 percent in single-family home projects and 0.4 percent in multi-family building. However, spending on home improvement – total private residential less single- and multi-unit building – is up 1.0 percent in August. New homebuilding in August took a step back as builders and buyers both waited to see if financing costs would fall in anticipation of a rate cut by the FOMC on September 18.
Public construction is up 0.3 percent in August on a mixed performance across categories. However, spending on highway and street construction – the largest category – is up 1.1 percent in the month.
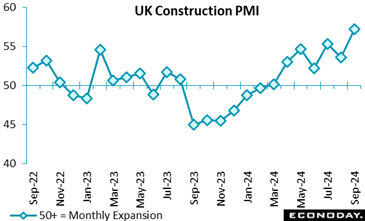 Construction activity fairly boomed at quarter-end. The September sector PMI weighed in at fully 57.2, more than 4 points above the market consensus and its strongest reading since April 2022. Construction activity fairly boomed at quarter-end. The September sector PMI weighed in at fully 57.2, more than 4 points above the market consensus and its strongest reading since April 2022.
The buoyant headline index in part reflected a particularly good month for civil engineering. Here, the subsector PMI climbed to 59.0 on the back of robust demand for renewable energy infrastructure and a general uplift in work on major projects. Commercial building (55.2) also gained momentum as did housing (54.3). Total new orders rose by the most in two-and-a-half years and overall headcount expanded for a fourth time in the last five months. However, while vendor delivery times shortened, input costs still increased at the steepest rate since May 2023. Business expectations for the year ahead eased to their lowest level since April but remained optimistic.
September's findings are surprisingly strong and will leave the BoE's MPC hawks all the more wary about cutting Bank Rate again too soon. Indeed, today's update lifts the UK RPI to 17 and the RPI-P to 11, both gauges now showing overall economic activity running slightly ahead of market forecasts.
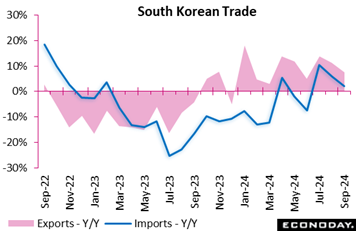 South Korea's trade surplus widened from $3.83 billion in August to $6.66 billion in September. Exports rose 7.5 percent on the year after increasing 11.4 percent previously, while imports advanced 2.2 percent on the year after a previous increase of 6.0 percent. South Korea's trade surplus widened from $3.83 billion in August to $6.66 billion in September. Exports rose 7.5 percent on the year after increasing 11.4 percent previously, while imports advanced 2.2 percent on the year after a previous increase of 6.0 percent.
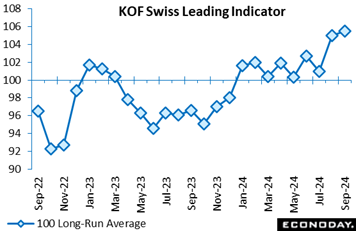 The headline index was a good deal stronger than expected at quarter-end. At 105.5, the September reading was 2.5 points above the market consensus and up from a significantly higher revised 105.0 in August. This was its second highest print since October 2021 and more than 5 points firmer than its 100 long-run average. The headline index was a good deal stronger than expected at quarter-end. At 105.5, the September reading was 2.5 points above the market consensus and up from a significantly higher revised 105.0 in August. This was its second highest print since October 2021 and more than 5 points firmer than its 100 long-run average.
Moreover, the monthly gain reflected broad-based advances amongst the major components, notably in manufacturing and financial services. Domestic demand continues to expand but its overseas counterpart lost ground.
In sum, the September report points to a decidedly better outlook for economic growth than was the case in August and, if correct, could mean that the SNB has eased policy for the last time this year.
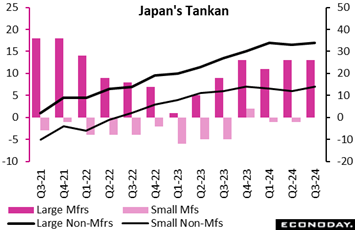 The Bank of Japan's quarterly Tankan business survey showed confidence among major manufacturers was flat in the September quarter, hit by sluggish demand in China that is still reeling from its property market woes and despite solid global demand for semiconductors. The Tankan diffusion index showing sentiment among major manufacturers stood at 13, unchanged from June. It was just below the median economist forecast of 14. Sharp deterioration in sentiment was reported by oil refineries and lumber/wood producers, which offset modest improvement among manufacturers of consumer electronics, computers and smartphones as well as those of metal products. The Bank of Japan's quarterly Tankan business survey showed confidence among major manufacturers was flat in the September quarter, hit by sluggish demand in China that is still reeling from its property market woes and despite solid global demand for semiconductors. The Tankan diffusion index showing sentiment among major manufacturers stood at 13, unchanged from June. It was just below the median economist forecast of 14. Sharp deterioration in sentiment was reported by oil refineries and lumber/wood producers, which offset modest improvement among manufacturers of consumer electronics, computers and smartphones as well as those of metal products.
By contrast, the index measuring sentiment among major non-manufacturers improved slightly to 34 from 33 seen three months earlier, coming in better than the consensus call of 32. Improvement among retailers and construction firms was largely offset by gloomier views among providers of services to individuals and telecom firms.
Major firms projected their plans for business investment in equipment would rise a combined 10.6 percent on year, below consensus of 11.9 percent, in fiscal 2024 ending on March 31, 2025, somewhat maintaining the solid pace after jacking them up to a 11.1 percent increase in the June survey from a cautious 4.0 percent gain projected in March.
Smaller firms raised their combined capital spending plans to an impressive 2.6 percent increase, as expected, after projecting a 0.8 percent drop in June, which was still up from a 3.6 percent dip planned in March. Smaller firms tend to have conservative plans at the start of each fiscal year and revise them up later. Capex plans are generally supported by demand for automation amid labor shortages as well as government-led digital transformation and emission control.
Major manufacturers on average forecast an annual inflation rate of 2.0 percent a year from now (2.1 percent in the previous survey), 1.8 percent in three years (1.8 percent) and 1.8 percent in five years (1.7%). Large non-manufacturers expect inflation at 1.9 percent in a year (2.0 percent previously), 1.7 percent in three years (1.8 percent) and 1.6 percent in five years (1.6 percent). Smaller firms expect a higher rate of inflation around 2.5 percent in all timeframes, feeling the burden of high materials and labor costs.
BOJ policymakers will analyze this and other pieces of data ahead of their next policy meeting on Oct. 30-31, when the board will discuss the need to raise interest rates further and update their medium-term growth and inflation forecasts. The bank has been in the process of gradually normalizing its policy since it conducting its first rate hike in 17 years in March.
The BOJ Tankan was conducted from Aug. 27 until Sept. 30. Many firms are believed to have returned their responses by mid-September, when the yen had already appreciated close to ¥140 to the dollar from around ¥147. The diffusion index is calculated by subtracting the percentage of companies reporting deteriorating business conditions from the percentage of those reporting an improvement. A positive figure indicates the majority of firms see better business conditions.
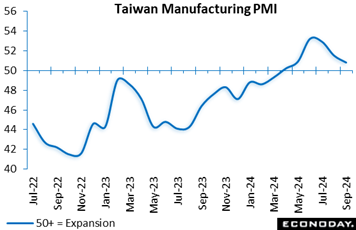 Taiwan's manufacturing PMI shows the sector expanded for the sixth consecutive month but at a slower pace in September, with its headline index falling to 50.8 from 51.5 in August. Respondents reported solid external demand but more subdued domestic conditions and are less confident about the outlook for output growth over the next 12 months. Taiwan's manufacturing PMI shows the sector expanded for the sixth consecutive month but at a slower pace in September, with its headline index falling to 50.8 from 51.5 in August. Respondents reported solid external demand but more subdued domestic conditions and are less confident about the outlook for output growth over the next 12 months.
Survey respondents reported output and new orders grew at a slower pace in September, with the former recording the slowest growth in the current six-month run of expansion. New export orders, however, were reported to have risen for the fourth month in a row, reflecting strong demand from Europe and the United States. The survey showed further stagnation in payrolls, while its measure of business confidence fell to its lowest level so far this year. Respondents reported a smaller increase in input costs and no change in selling prices.
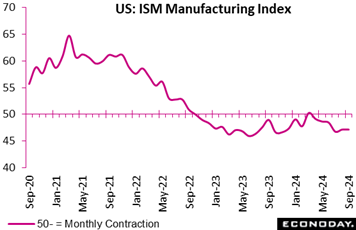 US manufacturing activity was in contraction for the sixth straight month in September on continued sluggish demand as firms remain reluctant to invest in capacity amid uncertainty over the pace of the Federal Reserve's unwinding of its tight monetary policy and the outcome of the presidential election next month, the latest monthly data from the Institute for Supply Management showed. US manufacturing activity was in contraction for the sixth straight month in September on continued sluggish demand as firms remain reluctant to invest in capacity amid uncertainty over the pace of the Federal Reserve's unwinding of its tight monetary policy and the outcome of the presidential election next month, the latest monthly data from the Institute for Supply Management showed.
The sector index compiled by the ISM, which indicates general direction, was flat at 47.2 after edging up 0.4 point to 47.2 in August. The latest reading came in slightly weaker than the median economist forecast of 47.6.
"Demand remains subdued, as companies showed an unwillingness to invest in capital and inventory due to federal monetary policy - which the US Federal Reserve addressed by the time of this report - and election uncertainty," Timothy Fiore, chair of the ISM Manufacturing Business Survey Committee, said in a statement. "Production execution stabilized in September. Suppliers continue to have capacity, with lead times improving and shortages reappearing."
The full impact of the damage caused by Hurricane Helene – massive disruptions of supply chains and production of plastics and steel, particularly the Gulf coast – is expected to show in the ISM's October report, which is likely to be a "cloudy" one.
He told reporters that the rate cut by the Federal Reserve in September is likely to give a boost to the sector in early 2025. He has said the expected first rate cut in four years by the Fed was unlikely to push up new orders for several months. He repeated his conviction that the manufacturing sector is stuck in a temporary trough.
Fiore said 13 percent of the manufacturers surveyed by the ISM is showing concern over Fed rate policy in the latest monthly report, up from 5% five months ago. Asked about uncertainty over US election results regarding trade rows with China, he said he does not see a huge difference between the Democrats and Republicans, so that whichever party wins, the pressure on China is set to continue.
Among the five subindexes that directly factor into the manufacturing PMI, the new orders index contracted in September for the sixth consecutive month, registering 46.1, an increase of 1.5 percentage points compared to August's figure of 44.6. It hasn't indicated consistent growth since a 24-month streak of expansion ended in May 2022. The production index rose 5.0 points to 49.8 after slipping to 44.8 in August to remain the lowest since 34.2 in May 2020, when world demand plunged at the initial phase of the pandemic.
The employment index stood at 43.9, down 2.1 points from 46.0 in August. "Respondents' companies are continuing to reduce head counts through layoffs, attrition and hiring freezes," Fiore said. Asked about Fed Chair Jerome Powell's latest assessment that the labor market is slowing but still strong, Fiore replied that the Fed chief is talking about the entire US economy while the manufacturing sector, which represents only 10% of the economy, has seen sluggish employment.
The supplier deliveries index rose 1.7 points to 52.2. This is the only ISM subindex that is inversed; a reading of above 50 indicates slower deliveries, which is typical as the economy improves and customer demand increases.
The manufacturing inventories index slipped back below the neutral line of 50, down 6.4 points at 43.9 after rising 5.8 to 50.3 in August, when it popped into expansion territory for the first time in 19 months.
Among other subindexes, the prices paid index was at 48.3, down 5.7 points from the August reading of 54.0, thanks to less volatile commodity prices. Petroleum-derived products are showing weakness, aluminum is indicating slowing growth, corrugate and ocean freight are continuing growth and steel and steel products prices are easing.
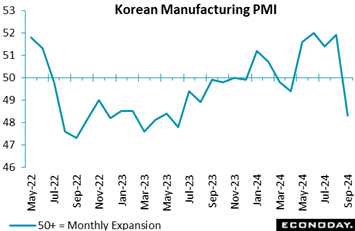 South Korea's manufacturing PMI showed renewed contraction in the sector in September after four consecutive months of expansion, with the survey's headline index falling sharply to a 13-month low of 48.3 from 51.9 in August. Respondents reported weaker current conditions and more subdued price pressures and also have less confidence about the outlook. South Korea's manufacturing PMI showed renewed contraction in the sector in September after four consecutive months of expansion, with the survey's headline index falling sharply to a 13-month low of 48.3 from 51.9 in August. Respondents reported weaker current conditions and more subdued price pressures and also have less confidence about the outlook.
Survey respondents reported declines in output, new orders and new export orders in September. Respondents also reported a fall in payrolls after four consecutive increases and are less optimistic about the outlook for output growth over the next 12 months. The survey shows a smaller increase in input costs and the first fall in selling prices in more than a year.
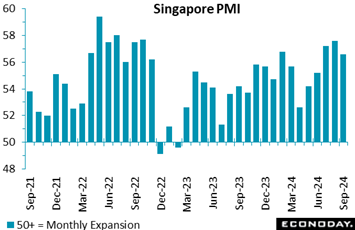 The S&P Global Singapore PMI survey indicates growth in the aggregate economy remained strong but moderated in September, with the survey's headline index falling to 56.6 from 57.6 in August. Respondents reported ongoing strength in domestic demand, above-average optimism about the outlook, and solid price pressures. The S&P Global Singapore PMI survey indicates growth in the aggregate economy remained strong but moderated in September, with the survey's headline index falling to 56.6 from 57.6 in August. Respondents reported ongoing strength in domestic demand, above-average optimism about the outlook, and solid price pressures.
Today's survey shows output and new orders rose at strong but slightly less pronounced pace in September, with respondents also reporting another increase in payrolls. The survey's measure of business confidence fell after it reached its highest level in more than three years in August, but it continues to indicate that firms expect solid growth in output over the next twelve months. Respondents also reported strong but slightly more moderate increases in both input costs and selling prices.
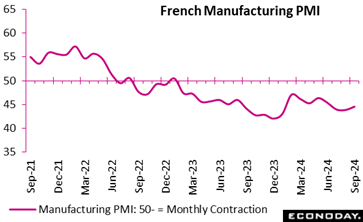 The most recent PMI data indicates that the French manufacturing sector is still experiencing significant challenges, as evidenced by the general decline in demand. The resulting reduction in output, lower purchasing levels, and declining inventories is a direct result of the significant decrease in new orders. The final PMI for September was 44.6, a slight increase from August but still well below the 50-expansion threshold and indicative of a substantial decline in activity. The automotive sector and the absence of export opportunities, primarily in North America and Western Europe, contributed to the subdued market. The most recent PMI data indicates that the French manufacturing sector is still experiencing significant challenges, as evidenced by the general decline in demand. The resulting reduction in output, lower purchasing levels, and declining inventories is a direct result of the significant decrease in new orders. The final PMI for September was 44.6, a slight increase from August but still well below the 50-expansion threshold and indicative of a substantial decline in activity. The automotive sector and the absence of export opportunities, primarily in North America and Western Europe, contributed to the subdued market.
To conserve cash flow, companies also reduced pre-production inventories at the quickest rate in over four years, as supplier delays persisted. The sector's ongoing pessimism reflects the decline in employment levels, which is primarily attributable to the non-renewal of temporary contracts. However, input cost inflation, which peaked in July, continues to fall.
Manufacturing remains in a state of distress, with little prospect a recovery in the near future.
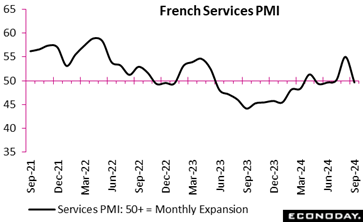 The French service sector experienced a marginal contraction in September, as evidenced by the French services PMI report, which follows the Olympic Games' positive impact in August. New orders and output fell due to a decrease in demand from domestic and international consumers. Backlogs were down by the most in nine months. Nevertheless, employment increased marginally, which is indicative of the optimism of firms regarding future development, leading to business confidence spiking to a 26-month high. The French service sector experienced a marginal contraction in September, as evidenced by the French services PMI report, which follows the Olympic Games' positive impact in August. New orders and output fell due to a decrease in demand from domestic and international consumers. Backlogs were down by the most in nine months. Nevertheless, employment increased marginally, which is indicative of the optimism of firms regarding future development, leading to business confidence spiking to a 26-month high.
Furthermore, input cost inflation decreased to its lowest level in more than three years while output prices remained constant, thereby concluding a protracted period of price increases. Nevertheless, the sector's performance was impacted by reduced visitor numbers and uncertainty among clients. In general, the report suggests that the service sector's long-term prospects are optimistic, despite the short-term challenges resulting from the post-Olympic decline.
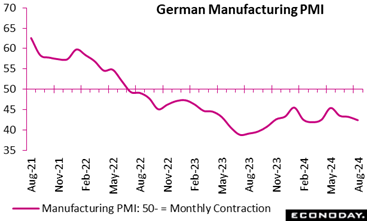 The German PMI decreased from 42.4 in August to a final 40.6 in September, indicating the most significant decline in the German economic activity in 12 months. However, it was still slightly stronger than the market consensus. The German PMI decreased from 42.4 in August to a final 40.6 in September, indicating the most significant decline in the German economic activity in 12 months. However, it was still slightly stronger than the market consensus.
Sluggish demand, market uncertainty, and a struggling automotive sector ensured that key indicators such as output, new orders, and employment all continued to deteriorate. Export sales also experienced a substantial decline, while total new orders fell by the most since October last year. Manufacturers reduced headcount at the quickest rate in over four years and cut purchasing activities as demand continues to fall faster than output. This resulted in the steepest fall in inventories since 2009.
Meantime, weaker input costs, particularly for steel, prompted a reduction in output prices and despite some minor enhancements in supplier delivery times, business confidence plummeted. Indeed, expectations for future output were the lowest since October 2023.
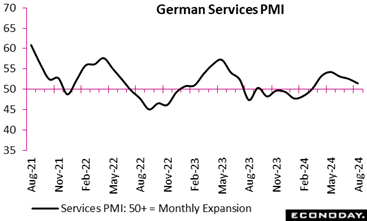 Business activity slowed significantly in the service sector at the end of the third quarter. The sector PMI dropped 0.6 points to an unrevised 50.6, still above the 50-expansion threshold but the lowest level in six months. Business activity slowed significantly in the service sector at the end of the third quarter. The sector PMI dropped 0.6 points to an unrevised 50.6, still above the 50-expansion threshold but the lowest level in six months.
New business declined by the most since February with export demand especially weak. For the third month in a row, jobs were also cut and rising recession concerns saw business sentiment hit its lowest point in a year.
The inflationary pressures diminished as input costs increased at the weakest rate since February 2021, primarily due to smaller wage increases. Output price inflation also eased but continued to exceed pre-pandemic levels. The slowdown in cost increases provides some respite for businesses although the overall outlook for growth remains bleak. Today's update puts the RPI at minus 1 and RPI-P at 8, showing economic activity in general broadly matching the consensus.
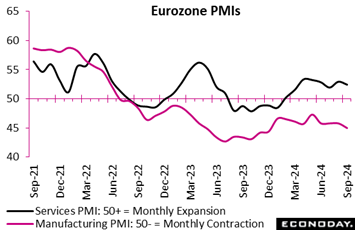 At 49.6 the final PMI composite index for September was below the 50.0-growth threshold and at 7 month low. It was 1.4 points less than in August but 0.7 points stronger than the flash estimate. This signals that while the industry is contracting, the latter half of September outperformed the earlier part of the month. At 49.6 the final PMI composite index for September was below the 50.0-growth threshold and at 7 month low. It was 1.4 points less than in August but 0.7 points stronger than the flash estimate. This signals that while the industry is contracting, the latter half of September outperformed the earlier part of the month.
Another decrease in new orders prompted a fresh fall in factory output and backlogs also decreased again. Employment was cut as layoffs intensified and business optimism weakened despite easing cost pressures where inflation was the second-slowest since November 2020.
The service index for September was 51.4, also lower than in August (52.9) but still signalling a modest expansion. Even so, new business decreased for the first time since February, albeit only marginally. Outstanding orders were run down to support activity and employment continued to rise. Services inflation cooled and optimism for the next 12 months strengthened.
At the national level, the best-performing countries were Spain (56.3) and Ireland (52.1), both of which saw an expansion of business activities. The weaker performing countries were Italy (49.7), France (48.6) and Germany (47.5), all of which fell short of 50-growth threshold.
Manufacturing activity deteriorated in September. At 45.0, the final reading was just 0.2 points above its flash estimate, 0.8 points below the August report and fully 5 points below the 50-expansion threshold.
In manufacturing, the best-performing countries were Spain (53.0) and Greece (50.3) where growth was at least positive. However, Ireland (49.4), Italy (48.3), Netherlands (48.2), France (44.6), Austria (42.8) and Germany (40.6) all saw fresh contractions. In particular, Germany recorded its weakest performance in 12 months.
September's setback reflects shrinking purchasing activity and depleted inventories of both pre- and post-production items. This led to even more staff being cut with job shedding the most pronounced since October 2012, excluding pandemic-hit months.
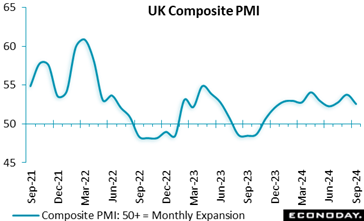 The UK composite index fell from 53.8 in August to 52.6 in the final September data. This indicates a slower rate of expansion in private-sector economic activity and reflects the weakest rise in both new orders and employment seen in the last three months. The UK composite index fell from 53.8 in August to 52.6 in the final September data. This indicates a slower rate of expansion in private-sector economic activity and reflects the weakest rise in both new orders and employment seen in the last three months.
The service sector index also dropped in September from 53.7 in August to a downwardly revised 52.4. Demand continued to rise but cautious decision-making among corporate clients and the impact of stretched household disposable incomes may have restrained business activity. The increase in new business volume was offset by policy uncertainty ahead of the Autumn Budget on 30th October 2024 which encouraged a wait-and-see approach to major investment decisions among clients. Employment growth slowed noticeably with rising wage costs cited as a key factor.
Output prices rose but competitive pressures made for the smallest increase since February 2021. Business activity expectations for the year ahead picked up despite many firms noting an uncertain near-term outlook for fiscal policy. This positive sentiment was due to softening inflationary pressures and stable domestic economic conditions.
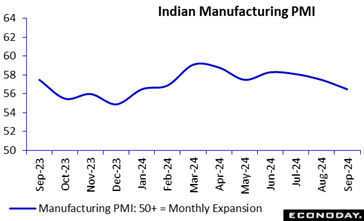 The S&P Global India manufacturing PMI indicates activity in the sector moderated in September, with the headline index falling to a eight-month low of 56.5 from 57.5 in August. This is below the flash estimate of 56.7. Less timely industrial production data published last month showed solid growth in the manufacturing sector in Jul7y, with August data scheduled to be published mid-October. The S&P Global India manufacturing PMI indicates activity in the sector moderated in September, with the headline index falling to a eight-month low of 56.5 from 57.5 in August. This is below the flash estimate of 56.7. Less timely industrial production data published last month showed solid growth in the manufacturing sector in Jul7y, with August data scheduled to be published mid-October.
PMI survey respondents reported slower growth in output, new orders and new export orders in September. The survey also shows weaker growth in payrolls while its measure of business confidence fell to its lowest level since April 2023. Respondents reported stronger growth in input costs but a smaller increase in selling prices.
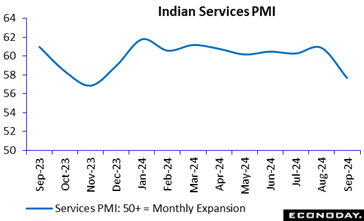 The S&P Global PMI survey for India's services sector shows conditions remained very strong but lost momentum in September with the survey's main business activity index falling to 57.7 from 60.9 in July. This compares with the flash estimate of 58.9. The manufacturing sector PMI, published earlier in the week, also showed more moderate but still strong conditions, with its headline index falling from 57.5 to 56.6. The composite index covering both sectors fell from 60.7 in August to 58.3 in September, below the flash estimate of 59.3. With these PMI surveys still showing very robust conditions in the Indian economy, the Reserve Bank of India's focus will likely remain on risks to the inflation outlook at upcoming policy meetings. The S&P Global PMI survey for India's services sector shows conditions remained very strong but lost momentum in September with the survey's main business activity index falling to 57.7 from 60.9 in July. This compares with the flash estimate of 58.9. The manufacturing sector PMI, published earlier in the week, also showed more moderate but still strong conditions, with its headline index falling from 57.5 to 56.6. The composite index covering both sectors fell from 60.7 in August to 58.3 in September, below the flash estimate of 59.3. With these PMI surveys still showing very robust conditions in the Indian economy, the Reserve Bank of India's focus will likely remain on risks to the inflation outlook at upcoming policy meetings.
Respondents to the service sector survey reported output, new orders and new export orders all continued to grow at a very strong pace in September, albeit at the slowest pace in several months in each case. The survey also shows another solid increase in payrolls while its measure of business confidence picked up from the previous month. Respondents reported a bigger increase in input costs but a smaller increase in selling prices.
Global data show reduced downside surprises despite Chinese weakness. At minus 8, Econoday’s Relative Economic Performance Index (RPI) continues to show recent global economic activity lagging market expectations, but not by much. China in particular remains a significant drag, but Eurozone readings have improved, and the U.S. continues to outperform.
In the U.S., a reminder of just how tight the labor market is kept the RPI and RPI-P (both 19) above zero. Overall outperformance versus market expectations has been a feature of the economy since early September and must raise new doubts about how quickly the Federal Reserve will ease policy over coming months.
In Canada, an absence of key data last week left the RPI-P at minus 10 and the RPI-P at 3. Overall economic activity is broadly matching expectations which means financial markets will remain focused on the size of a probable interest rate cut by the Bank of Canada later this month.
In the Eurozone, the RPI (2) just about crept back above zero while the RPI-P (14) made rather more progress. Crucially, the gap between the two measures essentially reflects a surprisingly weak September inflation report and it is this that has significantly boosted the chances of another cut in the European Central Bank’s key interest rates next week.
In the UK, economic data generally last week surprised on the upside and were firm enough to lift the RPI to 17 and the RPI-P to 11. Economic activity in general is now running ahead of expectations but not by much and not to the extent that would provide a clear pointer to how the November MPC will vote.
Much like the Eurozone, positive readings on the Swiss RPI (4) and RPI-P (21) show economic activity running a little stronger than expected. However, inflation continues to surprise on the downside and September’s notably weak report has further boosted speculation about the Swiss National Bank easing again in December.
In Japan, a mixed bag of data was on balance firm enough to keep both the RPI (16) and RPI-P (28) above zero. Even so, the broader picture is less convincing and dovish comments from new PM Shigeru Ishiba have left investors all the more uncertain about when the Bank of Japan will tighten again.
In complete contrast to the U.S., the Chinese RPI and RPI-P both closed out the week at minus 50, extending the unbroken run of sub-zero readings that began back at the start of August. Such readings simply reinforce the need for the national central bank to deliver on the bazooka monetary stimulus package that it announced late last month.
**Contributing to this article were Jeremy Hawkins, Brian Jackson, Mace News, Max Sato, Olajide Oyadeyi, Theresa Sheehan and Jeff Czernek
The highlight of the US economic data in the October 7 week will be the consumer price index (CPI) for September at 8:30 ET on Thursday. The report is expected to provide more evidence that upward price pressures continued to abate at the all-items level and are moving sustainably toward the Fed’s 2 percent inflation target. However, it will be the index excluding food and energy that will get more attention. Fed policymakers are still keeping a close eye on non-housing services and shelter costs as less responsive to restrictive monetary policy intended to curb inflation, whereas commodities prices have eased considerably more as supply chains are back to normal conditions.
German Manufacturing Orders for August (Mon 0800 CEST; Mon 0600 GMT; Mon 0200 EDT)
Consensus Forecast, Month over Month: -2.0%
Consensus Range, Month over Month: -3.0% to -1.0%
Manufacturing orders are expected to decrease a monthly 2.0 percent versus July’s 2.9 percent monthly increase.
Eurozone Retail Sales for August (Mon 1100 CEST; Mon 0900 GMT; Mon 0500 EDT)
Consensus Forecast, Month over Month: 0.3%
Consensus Range, Month over Month: 0.0% to 0.5%
Consensus Forecast, Year over Year: 1.0%
Consensus Range, Year over Year: 0.9% to 1.2%
Retail sales volumes in August are expected to rise 0.3 percent on the month after July's 0.1 percent rise. The annual rate is expected to be at 1.0 percent which would compare with minus 0.1 percent in July.
German Industrial Production for August (Tue 0800 CEST; Tue 0400 GMT; Tue 0200 EDT)
Consensus Forecast, Month over Month: 0.8%
Consensus Range, Month over Month: 0.0% to 1.5%
Industrial production in August is expected to rise 0.8 percent on the month after a surprisingly large 2.3 percent decline in July.
Canadian Merchandise Trade for August (Tue 0830 EDT; Tue 1230 GMT)
Consensus Forecast, Balance of Trade: C$-0.1 B
Consensus Range, Balance of Trade: C$-1.1 B to C$0.5 B
August's trade balance is seen in deficit of C$0.1 billion versus July's surplus of C$0.684 billion and June's deficit of C$1.79 billion.
US International Trade in Goods and Services for August (Tue 0830 EDT; Tue 1230 GMT)
Consensus Forecast, Balance of Trade: -$71.0 B
Consensus Range, Balance of Trade: $-73.3 B to -69.7 B
A deficit of $71.0 billion is expected in August for total goods and services trade which would compare with a $78.8 billion deficit in July.
New Zealand RBNZ Announcement (Wed 1400 NZDT; Wed 0100 GMT; Tue 0900 EDT)
Consensus Forecast, Change: -50.0 bp
Consensus Range, Change: -50.0 bp to -25.0 bp
Consensus Forecast, Level: 4.75%
Consensus Range, Level: 4.75% to 5.0%
Reserve Bank of New Zealand is expected to cut official cash rate by 50 basis points from 5.25 percent to 4.75 percent.
Reserve Bank of India Announcement (Wed 1000 IST; Wed 0430 GMT; Wed 0030 EDT)
Consensus Forecast, Change: 0.0 bp
Consensus Range, Change: -35.0 bp to 0.0
Consensus Forecast, Level: 6.5%
Consensus Range, Level: 6.2% to 6.5%
Reserve Bank of India has left policy unchanged since February last year. Expectations for October’s meeting is that the benchmark repurchase rate will be unchanged at 6.5 percent.
German Merchandise Trade for August (Wed 0800 CEST; Wed 0600 GMT; Wed 0200 EDT)
Consensus Forecast, Balance: €18.4 B
Consensus Range, Balance: €17.0 B to €19.0 B
August's goods balance is expected to widen to a €18.4 billion surplus versus a narrower-than-expected surplus of €16.8 billion in July.
US Wholesale Inventories (Preliminary) for August (Wed 1000 EDT; Wed 1400 GMT)
Consensus Forecast, Month over Month: 0.2%
Consensus Range, Month over Month: 0.2% to 0.2%
The second estimate for August wholesale inventories is for a 0.2 percent increase, unchanged from the first estimate.
US CPI for September (Thu 0830 EDT; Thu 1230 GMT)
Consensus Forecast, CPI Month over Month: 0.1%
Consensus Range, CPI Month over Month: 0.0% to 0.2%
Consensus Forecast, CPI Year over Year: 2.3%
Consensus Range, CPI Year over Year: 2.3% to 2.4%
Consensus Forecast, Ex-Food & Energy Month over Month: 0.2%
Consensus Range, Ex-Food & Energy Month over Month: 0.2% to 0.3%
Consensus Forecast, Ex-Food & Energy Year over Year: 3.2%
Consensus Range, Ex-Food & Energy Year over Year: 3.1% to 3.2%
US CPI is expected to rise 0.1 percent month-over-month in September and 2.3 percent year-over-year. This is less than last month’s month-over-month increase of 0.2 percent and the year-over-year rise of 2.5 percent
US Jobless Claims for September (Thu 0830 EDT; Thu 1230 GMT)
Consensus Forecast, Level: 226.0
Consensus Range, Level: 220.0 to 240.0
Unemployment claims in the US are estimated to increase to 226 thousand, suggesting that the labor market could be slightly deteriorating.
Germany CPI for September (Fri 0800 CEST; Fri 0600 GMT; Fri 0200 EDT)
Consensus Forecast, Month over Month: 0.0%
Consensus Range, Month over Month: 0.0% to 0.0%
Consensus Forecast, Year over Year: 1.6%
Consensus Range, Year over Year: 1.6% to 1.6%
Consensus Forecast, HICP M/M: -0.1%
Consensus Range, HICP M/M: -0.1% to -0.1%
Consensus Forecast, HICP Y/Y: 1.8%
Consensus Range, HICP Y/Y: 1.8% to 1.8%
Germany’s CPI is expected to hold steady on the month and rise 1.6 percent on the year.
UK Monthly GDP for August (Fri 0700 BST; Fri 0600 GMT; Fri 0200 EDT)
Consensus Forecast, Month over Month: 0.2%
Consensus Range, Month over Month: 0.0% to 0.2%
UK’s GDP is expected to rise 0.2 percent month-over-month after no change was seen in July.
UK Industrial Production for August (Fri 0700 BST; Fri 0600 GMT; Fri 0200 EDT)
Consensus Forecast, Industrial Production – M/M: 0.3%
Consensus Range, Industrial Production – M/M: 0.2% to 0.6%
Consensus Forecast, Industrial Production – Y/Y: -0.4%
Consensus Range, Industrial Production – Y/Y: -1.7% to -0.2
Consensus Forecast, Manufacturing Output – M/M: 0.3%
Consensus Range, Manufacturing Output – M/M: 0.3% to 0.9%
The UK’s yearly industrial production is expected to fall 0.4 percent after falling 1.2 percent in July, whereas the monthly industrial production is estimated to rise 0.3 percent after falling 0.8 percent in July. Monthly manufacturing output is estimated to rise 0.3 percent after last month’s contraction.
Canadian Labour Force Survey for September (Fri 0830 EDT; Fri 1230 GMT)
Consensus Forecast, Employment – M/M: 35.0 K
Consensus Range, Employment – M/M: 15.0 K to 60.0 K
Consensus Forecast, Unemployment Rate: 6.6%
Consensus Range, Unemployment Rate: 6.6% to 6.7%
Monthly employment is expected to rise to 35 thousand while unemployment is estimated to hold steady at 6.6 percent after rising to 6.6 percent in August.
US PPI-Final Demand for September (Fri 0830 EDT; Fri 1230 GMT)
Consensus Forecast, PPI-FD – M/M: 0.2%
Consensus Range, PPI-FD – M/M: 0.0% to 0.2%
Consensus Forecast, PPI-FD – Y/Y: 1.6%
Consensus Range, PPI-FD – Y/Y: 1.3% to 1.7%
Consensus Forecast, Ex-Food & Energy – M/M: 0.2%
Consensus Range, Ex-Food & Energy – M/M: 0.1% to 0.2%
Consensus Forecast, Ex-Food & Energy – Y/Y: 2.7%
Consensus Range, Ex-Food & Energy – Y/Y: 2.0% to 2.7%
Producer prices in September are expected to rise 0.2 percent on the month after a marginal 0.2 percent rise in August.
|

