|
The week in US data included a few pieces of the inflation puzzle with the release of the September data for consumer and producer prices. Both told a similar story of ongoing moderation in upward price pressures – if in places a bit unevenly. It continues to be the case that declines in commodities prices have broadly outpaced those for services. Energy prices have been a particular source of disinflation on the commodities side while food costs have fluctuated a bit with weather events, lingering effects of bird flu among producers, and increased processing costs. The service sector is showing incremental decreases in prices but has yet to decelerate enough that the fight against inflation can be said to be over.
The minutes of the September 17-18 FOMC meeting indicated that Governor Michelle Bowman had some support in her dissent in the vote in favor of a 25-basis point rate cut rather than the more aggressive 50-basis points that was implemented. If the inflation data continues on its present path, and the labor market maintains its recent solid performance, there is every reason to think that the FOMC will not feel a need for further big cuts. Fed policymakers may have some challenges in looking through disruptions in the data related to the series of hurricanes that have ravaged states in the Southeastern US. But they are unlikely to overreact to one month’s worth of data when there is every reason to expect rebounds in important economic activity in the following month or two. A 25-basis point rate cut seems the most probable outcome of the November 6-7 FOMC meeting.
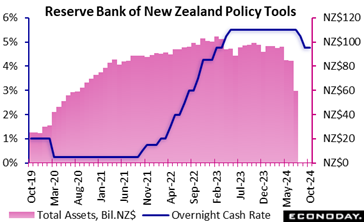 The Reserve Bank of New Zealand's Monetary Policy Committee has cut the official cash rate by 50 basis points from 5.25 percent to 4.75 percent, in line with the consensus forecast. This follows a cut of 25 basis points at their previous meeting in August, which was the first reduction in this rate since June 2020. The Reserve Bank of New Zealand's Monetary Policy Committee has cut the official cash rate by 50 basis points from 5.25 percent to 4.75 percent, in line with the consensus forecast. This follows a cut of 25 basis points at their previous meeting in August, which was the first reduction in this rate since June 2020.
This easing in policy at the last two meetings follows data showing headline CPI inflation fell to 3.3 percent in the three months to June from 4.0 percent in the three months to March, with core inflation falling from 3.7 percent to 2.8 percent. In the statement accompanying today's decision, officials advised that they remain confident that inflation will fall back to within their target range of one percent to three percent this quarter and remain within that range over the forecast horizon. Officials also pointed to recent weakness in both consumer spending and investment and noted risks to the outlook for external demand.
Reflecting this assessment, officials concluded that there is now "scope to further ease the level of monetary policy restrictiveness" while noting that policy remains restrictive after today's decision. This suggests that officials will consider further rate cuts in upcoming meetings provided they are confident that their inflation objectives will be met.
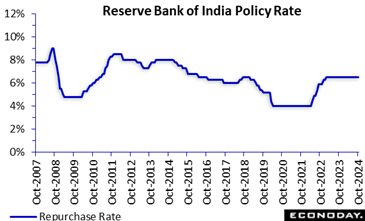 The Reserve Bank of India's Monetary Policy Committee has left the benchmark repurchase rate unchanged at 6.50 percent at its policy review held today, in line with the consensus forecast. This rate has now been on hold since February 2023 after it was earlier increased by a cumulative 250 basis points beginning in mid-2022. The Reserve Bank of India's Monetary Policy Committee has left the benchmark repurchase rate unchanged at 6.50 percent at its policy review held today, in line with the consensus forecast. This rate has now been on hold since February 2023 after it was earlier increased by a cumulative 250 basis points beginning in mid-2022.
Data released since the RBI's previous meeting in August have shown headline CPI inflation falling from 5.08 percent in June to 3.54 percent in July and 3.65 percent in August, below the mid-point of the RBI's target range of two percent to six percent. Recent activity data, meanwhile, have generally shown ongoing strength in economic conditions.
In the statement accompanying today's decision, RBI officials advised that they expect base effects may send inflation higher in the near-term but noted that recent favourable weather patterns should curb any increases in food prices. As a result, officials now advise that they have "greater confidence in the disinflation path over the next six months. Officials also remain confident in the resilience of economic activity.
Reflecting this assessment, officials today advised that they are shifting their policy stance from "the withdrawal of accommodation" to "neutral". This, they judge, will provide them with greater flexibility in upcoming meetings while enabling them to continue monitoring the path of disinflation. They also repeated their earlier pledge to remain focused on achieving "a durable alignment of the headline CPI inflation with the target".
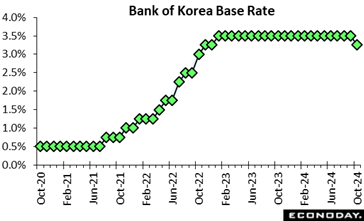 The Bank of Korea lowered its main policy rate by 25 basis points from 3.50 percent to 3.25 percent at its policy meeting held today, in line with the consensus forecast. At their two previous policy meetings officials had advised that a rate cut at upcoming meetings may be considered. Officials had left this rate on hold since the start of 2023 after tightening policy aggressively over 2022 as part of efforts to return headline inflation to their target level of 2.0 percent. The Bank of Korea lowered its main policy rate by 25 basis points from 3.50 percent to 3.25 percent at its policy meeting held today, in line with the consensus forecast. At their two previous policy meetings officials had advised that a rate cut at upcoming meetings may be considered. Officials had left this rate on hold since the start of 2023 after tightening policy aggressively over 2022 as part of efforts to return headline inflation to their target level of 2.0 percent.
Since the previous BoK meeting late August, data have shown falls in headline inflation from 2.6 percent in August to 2.0 percent in August and 1.6 percent in September, with core inflation easing to 2.0 percent in September. In the statement accompanying today's decision, officials retained their forecast for core inflation to average 2.2 percent this year and 2.0 percent in 2025 but noted uncertainties about the outlook. Officials also continue to expect moderate economic growth, forecasting GDP to expand by 2.4 percent this year and 2.1 percent next year.
Officials reaffirmed that they expect "that inflation will stabilize at the target level and that the moderate growth trend will continue" and assessed that risks in the foreign exchange market have eased. This, they concluded, provided scope to reduce policy rates today and they also indicated that further rate cuts will be considered in upcoming meetings.
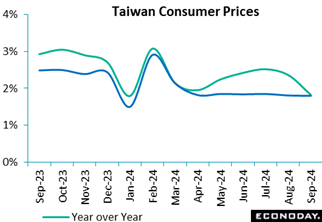 Taiwan's headline consumer price index rose 0.11 percent on the month in September after an increase of 0.40 percent in August, with the year-over-year increase moderating from 2.36 percent to 1.82 percent. Fruit prices rose strongly on the month after extreme weather events, but vegetable prices and fuel prices fell. Core CPI, which excludes fruits, vegetables, and energy prices, increased 0.16 percent on the month in September after falling 0.17 percent in August, with the year-over-year increase down slightly from 1.80 percent to 1.79 percent. Taiwan's headline consumer price index rose 0.11 percent on the month in September after an increase of 0.40 percent in August, with the year-over-year increase moderating from 2.36 percent to 1.82 percent. Fruit prices rose strongly on the month after extreme weather events, but vegetable prices and fuel prices fell. Core CPI, which excludes fruits, vegetables, and energy prices, increased 0.16 percent on the month in September after falling 0.17 percent in August, with the year-over-year increase down slightly from 1.80 percent to 1.79 percent.
The Central Bank of the Republic of China (Taiwan) left its main policy rate unchanged at 2.00 percent at its quarterly policy meeting mid-September. Officials remain confident that price pressures will moderate in the near-term, revising their forecast for annual headline inflation in 2024 from 2.12 percent to 2.16 percent and their forecast for annual core inflation from 2.00 percent to 1.94 percent. They expect further moderation in 2025, forecasting headline CPI inflation to fall to 1.89 percent and core CPI inflation to fall to 1.79 percent. Reflecting this assessment, officials concluded that policy settings remained appropriate. The next policy meeting will be held in December.
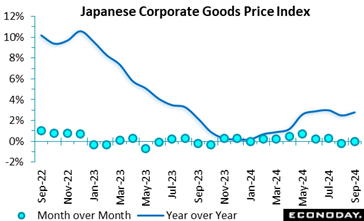 Producer inflation in Japan unexpectedly accelerated to 2.8% in September from a revised 2.6% in August, led by a 12.4% jump in agriculture, forestry and fishery products vs. a 5.4% increase the previous month amid a serious rice supply shortage across the country. Producer inflation in Japan unexpectedly accelerated to 2.8% in September from a revised 2.6% in August, led by a 12.4% jump in agriculture, forestry and fishery products vs. a 5.4% increase the previous month amid a serious rice supply shortage across the country.
The government temporarily revived utility subsides to cap energy costs during Japan's dangerously hot summer and warm autumn, resulting in a slower 7.9% rise in utilities in September, compared to a 10.5% gain in August. The data also showed more stable costs for iron/steel, up 0.2% after a 0.2% dip and a 1.3% rebound in the prices for refined petroleum products following a 3.8% fall. Some items had driven business prices lower until recently in payback for the pandemic spike that was triggered by the global supply chain breakdown and heightened geopolitical risks.
On the month, the corporate goods price index (CGPI) was unchanged after a 0.2% drop. Higher prices for farm produce (partly due to a rice supply shortage), fuels and tires were offset by lower costs for utilities, scrap and non-ferrous metals.
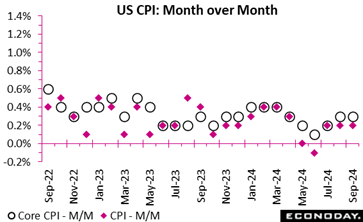 The September consumer price index (CPI) is up 0.2 percent month-over-month and up 2.4 percent year-over-year. The increases are a tick above the consensus in the Econoday survey of forecasters of up 0.1 percent and up 2.3 percent, respectively. The September core CPI is up 0.3 percent month-over-month and up 3.3 percent year-over-year. These are also a tenth above the Econoday survey consensus of up 0.2 percent and up 3.2 percent, respectively. The September consumer price index (CPI) is up 0.2 percent month-over-month and up 2.4 percent year-over-year. The increases are a tick above the consensus in the Econoday survey of forecasters of up 0.1 percent and up 2.3 percent, respectively. The September core CPI is up 0.3 percent month-over-month and up 3.3 percent year-over-year. These are also a tenth above the Econoday survey consensus of up 0.2 percent and up 3.2 percent, respectively.
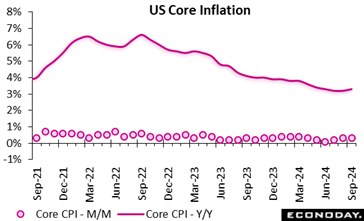 The slightly above expectations headlines for September do not change the outlook for Fed monetary policy. The year-over-year pace of increases to the all-items CPI are still on the decline. The year-over-year increase in September is below the 2.5 percent in August. On the other hand, the core CPI is a tad higher than the 3.2 percent year-over-year rise in August, and has been essentially unchanged for the past four months. Persistent upward price pressures at the core level continue to be driven by services while commodities costs are on the decline. The slightly above expectations headlines for September do not change the outlook for Fed monetary policy. The year-over-year pace of increases to the all-items CPI are still on the decline. The year-over-year increase in September is below the 2.5 percent in August. On the other hand, the core CPI is a tad higher than the 3.2 percent year-over-year rise in August, and has been essentially unchanged for the past four months. Persistent upward price pressures at the core level continue to be driven by services while commodities costs are on the decline.
Food and beverage prices are up 0.4 percent in September from August and up 2.2 percent year-over-year. Prices are up 0.8 percent for meats, poultry, fish, and eggs and up 0.9 percent for fruits and vegetables.
Energy prices are down 1.9 percent in September and down 6.8 percent from a year ago. Much of the decrease is from a 4.1 percent decline in gasoline prices.
Sources of upward price pressure at the core level include increasing medical care costs at up 0.4 percent in September, although prescription drug prices are down 0.5 percent. Insurance prices are also increasing. Motor vehicle insurance is up 1.2 percent in September and health insurance is up 0.4 percent. The introduction of fall merchandise may be behind the 1.1 percent increase in apparel costs.
Shelter costs – which account for a little more than 1/3 of the CPI basket – are up 0.2 percent in September and up 4.9 percent from September 2023. Rents and owners' equivalent rate are both up 0.3 percent from the prior month. Shelter costs are coming down incrementally on a year-over-year basis with August at up 4.8 percent and July at up 4.9 percent. However, it remains a major source of inflation.
Commodities prices are down 0.2 percent in September from August and down 1.3 percent year-over-year. Services prices are up 0.4 percent in September from the prior month and up 4.7 percent year-over-year. The special aggregate CPI for services excluding rent of shelter is up 0.6 percent in September month-over-month and up 4.4 percent from a year ago.
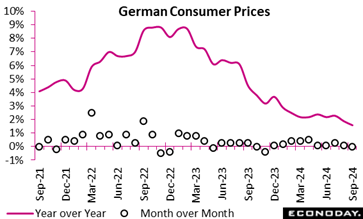 The provisional CPI data were unrevised, leaving the yearly inflation rate at 1.6 percent, down from 1.9 percent in August and its lowest reading since February 2021. Prices were unchanged on the month. The provisional CPI data were unrevised, leaving the yearly inflation rate at 1.6 percent, down from 1.9 percent in August and its lowest reading since February 2021. Prices were unchanged on the month.
The annual increase of the harmonised index of consumer prices was at 1.8 percent, down from 2.0 percent in August and also its weakest print since February 2021. Prices dipped 0.1 percent on the month.
Core CPI inflation, which excludes volatile food and energy prices, was similarly unrevised at 2.7 percent, a tick below its final August mark but still supported by a strong service sector rate (3.8 percent after 3.9 percent).
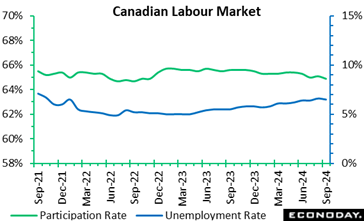 Employment rose by 47,000 or a mere 0.2 percent in September from August to easily top Econoday's consensus for a 35,000 gain. The unemployment rate dipped to 6.5 percent in September from 6.6 percent in August. Forecasters looked for unemployment to remain at 6.6 percent in September. On a year-over-year basis, the unemployment rate was up by 0.9 percentage points in September. Employment rose by 47,000 or a mere 0.2 percent in September from August to easily top Econoday's consensus for a 35,000 gain. The unemployment rate dipped to 6.5 percent in September from 6.6 percent in August. Forecasters looked for unemployment to remain at 6.6 percent in September. On a year-over-year basis, the unemployment rate was up by 0.9 percentage points in September.
September's decline in the jobless rate was the first decline since January.
The participation rate fell to 64.9 percent from 65.1 percent in August and versus 65.0 percent in July. The July participation rate was the lowest since June 1998, excluding the pandemic period.
Total hours worked fell 0.4 percent in September but are up 1.2 percent compared with September 2023. Average hourly wages among employees increased 4.6 percent on an annual basis in September, following a 5 percent jump in August.
Employment rose in the information, culture and recreation industry by 22,000 (up 2.6 percent) in September, following seven months of little change. On an annual basis, employment in the industry was up 3.1 percent (+26,000).
In wholesale and retail trade, employment rose 22,000 in September, the first increase since January. However, employment in wholesale and retail trade has generally trended down since August 2023, falling 3.2 percent over the period.
In professional, scientific and technical services, employment increased 1.1 percent in September, offsetting August's 0.8 percent decline. Compared with the same month a year ago, employment in the industry was up by 3.1 percent.
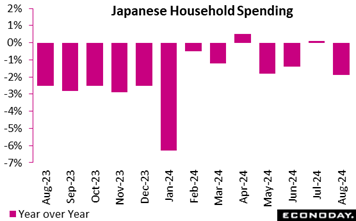 Japan's real household spending fell 1.9% on year in August, after edging up 0.1% in July and falling 1.4% in June, as consumers remain generally frugal amid rising costs for necessities and a powerful typhoon and rainstorms forced some stores to close. Japan's real household spending fell 1.9% on year in August, after edging up 0.1% in July and falling 1.4% in June, as consumers remain generally frugal amid rising costs for necessities and a powerful typhoon and rainstorms forced some stores to close.
The decline was smaller than the median economist forecast of a 2.7% drop and it was mainly caused by volatile factors of vehicle purchases and spending on home repairs and maintenance, which pulled down overall spending by a combined 2.49 percentage points. A pullback in domestic and overseas package tours also made a negative 0.51-point contribution.
Those factors were partly offset by continued solid expenditures on eating out at bars and Japanese restaurants, which pushed up overall spending by 0.58 point, and slightly more generous post-pandemic spending on weddings and funerals (+0.53 point). People also paid more on rice and cup noodles amid a rare rice supply shortage in Japan.
The core measure of real average household spending (excluding housing, motor vehicles and remittance), a key indicator used in GDP calculation, was nearly flat, down just 0.1% after dipping 0.8% in July and rising 1.3% in June for the first increase in 16 months.
On the month, real average expenditures by households with two or more people rebounded 2.0% in payback for a 1.7% plunge in July, when the killer heat wave intensified. It came in much stronger that the consensus call of a 0.5% gain.
The average real income of households with salaried workers rose 2.0% in August for the fourth straight year-on-year gain after rising 5.5% in July and 3.1% in June. In nominal terms, the average income grew 5.6% following increases of 8.1% in July and 6.5% in the prior month. This continues to indicate that a high pace of wage growth by Japanese standards is spreading to smaller firms that employ about 70% of the workforce.
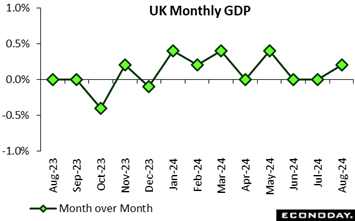 Real GDP rose a modest, but as expected, 0.2 percent on the month in August following stagnation in both June and July. The increase was predominantly driven by a 0.5 percent increase in production output and a 0.4 percent increase in construction, which rebounded from a 0.4 percent decline in July. Services were up a marginal 0.1 percent. Real GDP rose a modest, but as expected, 0.2 percent on the month in August following stagnation in both June and July. The increase was predominantly driven by a 0.5 percent increase in production output and a 0.4 percent increase in construction, which rebounded from a 0.4 percent decline in July. Services were up a marginal 0.1 percent.
For the three-months to August, GDP also increased 0.2 percent versus the previous period. Services continued to be a significant factor in the overall growth, albeit at a lethargic pace, contributing 0.1 percent. Meanwhile, construction saw a robust 1.0 percent gain while goods production was only flat.
The data show promising signs of recovery in the construction and production sectors but more broadly growth remains driven by services.
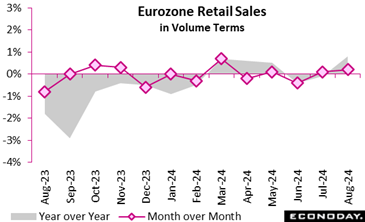 Retail sales rose 0.2 percent on the month in August, just short of the market consensus and, following a small downward revision to July, their first increase since May's minimal 0.1 percent advance. Flattered by positive base effects, annual growth now stands at 0.8 percent, up from minus 0.1 percent last time. Retail sales rose 0.2 percent on the month in August, just short of the market consensus and, following a small downward revision to July, their first increase since May's minimal 0.1 percent advance. Flattered by positive base effects, annual growth now stands at 0.8 percent, up from minus 0.1 percent last time.
August's modest monthly gain was roughly evenly split between food, drink and tobacco (0.2 percent) and non-food, excluding auto fuel (0.3 percent). This was the latter's first rise since April.
Regionally, both France (0.5 percent) and Spain (0.4 percent) recorded fresh increases while Italy was only flat. Note that German data, currently still unavailable, are due for release next week.
The August report puts average Eurozone sales volumes in the first two months of the quarter 0.1 percent below their mean level in the April-June period. This means that, absent any revisions, September will need a monthly increase of at least 0.3 percent just to hold the third quarter flat. Accordingly, retail sales continue to trend largely sideways, providing minimal support to economic growth and strengthening the argument for another cut in ECB interest rates next week.
 The delayed sales data show a 1.4 percent monthly decline in volumes in May, underlining the weakness of household spending. Data from June to August have also been released. The delayed sales data show a 1.4 percent monthly decline in volumes in May, underlining the weakness of household spending. Data from June to August have also been released.
The delayed sales data show a 1.1 percent monthly decline in volumes in June which, following a steeper 1.4 percent drop in May, simply underline the weakness of household spending. Data for July and August have also been released.
The delayed sales data show a tidy 1.5 percent monthly increase in volumes in July but this only partially reverses the cumulative 2.5 percent fall recorded in May/June. Household spending remains weak. Data for August have also been released.
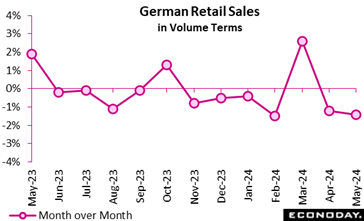
Real and nominal sales rose 1.6 percent month-over-month in August, growing slightly more than July's 1.5 percent. The growth over the last two months indicates recovery from the prior two months which showed 1.4 percent and 1.1 percent declines in May and June respectively.
Real retail sales increased by 2.1 percent in comparison to August 2023, while nominal sales increased by 3.1 percent, suggesting that inflation had a bearing on pricing. Food retail sales saw robust growth, increasing by 1.9 percent month-over-month and 2.4 percent year-over-year. Growth in the non-food sector was more modest, with a 1.1 percent monthly increase and a 1.2 percent annual increase.
Furthermore, online and mail-order retail rose 8.9 percent from July 2024 and 10.8 percent year-over-year, underscoring the increasing importance of e-commerce. The return to consistent data provision, which is crucial for the monitoring of economic trends, is marked by the resumption of regular retail sales reporting following IT disruptions earlier in the year. This latest report implies that consumer spending may be starting to recover although confidence remains weak.
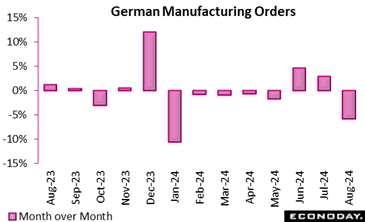 The manufacturing sector saw new orders in August decline by a much steeper than expected 5.8 percent on the month and by 4.0 percent on an annual basis. The monthly decrease followed a revised increase of 3.9 percent in July, which had been supplemented by substantial orders for transport equipment, such as military vehicles, ships, and aircraft. The fall in August is more modest at 3.4 percent when these large-scale orders are excluded. The manufacturing sector saw new orders in August decline by a much steeper than expected 5.8 percent on the month and by 4.0 percent on an annual basis. The monthly decrease followed a revised increase of 3.9 percent in July, which had been supplemented by substantial orders for transport equipment, such as military vehicles, ships, and aircraft. The fall in August is more modest at 3.4 percent when these large-scale orders are excluded.
Capital goods posted the most significant decline, with a drop of fully 8.6 percent. Intermediate goods were down 2.2 percent and consumer goods 0.9 percent. Domestic orders slumped 10.9 percent and the overall slide would have been sharper but for foreign demand which, outside the euro area, increased 3.4 percent. Turnover in August increased 3.2 percent but only due to a further drop in backlogs.
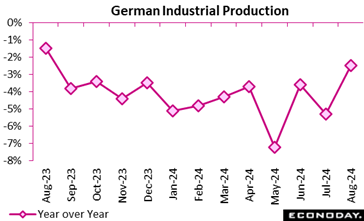 Industrial production was surprisingly robust in August, increasing by 2.9 percent from the previous month, after a revised 2.9 percent decline in July. However, this growth is significant, production is still 2.5 percent lower than it was in August 2023. The automotive industry substantially contributed to this rebound, exhibiting a 19.3 percent increase in output following an 8.2 percent decline in July. Industrial production was surprisingly robust in August, increasing by 2.9 percent from the previous month, after a revised 2.9 percent decline in July. However, this growth is significant, production is still 2.5 percent lower than it was in August 2023. The automotive industry substantially contributed to this rebound, exhibiting a 19.3 percent increase in output following an 8.2 percent decline in July.
Capital goods production output was up 6.9 percent, while manufacturing, which excludes energy and construction, rose 3.4 percent. Consumer products remained constant but construction and energy also made modest contributions, with gains of 0.3 percent and 2.3 percent respectively.
Looking through the volatility, the 3-monthly change stands at minus 1.3 percent and so continues to show underlying weakness.
 Industrial production edged up 0.1 percent on the month in August, slightly undershooting expectations. Although capital goods and intermediate goods fell 2.5 percent and 2.8 percent respectively, this was offset by a rise in energy (2.3 percent) and consumer goods (2.8 percent). Industrial production edged up 0.1 percent on the month in August, slightly undershooting expectations. Although capital goods and intermediate goods fell 2.5 percent and 2.8 percent respectively, this was offset by a rise in energy (2.3 percent) and consumer goods (2.8 percent).
Year-over-year, intermediate goods and capital goods were particularly weak with falls of 7.2 percent and 7.3 percent respectively, making for a headline drop of 3.2 percent. By contrast, energy rose 6.0 percent.
In sum, goods production remains soft with a recovery that is both uneven and fragile.
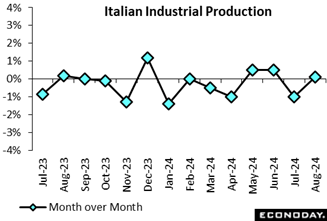
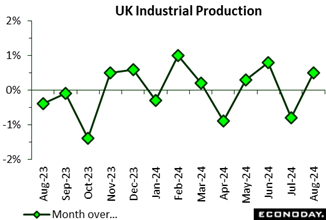 Industrial production rose 0.5 percent on the month in August, a welcome recovery, following a minor revised decline of 0.7 percent in July and slightly stronger than the market consensus. Manufacturing was instrumental in the expansion, with a 1.1 percent increase, primarily due to the gains in critical subsectors such as basic metals and transport equipment, where output rose 2.1 percent and 2.3 percent respectively. Industrial production rose 0.5 percent on the month in August, a welcome recovery, following a minor revised decline of 0.7 percent in July and slightly stronger than the market consensus. Manufacturing was instrumental in the expansion, with a 1.1 percent increase, primarily due to the gains in critical subsectors such as basic metals and transport equipment, where output rose 2.1 percent and 2.3 percent respectively.
Overall goods production was also boosted by electricity and gas which increased by 1.2 percent and water supply and sewerage which rose 1.5 percent. Nevertheless, the mining and quarrying industries contracted 4.0 percent with crude petroleum and natural gas extraction down 4.2 percent, the most precipitous decline since January 2023.
The broader three-month period to August showed no change in overall output. Manufacturing, water supply, and sewerage demonstrated resilience, with respective increases of 0.5 percent and 0.3 percent but these gains were counterbalanced by declines in electricity and gas.
The divergence in sector performance highlights a mixed economic landscape, where industrial growth heavily relies on specific sectors while the others face persistent challenges.
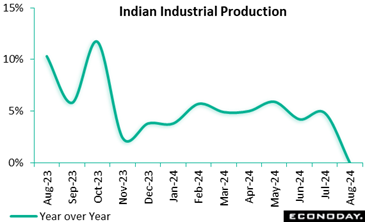 India's index of industrial production fell 0.1 percent on the year in August, weakening sharply from growth of 4.8 percent in July. Within the industrial sector, manufacturing output advanced 1.0 percent on the year after an increase of 4.6 percent previously. More up-to-date PMI survey data published previously indicated that month-over-month growth in the manufacturing sector moderated in August and then slowed further in September. Mining and electricity output fell 4.3 percent and 3.7 percent on the year respectively in August. India's index of industrial production fell 0.1 percent on the year in August, weakening sharply from growth of 4.8 percent in July. Within the industrial sector, manufacturing output advanced 1.0 percent on the year after an increase of 4.6 percent previously. More up-to-date PMI survey data published previously indicated that month-over-month growth in the manufacturing sector moderated in August and then slowed further in September. Mining and electricity output fell 4.3 percent and 3.7 percent on the year respectively in August.
The Reserve Bank of India again left policy rates on hold at 6.50 percent at their most recent meeting held earlier in the week, with officials expressing confidence in the resilience of economic activity. Officials also advised that they are shifting their policy stance from "the withdrawal of accommodation" to "neutral". This, they judge, will provide them with greater flexibility in upcoming meetings while enabling them to continue monitoring the path of disinflation.
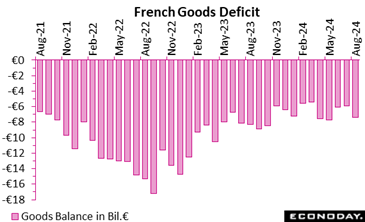 In August, France's trade balance continued its downward trajectory, with the deficit increasing by €1.3 billion to reach €7.37 billion. The increase was driven primarily by a larger drop in exports (€0.3 billion) compared to imports (€0.1 billion). This left exports at €49.6 billion and imports at €56.0 billion. In August, France's trade balance continued its downward trajectory, with the deficit increasing by €1.3 billion to reach €7.37 billion. The increase was driven primarily by a larger drop in exports (€0.3 billion) compared to imports (€0.1 billion). This left exports at €49.6 billion and imports at €56.0 billion.
The energy sector balance improved by €0.4 billion, continuing its upward trend, but gains here were overshadowed by worsening balances in other sectors. Investment goods saw a decline of €0.3 billion, consumption goods €0.2 billion, and intermediate goods €0.1 billion. Nevertheless, consumer goods provided a silver lining, maintaining a surplus, a trend that has held strong since November 2023.
Still, the overall picture suggests growing challenges for France's trade, especially in areas like investment and intermediate goods.
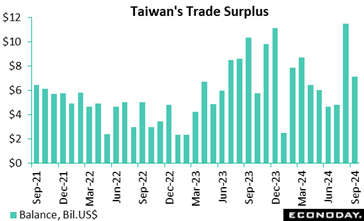 Taiwan's trade surplus narrowed from $11.49 billion in August to $7.12 billion in September. Exports rose 4.5 percent after increasing 16.8 percent previously, while imports rose 17.3 percent after a previous increase of 11.8 percent. Taiwan's trade surplus narrowed from $11.49 billion in August to $7.12 billion in September. Exports rose 4.5 percent after increasing 16.8 percent previously, while imports rose 17.3 percent after a previous increase of 11.8 percent.
The moderation in headline growth in exports was largely driven by markedly less pronounced strength in exports of information, communication and audio-video products, up 24.8 percent on the year after advancing 71.3 percent previously, with year-over-year growth in exports of electronic components picking up from 0.1 percent to 4.9 percent. Exports to the United States increased 27.3 percent on the year, while exports to mainland China and Hong Kong rose 1.7 percent. Petroleum imports fell 15.0 percent on the year, while imports from mainland China and Hong Kong recorded solid growth of 7.5 percent.
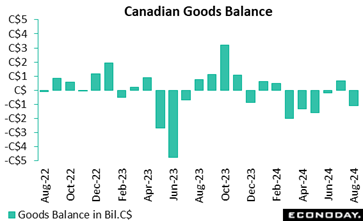 Canada's goods trade picture looked worse than expected in August and was revised into deficit for July. With the July revision, Canada saw a sixth consecutive trade shortfall in August. Canada's goods trade picture looked worse than expected in August and was revised into deficit for July. With the July revision, Canada saw a sixth consecutive trade shortfall in August.
The trade balance showed a deficit of C$1.1 billion in August after a revised deficit of C$0.287 billion in July (July was previously reported at a C$0.684 billion surplus). Forecasters in an Econoday survey looked for a modest deficit of C$0.1 billion for August.
Imports rose by 0.3 percent on the month in August and were up by 1.6 percent on the year. Exports slipped 1.0 percent on the month and were down 0.5 percent on the year. In real or volume terms, exports edged up 0.1 percent on the month, as lower prices for oil exports weighed heavily on the nominal value of exports. Imports rebounded in August from July after falling 1.4 percent in July from June. In real terms, imports rose 0.4 percent in August from July.
Exports to the US dropped by 4.3 percent in August, partly due to lower exports of energy products. Meanwhile, imports from the US were up 0.9 percent. As a result, Canada's goods trade surplus with the United States narrowed from $10.5 billion in July to $8.0 billion in August.
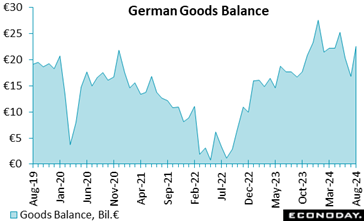 Germany's trade performance was mixed in the month of August. Exports rose modestly by 1.3 percent from the previous month to €131.9 billion, reflecting a minor 0.1 percent growth year-over-year. In contrast, imports saw a sharp decline, falling by 3.4 percent month-over-month to €109.4 billion and down 3.1 percent from August 2023. These movements led to a trade surplus of seasonally adjusted €22.5 billion, well above the market consensus and a significant increase compared to both July 2024 (€16.9 billion) and August 2023 (€18.9 billion). Germany's trade performance was mixed in the month of August. Exports rose modestly by 1.3 percent from the previous month to €131.9 billion, reflecting a minor 0.1 percent growth year-over-year. In contrast, imports saw a sharp decline, falling by 3.4 percent month-over-month to €109.4 billion and down 3.1 percent from August 2023. These movements led to a trade surplus of seasonally adjusted €22.5 billion, well above the market consensus and a significant increase compared to both July 2024 (€16.9 billion) and August 2023 (€18.9 billion).
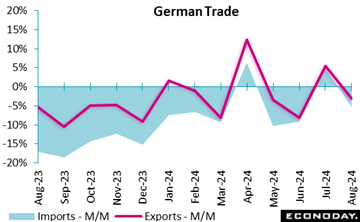 Trade with the EU showed positive growth in exports (0.8 percent), while imports fell (minus 3.7 percent). Notably, exports to the United States surged by 5.5 percent, while exports to China rose by 1.9 percent. Imports from China remained dominant but declined by 1.4 percent. Trade with Russia continued to drop, with exports down 9.5 percent from July 2024 and 11.8 percent compared to the same period in 2023, largely reflecting ongoing geopolitical tensions. Trade with the EU showed positive growth in exports (0.8 percent), while imports fell (minus 3.7 percent). Notably, exports to the United States surged by 5.5 percent, while exports to China rose by 1.9 percent. Imports from China remained dominant but declined by 1.4 percent. Trade with Russia continued to drop, with exports down 9.5 percent from July 2024 and 11.8 percent compared to the same period in 2023, largely reflecting ongoing geopolitical tensions.
Overall, exports have increased in the last two months but only after back to back falls and the July/August average is still 0.9 percent short of the second quarter mean (and even further below the first quarter). Today's update leaves the RPI at 14 and RPI-P at 25, meaning that economic activity in general is outperforming the market consensus.
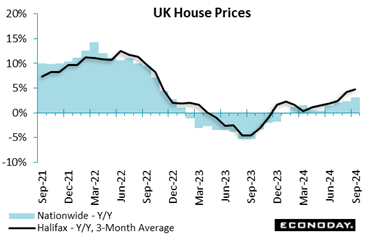 The housing market made further ground in September with house prices rising for the third consecutive month, up by 0.3 percent versus August. Although this represents a substantial annual increase of 4.7 percent and the average property price reaching £293,399, this increase is predominantly due to a rebound from previous losses. Prices have increased by only 0.4 percent over the past two years, indicating more moderate long-term growth. The housing market made further ground in September with house prices rising for the third consecutive month, up by 0.3 percent versus August. Although this represents a substantial annual increase of 4.7 percent and the average property price reaching £293,399, this increase is predominantly due to a rebound from previous losses. Prices have increased by only 0.4 percent over the past two years, indicating more moderate long-term growth.
Buyer confidence has been boosted by the decline in interest rates and robust wage growth. Mortgage agreements have increased by more than 40 percent in the past year, marking the highest figure since July 2022 and reflecting improved affordability. Nevertheless, the market remains burdened by the broader affordability crisis.
The Halifax sees property price growth remaining moderate over coming months due to rising living expenses. The outlook remains cautiously optimistic, with the potential for additional support for purchasers from anticipated further reductions in interest rates.
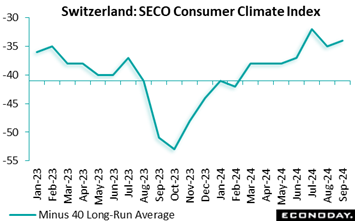 Consumer sentiment improved just marginally and by less than expected in September. At minus 34, the unadjusted headline index was up just a point versus August and a point short of the market consensus. However, it was fully 17 points stronger than a year ago and also well above its minus 40 long-run average. Consumer sentiment improved just marginally and by less than expected in September. At minus 34, the unadjusted headline index was up just a point versus August and a point short of the market consensus. However, it was fully 17 points stronger than a year ago and also well above its minus 40 long-run average.
The minimal monthly gain was largely due to a better economic outlook (minus 19 after minus 22) and stronger spending intentions (minus 29 after minus 32). However, the financial outlook worsened (minus 33 after minus 31) and job security deteriorated significantly (minus 31 after minus 22) although the latter was probably only due to seasonal factors. Elsewhere of note, 1-year ahead inflation expectations (95 after 97) hit a new series low.
Today's report leaves a gently improving profile to consumer confidence - at minus 34, the third quarter average was up 4 points versus the previous period. This points to a possible pick-up in household spending to come, albeit likely not to the extent that would dampen speculation about another cut in the SNB's policy rate in December.
Econoday’s Relative Economic Performance Index (RPI) remained sub-zero last week. At minus 14, the current reading signals recent global economic activity slightly lagging despite limited positive contributions from the U.S., UK and Japan.
With the notable exception of inflation, last week’s U.S. economic data were mainly a little softer than forecast. However, in terms of the big picture, the RPI (3) remained just above zero while the RPI-P (exactly zero) showed real side activity moving bang in line with forecasts. As such, the odds would seem to remain against a second successive 50 basis point cut by the Federal Reserve in November.
In Canada, an unexpectedly firm September employment report saw the RPI close out the week at minus 9, indicating just very modestly underperforming economic activity. Forecasters are split over whether the Bank of Canada will cut interest rates by 25 basis points or a full 50 basis points next week but Wednesday’s September CPI report should make the outlook a little clearer.
In the Eurozone, economic data continue to add to pressure on the European Central Bank to cut key interest rates again on Thursday. At minus 9 and minus 1 respectively, the region’s RPI and RPI-P are only just in negative surprise territory but activity has fallen short of expectations for almost the entire period since the September policy announcement.
In the UK, Friday’s data basket was strong enough to keep both the RPI (23) and RPI-P (22) clearly above zero. Current readings reduce pressure on the Bank of England to lower Bank Rate again next month but this week’s key CPI and labour market reports could easily change all that.
At exactly zero, the Swiss RPI shows recent economic activity matching market expectations although the RPI-P (17) remains quite well above zero. The difference between the two continues to reflect downside surprises on inflation, ensuring that speculation about the Swiss National Bank easing again in December remains very much alive.
In Japan, unexpectedly firm household spending and pipeline inflation kept the RPI (9) and RPI-P (18) above zero. The general election later this month has dampened speculation about the Bank of Japan tightening in October but, on current trends, a move in December remains a real possibility.
There were no important Chinese releases last week, leaving both the RPI and RPI-P at a lowly minus 50. Despite the central bank’s sizeable monetary stimulus in late September, such readings may well mean that the disappointingly limited fiscal package announced by the government last week will have to be bolstered.
**Contributing to this article were Jeremy Hawkins, Brian Jackson, Mace News, Max Sato, Olajide Oyadeyi, and Theresa Sheehan
Canadian consumer prices on Tuesday are expected to break lower to a below-target 1.9 percent. UK consumer prices on Wednesday are expected to post a 1.9 percent year-on-year rise for September, down a tick from August’s 2.0 percent.
The big report in the week is the September data on retail and food services sales on Thursday. There’s room for a few surprises in the numbers, but a lot could depend on how much of the underlying information came in from storm-affected areas in the days before and after Hurricane Helene made landfall on September 26. It is late enough in the month that effects may have to wait for the revisions when the October report is issued on Friday, November 15.
At the moment, rising motor vehicle sales and falling gasoline prices are two factors that are moving in opposite directions. There is likely to be an increase in the dollar value of motor vehicle sales both on units sold and prices paid. Gasoline prices fell fairly steadily over the course of September which in turn could reduce the dollar value of sales even if the volume of sales increased. Elsewhere, storm preparations could mean a boost for sales of building materials, nonperishable food and bottled water, and emergency supplies like ice, batteries, and generators. Demand could have been higher both before and after the storm hit.
Also on Thursday is the October housing market index from the NAHB. Homebuilders’ confidence started to recover in September with steep declines in mortgage rates. At the start of September the weekly Freddie Mac rate for a 30-year fixed-rate mortgage was 6.35 percent and fell to 6.08 percent by late in the month. However, some of that was due to a reaction to the FOMC cutting the fed funds target rate range by an aggressive 50 basis points on September 18. Markets are now less giddy about future rate cuts since the release of the solid September employment report on October 4. The October NAHB report could reflect homebuilders’ renewed caution about the outlook for much of the new home construction market. However, it may also capture some expectation of a need for replacing destroyed housing stock after the hurricanes.
China Merchandise Trade for September (Mon xx CST; Mon -8 hours GMT; Sun -12 hours EDT)
Consensus Forecast, Balance: 90.5 B
Consensus Range, Balance: 88.5 B to 91.4 B
Consensus Forecast, Exports – Y/Y: 6.0%
Consensus Range, Exports – Y/Y: 5.2% to 6.0%
The merchandise trade surplus is expected to hold roughly steady at $90.5 billion in September from $91.0 billion in August with imports up 0.5 percent and exports rising 6.0 percent on the year.
India Wholesale Price Index for September (Mon 1200 IST; Mon 0630 GMT; Mon 0230 EDT)
Consensus Forecast, Y/Y: 2.0%
Consensus Range, Y/Y: 1.9% to 2.0%
India’s annual wholesale price inflation is estimated to bounce back to 2.0 percent in September after falling more than expected to 1.31 percent in August, a four-month low, amid declining commodities prices.
India CPI for September (Mon 1730 IST; Mon 1200 GMT; Mon 0800 EDT)
Consensus Forecast, Y/Y: 5.0%
Consensus Range, Y/Y: 5.0% to 5.1%
Rebounding food prices are expected to lift India’s consumer price index to a 5.0 percent increase on year in September after a modest 3.65 percent rise in August.
UK Labour Market Report for September (Tue 0700 BST; Tue 0600 GMT; Tue 0200 EDT)
Consensus Forecast, ILO Unemployment Rate: 4.1%
Consensus Range, ILO Unemployment Rate: 4.1% to 4.2%
The UK ILO unemployment rate is expected unchanged in September from August’s 4.1 percent. Average earnings including bonus are expected up 3.8 percent on year, down from 4.0 percent in August.
Eurozone Industrial Production for August (Tue 1100 CEST; Mon 0900 GMT; Mon 0500 EDT)
Consensus Forecast, M/M: 1.2%
Consensus Range, M/M: -0.2% to 1.5%
Eurozone industrial production is expected to rebound by 1.2 percent on the month in August after July’s fall of 0.3 percent.
Canada CPI for September (Tue 0830 EDT; Tue 1230 GMT)
Consensus Forecast, CPI – M/M: -0.3%
Consensus Range, CPI – M/M: -0.4% to -0.1%
Consensus Forecast, CPI – Y/Y: 1.9%
Consensus Range, CPI – Y/Y: 1.7% to 2.0%
Declining energy prices are expected to depress Canada’s annual headline inflation rate below 2 percent in September. CPI is seen down 0.3 percent on the month and up 1.9 percent on the year.
US Empire State Manufacturing Index for October (Tue 0830 EDT; Tue 1230 GMT)
Consensus Forecast, Index: 0.0%
Consensus Range, Index: -5.9% to 3.5%
After a surprising jump in manufacturing business activity in September, the index is expected to fall back to earth in October with the index at 0, down from 11.5 in September and compared with minus 4.7 in August.
New Zealand CPI for Q3 (Wed 1045 NZDT; Wed 2145 GMT; Wed 1745 EDT)
Consensus Forecast, Quarter over Quarter: 0.7%
Consensus Range, Quarter over Quarter: 0.7% to 0.8%
New Zealand’s consumer price index is expected up 0.7 percent in the third quarter after rising 0.4 percent in the second quarter. Year over year it is estimated up 2.2 percent after rising 3.3 percent last quarter.
UK CPI for September (Wed 0700 BST; Wed 0600 GMT; Wed 0200 EDT)
Consensus Forecast, M/M: 0.2%
Consensus Range, M/M: 0.2% to 0.3%
Consensus Forecast, Y/Y: 1.9%
Consensus Range, Y/Y: 1.9% to 2.0%
The consumer price index is expected up 0.2 percent on the month and 1.9 percent on the year after rising 0.3 percent month over month in August and 2.2 percent year over year.
Canada Housing Starts for September (Wed 0815 EDT; Wed 1215 GMT)
Consensus Forecast, Annual Rate: 226.0
Consensus Range, Annual Rate: 225.0 to 264.0
Forecasters see housing starts improving to an annual rate of 226,000 after dropping to 217,405 in August as loosening credit conditions are expected to provide support.
Canada Manufacturing Sales for August (Wed 0830 EDT; Wed 1230 GMT)
Consensus Forecast, M/M: -1.5%
Consensus Range, M/M: -1.5% to -1.5%
Manufacturing sales expected to fall 1.5 percent, in line with the Stats Can preliminary estimate, after rising 1.4 percent in July.
US Imports and Export Prices for September (Tue 0830 EDT; Tue 1230 GMT)
Consensus Forecast, Import Prices – M/M: -0.3%
Consensus Range, Import Prices – M/M: -0.6% to 0.3%
Consensus Forecast, Export Prices – M/M: -0.4%
Consensus Range, Export Prices – M/M: -0.7% to -0.1%
Import prices are seen down 0.3 percent and export prices down 0.4 percent on the month.
Australia Labour Force Survey for September (Thu 1130 AEDT; Thu 0030 GMT; Wed 2030 EDT)
Consensus Forecast, Unemployment Rate: 4.2%
Consensus Range, Unemployment Rate: 4.1% to 4.2%
Consensus Forecast, Employment – M/M: 23.7
Consensus Range, Employment – M/M: 10.0 to 45.0
Australia employment is expected to rise by 23,700 on the month after August’s strong rise of 47,500. Unemployment rate on the other hand is expected to hold steady at 4.2 percent in September.
Germany ZEW Survey for October (Thu 1100 CEST; Thu 0900 GMT; Thu 0500 EDT)
Consensus Forecast, Economic Sentiment: 4.7
Consensus Range, Economic Sentiment: -1.0 to 10.0
Germany’s current economic situation index is expected to remain depressed at minus 85.0 after falling to a dismal minus 84.5 in September.
Eurozone HICP for September (Thu 1100 CEST; Thu 0900 GMT; Thu 0500 EDT)
Consensus Forecast, HICP – Y/Y: 1.8%
Consensus Range, HICP – Y/Y: 1.8% to 1.8%
Consensus Forecast, Narrow Core – Y/Y: 2.7%
Consensus Range, Narrow Core – Y/Y: 2.7% to 2.7%
Forecasters see HICP down 0.1 percent on the month and unrevised at 1.8 percent on year. Core HICP is seen unrevised at 2.7 percent on year.
US Jobless Claims (Thu 0830 EDT; Thu 1230 GMT)
Consensus Forecast, Initial Claims – Level: 257.0
Consensus Range, Initial Claims – Level: 230.0 to 275.0
Claims are expected to remain elevated at 257,000 after their unexpected jump to 258,000 last week. BLS said Hurricane Helene and strike activity skewed last week’s number higher but markets are on alert for other signs of fragility in the labor market.
US Retail Sales for September (Thu 0830 EDT; Thu 1230 GMT)
Consensus Forecast, Retail Sales – M/M: 0.3%
Consensus Range, Retail Sales – M/M: 0.2% to 0.5%
Consensus Forecast, Ex-Vehicles – M/M: 0.1%
Consensus Range, Ex-Vehicles – M/M: 0.0% to 0.3%
Consensus Forecast, Ex-Vehicles & Gas – M/M: 0.3%
Consensus Range, Ex-Vehicles & Gas – M/M: 0.1% to 0.3%
Retail sales are expected to show relatively muted gains for September with the headline figure up 0.3 percent and sales ex-autos up a less impressive 0.1 percent. Sales ex-autos and gas are seen up 0.3 percent.
US Philadelphia Fed Manufacturing Index for October (Thu 0830 EDT; Thu 1230 GMT)
Consensus Forecast, Index: 3.0
Consensus Range, Index: 2.9 to 5.0
Philly Fed is expected to eke out another positive showing at 3.0 in October after September’s marginally positive 1.7.
US Industrial Production for September (Thu 0915 EDT; Thu 1315 GMT)
Consensus Forecast, Industrial Production – M/M: -0.1%
Consensus Range, Industrial Production – M/M: -0.2% to 0.1
Consensus Forecast, Manufacturing Output – M/M: -0.2%
Consensus Range, Manufacturing Output – M/M: -0.2% to 0.1
Consensus Forecast, Capacity Utilization Rate: 77.9
Consensus Range, Capacity Utilization Rate: 77.8 to 78.1
The consensus forecast calls for a 0.1 percent decline on the month, in keeping with bleak ISM purchasing managers data showing contraction in the sector. Manufacturing is seen down 0.2 percent on the month and the capacity utilization rate pretty flat at 77.9 percent versus 78.0 in August.
US Business Inventories for August (Thu 1000 EDT; Thu 1400 GMT)
Consensus Forecast, M/M: 0.3%
Consensus Range, M/M: 0.1% to 0.3%
Expectations call for a 0.3 percent rise.
US Housing Market Index for October (Thu 1000 EDT; Thu 1400 GMT)
Consensus Forecast, Index: 42.0
Consensus Range, Index: 42.0 to 43.0
Forecasters expect the index to show continued stabilization at 42 in October, up from 41 in September and 39 in August. The September increase broke a string of four consecutive declines.
China Fixed Asset Investment for September (Fri 1000 CST; Fri 0200 GMT; Thu 2200 EDT)
Consensus Forecast, Y/Y: 3.3%
Consensus Range, Y/Y: 3.3% to 3.4%
Forecasters see fixed asset investment up a modest 3.3 percent on the year as China’s economy remains sluggish and capex constrained.
China GDP for Q3 (Fri 1000 CST; Fri 0200 GMT; Thu 2200 EDT)
Consensus Forecast, Y/Y: 4.6%
Consensus Range, Y/Y: 4.4% to 4.7%
GDP growth on the year is expected to remain stalled at 4.6 percent in the latest reading versus 4.7 percent in the previous report.
China Industrial Production for September (Fri 1000 CST; Fri 0200 GMT; Thu 2200 EDT)
Consensus Forecast, Y/Y: 4.5%
Consensus Range, Y/Y: 4.5% to 4.7%
Forecasters see industrial production showing another gain of 4.5 percent on the year.
China Retail Sale for September (Fri 1000 CST; Fri 0200 GMT; Thu 2200 EDT)
Consensus Forecast, Y/Y: 2.5%
Consensus Range, Y/Y: 2.1% to 2.5%
Forecasters expect a modest improvement in retail sales to 2.5 percent annual growth versus 2.1 percent a month ago.
UK Retail Sale for September (Fri 0700 BST; Fri 0600 GMT; Thu 0200 EDT)
Consensus Forecast, Y/Y: 3.1%
Consensus Range, Y/Y: 1.7% to 4.3%
Expectations center on a decline of 0.4 percent on the month and an increase of 3.1 percent from a year ago.
US Empire Housing Starts and Permits for October (Fri 0830 EDT; Fri 1230 GMT)
Consensus Forecast, Starts – Annual Rate: 1.4 M
Consensus Range, Starts – Annual Rate: 1.3 M to 1.5 M
Consensus Forecast, Permits – Annual Rate: 1.5 M
Consensus Range, Permits – Annual Rate: 1.4 M to 1.5 M
Starts are seen flat at a 1.4 million unit rate from a month ago, and permits steady at the same 1.5 million unit rate.
|
