|
In the October 18 week, the standout was the September numbers on retail and food services sales. While the details of the report present a somewhat mixed picture of spending in the month, overall consumer spending was solid. The report ended the third quarter 2024 on an up note and indicates that personal consumption expenditures will support growth that is likely not far below the up 3.0 percent for GDP in the second quarter. The advance report for third quarter GDP is set for release at 8:30 ET on Wednesday, October 30.
While total retail spending was up 0.4 percent in September, it was restrained by the two most volatile components. Sales of motor vehicles were flat compared to the prior month and gasoline service stations were down 1.6 percent. Excluding motor vehicles and gasoline, sales were up a robust 0.7 percent in September. Other than the declines of 1.4 percent for furniture and 3.3 percent for electronics and appliances – both likely to be from the soft housing market and both likely to rebound in the coming months due to hurricane recovery – most categories of retail spending had at least modest gains.
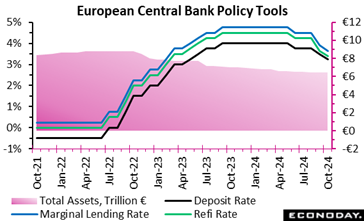 As widely anticipated, the ECB today delivered a second successive cut in key interest rates - its third of the current cycle. Having already reduced the key deposit rate by 25 basis points in September, the central bank repeated the move to leave the benchmark rate at 3.25 percent, matching its lowest level since May last year. The refi rate (3.40 percent) and the rate on the marginal lending facility (3.65 percent) were also cut by the same amount and the loose forward guidance stating that the bank "will keep policy rates sufficiently restrictive for as long as necessary" to achieve the 2 percent inflation target was retained. As widely anticipated, the ECB today delivered a second successive cut in key interest rates - its third of the current cycle. Having already reduced the key deposit rate by 25 basis points in September, the central bank repeated the move to leave the benchmark rate at 3.25 percent, matching its lowest level since May last year. The refi rate (3.40 percent) and the rate on the marginal lending facility (3.65 percent) were also cut by the same amount and the loose forward guidance stating that the bank "will keep policy rates sufficiently restrictive for as long as necessary" to achieve the 2 percent inflation target was retained.
Once again there was nothing new on QT which, since July when the pandemic emergency purchase programme (PEPP) was included alongside the asset purchase programme (APP), has seen net asset sales of around €90 billion. However, there is a still long way to go to shrink the bank's balance sheet back to more normal levels.
The path to the latest ease was effectively cleared by September's surprisingly sharp fall in inflation (revised down to 1.7 percent earlier today). This was the first sub-target reading since June 2021 and although the decline in the core rates has been less marked, these too are moving in the right direction. However, it is unlikely to be all one-way traffic. The ECB expects inflation to rise over coming months before declining to target in the course of next year. It also noted that domestic inflation remains high and wages are still rising at an elevated pace. Still, labour cost pressures are seen easing gradually, with profits partially buffering their impact on prices. Moreover, the Eurozone economy has been both sluggish and weaker than expected. Third quarter growth is unlikely to impress.
The next, and last, ECB meeting of 2024 will be on 12 December and will include the unveiling of an updated set of economic forecasts. Ahead of that, policy will remain data-dependent although financial markets have already priced in another 25 basis point cut. Unless inflation surprises on the upside in the interim, they look likely to be proved right.
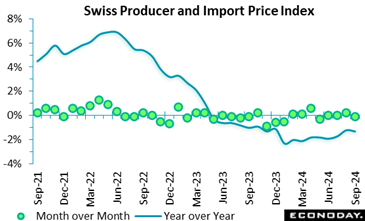 The combined producer and import price index unexpectedly declined in September. Prices were down 0.1 percent on the month, trimming the annual inflation rate from August's minus 1.2 percent to minus 1.3 percent, albeit only a 2-month low. The combined producer and import price index unexpectedly declined in September. Prices were down 0.1 percent on the month, trimming the annual inflation rate from August's minus 1.2 percent to minus 1.3 percent, albeit only a 2-month low.
Domestic prices were flat at their August level, leaving their yearly rate also stable at minus 0.2 percent. Import prices fell 0.4 percent, reducing their annual rate from minus 3.4 percent to minus 3.5 percent.
Within the PPI, the main monthly falls were posted by water supply (minus 2.6 percent), clothing and textiles (minus 1.7 percent) and petroleum products (minus 1.5 percent). However, gains here were offset by generally small rises elsewhere. Import prices were driven lower by petroleum which slumped fully 7.6 percent. As a result, total core prices also dipped a monthly 0.1 percent, a small enough drop to lift the annual underlying rate a tick firmer to minus 1.3 percent.
Accordingly, pipeline price pressures remain soft and will be seen as boosting the chances of another cut in the SNB's policy rate in December.
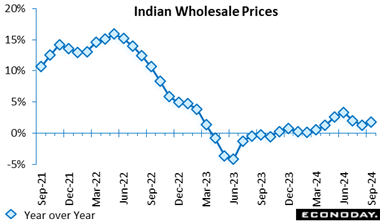 India's wholesale price index rose 1.84 percent on the year in September after increasing 1.31 percent in August. The bigger year-over-year increase in wholesale prices in September was driven by food prices, which account for around 15 percent of the index and are often volatile. These rose 9.47 percent on the year after increasing 3.26 percent previously. Manufacturing prices, around 64 percent of the index, rose 1.00 percent on the year after a previous increase of 1.22 percent, while fuel prices, around 13 percent of the index, fell 4.05 percent on the year, weakening further from the previous increase of 0.67 percent. India's wholesale price index rose 1.84 percent on the year in September after increasing 1.31 percent in August. The bigger year-over-year increase in wholesale prices in September was driven by food prices, which account for around 15 percent of the index and are often volatile. These rose 9.47 percent on the year after increasing 3.26 percent previously. Manufacturing prices, around 64 percent of the index, rose 1.00 percent on the year after a previous increase of 1.22 percent, while fuel prices, around 13 percent of the index, fell 4.05 percent on the year, weakening further from the previous increase of 0.67 percent.
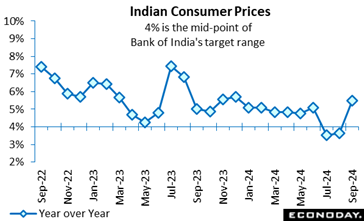 India's consumer price index rose 5.49 percent on the year in September, up sharply from an increase of 3.65 percent in August. This pushes headline inflation above the mid-point of the Reserve Bank of India's target range of two percent to six percent after it had been below that level in each of the previous two months. India's consumer price index rose 5.49 percent on the year in September, up sharply from an increase of 3.65 percent in August. This pushes headline inflation above the mid-point of the Reserve Bank of India's target range of two percent to six percent after it had been below that level in each of the previous two months.
The move higher in headline inflation was driven by food and fuel prices. Food and beverage prices rose 8.36 percent on the year, up from the 5.36 percent increase recorded previously, while fuel and light charges fell by a smaller amount, down 1.39 percent on the year after a previous decline of 5.31 percent. Inflation in urban areas rose from 3.14 percent in August to 5.05 percent in September, while inflation in rural areas accelerated from 4.16 percent to 5.87 percent.
At the RBI's most recent policy meeting, held last week, officials left policy rates on hold at 6.50 percent. Officials noted then that they expect base effects may send inflation higher in the near-term. They also advised that they are shifting their policy stance from "the withdrawal of accommodation" to "neutral". This, they judge, will provide them with greater flexibility in upcoming meetings while enabling them to continue monitoring the path of disinflation. They also repeated their earlier pledge to remain focused on achieving "a durable alignment of the headline CPI inflation with the target".
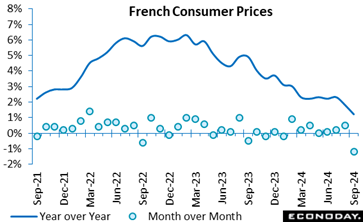 The final September data confirm a marked easing in inflation following an August report boosted by the effects of the Paris Olympics. Prices fell an unrevised 1.2 percent on the month, the steepest on record, reducing headline inflation from August's final 1.8 percent to downwardly revised 1.1 percent. The final September data confirm a marked easing in inflation following an August report boosted by the effects of the Paris Olympics. Prices fell an unrevised 1.2 percent on the month, the steepest on record, reducing headline inflation from August's final 1.8 percent to downwardly revised 1.1 percent.
Prices are seasonally soft in September and last month were driven by a hefty 4.8 percent decrease in transport costs, particularly airfares, and a 17.2 percent decline in accommodation prices.
Energy prices also continued to decrease, with a 3.5 percent decrease in petroleum products, while food prices experienced a minor decrease of 0.3 percent. Conversely, the cost of manufactured products, such as footwear and apparel, increased at a lesser rate. Inflation decreased from 1.8 percent in August to 1.1 percent year-over-year, primarily as a result of the lowering of service costs and the decline in energy prices. Core inflation followed suit, declining to from 1.7 percent to just 1.4 percent, matching its weakest mark since August 2021.
The HICP followed this trajectory, dropping a steeper revised 1.3 percent over the month and increasing 1.4 percent on the year.
In sum, today's report shows a clear reduction in inflation pressures that should go well at the ECB.
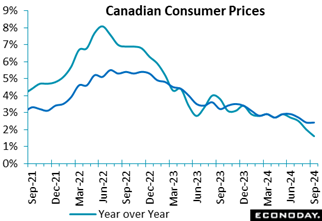 Canada's Consumer Price Index fell 0.4 percent in September on a monthly basis, after a 0.2 percent decline in August. On a seasonally adjusted monthly basis, the CPI is unchanged in September. Canada's Consumer Price Index fell 0.4 percent in September on a monthly basis, after a 0.2 percent decline in August. On a seasonally adjusted monthly basis, the CPI is unchanged in September.
Compared to September 2023, the CPI is up 1.6 percent, down from a 2 percent gain in August. This is the smallest yearly increase since February 2021 (+1.1 percent).
The main contributor to overall deceleration in consumer prices was lower prices for gasoline. Compared to a year ago, gasoline prices fell 10.7 percent in September compared with August's decline of 5.1 percent.
On a monthly basis, gasoline prices are down 7.1 percent in September following a 2.6 percent decline in August.
Excluding food and energy prices, the CPI declined 0.1 percent on a monthly basis, the same as in August. Compared to a year ago, the core CPI is up 2.4 percent in September, the same rate of increase as in August.
The average of the Bank of Canada's 'Alternative measures' of annual core inflation for September is 2.3 percent.
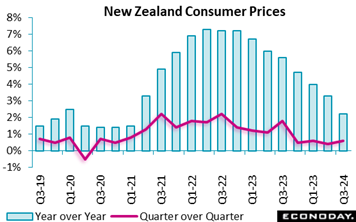 New Zealand consumer prices rose 2.2 percent on the year in the three months to September, down from 3.3 percent in the three months to June and matching the consensus forecast. Headline inflation has now fallen for six consecutive quarters and is back within the Reserve Bank of New Zealand's target range of 1.0 percent to 3.0 percent for the first time since early 2021. The index advanced 0.6 percent on the quarter after increasing 0.4 previously, also below the consensus forecast for an increase of 0.7 percent. New Zealand consumer prices rose 2.2 percent on the year in the three months to September, down from 3.3 percent in the three months to June and matching the consensus forecast. Headline inflation has now fallen for six consecutive quarters and is back within the Reserve Bank of New Zealand's target range of 1.0 percent to 3.0 percent for the first time since early 2021. The index advanced 0.6 percent on the quarter after increasing 0.4 previously, also below the consensus forecast for an increase of 0.7 percent.
The fall in headline inflation in the three months to September was largely driven by fuel prices, which fell 8.0 percent on the year, and vegetable prices, down 17.9 percent on the year. Education prices also fell sharply, down 4.0 percent on the year after a previous increase of 5.2 percent, as a result of a government rebate for early childhood education.
The RBNZ reduced the official cash rate by 50 basis points to 4.75 percent at its most recent meeting earlier in the month, following a 25-basis point cut at tis previous meeting. In the statement accompanying this month's decision, officials advised that they remain confident that inflation will fall back to within their target range of one percent to three percent this quarter and remain within that range over the forecast horizon. Today's fall in headline inflation may be enough to prompt officials to consider another rate cut at their next scheduled policy meeting late-November, though officials will also note the impact of the education rebate.
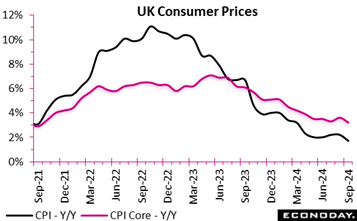 The consumer prices index growth slowed significantly to 1.7 percent in September, slightly below the consensus range and a reflection of the continued easing from its August rate of 2.2 percent, and a stark contrast to the 11.1 percent peak observed in October 2022. On a monthly basis, inflation remained relatively unchanged, a considerable shift from the 0.5 percent increase recorded in September 2023. This deceleration was largely driven by reductions in transport costs, particularly air fares and motor fuels, although rising prices in food and non-alcoholic beverages partially offset this decline. The consumer prices index growth slowed significantly to 1.7 percent in September, slightly below the consensus range and a reflection of the continued easing from its August rate of 2.2 percent, and a stark contrast to the 11.1 percent peak observed in October 2022. On a monthly basis, inflation remained relatively unchanged, a considerable shift from the 0.5 percent increase recorded in September 2023. This deceleration was largely driven by reductions in transport costs, particularly air fares and motor fuels, although rising prices in food and non-alcoholic beverages partially offset this decline.
Core inflation, which excludes volatile items like energy and food, also fell, with the CPI dropping to 3.2 percent year-over-year in September from 3.6 percent in August, reinforcing the trend of decreasing inflation in the goods and services sectors. Similarly, year-over-year, the CPIH (including housing costs) followed suit, rising by 2.6 percent annually, down from 3.1 percent in August, and core CPIH also fell from 4.3 percent to 4.0 percent.
Overall, the report highlights a broader moderation in inflationary pressures across multiple sectors, though food and beverage prices remain persistent sources of inflationary pressure.
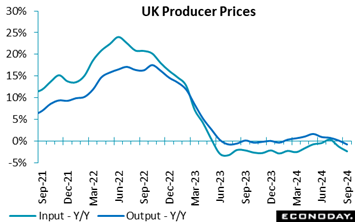 In September, producer prices reflected a notable downward trend, with input prices falling by 2.3 percent annually, compared to a 1.2 percent decrease in August. Output (factory gate) prices also dropped by 0.7 percent year-over-year, reversing from a 0.2 percent increase in August. This decline was largely driven by significant falls in the prices of crude oil inputs, which plunged by 23.3 percent year-over-year, contributing substantially to the inflation slowdown. Fuel prices followed suit, falling by 11.2 percent, with electricity costs for the domestic market being a key factor. In September, producer prices reflected a notable downward trend, with input prices falling by 2.3 percent annually, compared to a 1.2 percent decrease in August. Output (factory gate) prices also dropped by 0.7 percent year-over-year, reversing from a 0.2 percent increase in August. This decline was largely driven by significant falls in the prices of crude oil inputs, which plunged by 23.3 percent year-over-year, contributing substantially to the inflation slowdown. Fuel prices followed suit, falling by 11.2 percent, with electricity costs for the domestic market being a key factor.
However, there were some upward pressures, particularly from domestic food inputs, which rose by 1.7 percent year-over-year, largely due to poor potato crop yields. Services producer prices saw a 3.3 percent annual rise between July and September, slightly higher than the previous quarter. The largest downward contributions came from chemicals and paper products, which experienced price declines, though these were somewhat offset by increases in "other outputs," including soft drinks.
Overall, the fall in energy-related input costs, particularly crude oil and fuel, was the dominant force behind the drop in producer prices, but domestic food and certain service prices maintained upward inflation pressure.
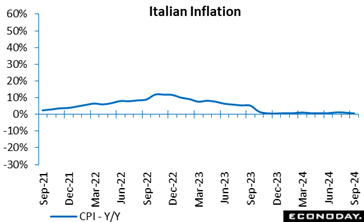 The final September consumer price index dropped by an unrevised 0.2 percent on a monthly basis leaving annual inflation also unchanged at 0.7 percent. The latter was down from August's 1.1 percent rate. The primary factor behind the deceleration was a significant drop in energy prices, both regulated (10.4 percent after 14.3 percent) and non-regulated (minus 11.0 percent after minus 8.6 percent). Inflation also eased in recreational, personal care and transport services. The final September consumer price index dropped by an unrevised 0.2 percent on a monthly basis leaving annual inflation also unchanged at 0.7 percent. The latter was down from August's 1.1 percent rate. The primary factor behind the deceleration was a significant drop in energy prices, both regulated (10.4 percent after 14.3 percent) and non-regulated (minus 11.0 percent after minus 8.6 percent). Inflation also eased in recreational, personal care and transport services.
Core inflation, excluding volatile items like energy and fresh food, also dipped slightly from 1.9 percent to 1.8 percent, again matching its provisional print, while the gap between goods and services remained stable.
The HICP, which, unlike the CPI, accounts for seasonal factors like summer sales, rose an unrevised 1.2 percent monthly but moderated to a downwardly revised 0.7 percent annual rate from 1.2 percent in August.
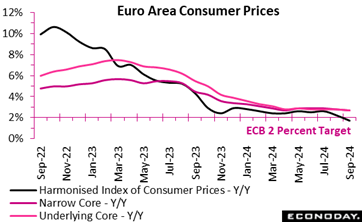 Inflation decelerated again in September and by more than originally reported. The HICP dipped a final 0.1 percent on the month, in line with its flash estimate but still reducing the yearly rate from August's final 2.2 percent to a downwardly amended 1.7 percent. This was its lowest reading since April 2021 and means that the rate now stands 0.3 percentage points below its medium-term target, the first negative gap in more than three years. Inflation decelerated again in September and by more than originally reported. The HICP dipped a final 0.1 percent on the month, in line with its flash estimate but still reducing the yearly rate from August's final 2.2 percent to a downwardly amended 1.7 percent. This was its lowest reading since April 2021 and means that the rate now stands 0.3 percentage points below its medium-term target, the first negative gap in more than three years.
The core rates were unrevised. The narrowest measure dropped from a yearly 2.8 percent rate to 2.7 percent, equaling its weakest mark since January 2022, while the wider measure that excludes just energy and unprocessed food also dropped 0.1 percentage point to 2.7 percent. Inflation in the key services category was trimmed to 3.9 percent, a couple of ticks less than in August but still stubbornly firm with only a broadly flat underlying trend. Lingering effects from the Paris Olympic Games might have been an issue. Elsewhere, the rate in non-energy industrial goods was confirmed and steady at just 0.4 percent while energy (minus 6.1 percent after minus 3.0 percent) had a significant negative impact and food, alcohol and tobacco (2.4 percent after 2.3 percent) a minimal positive effect.
Regionally, headline inflation fell in France (1.4 percent after 2.2 percent), Germany (1.8 percent after 2.0 percent), Italy (0.7 percent after 1.2 percent) and Spain (1.7 percent after 2.4 percent). Both the French and Italian rates were 0.1 percentage point lower than previously reported and all the four larger member states have national HICP inflation rates below the ECB's target.
The final September update will do nothing to undermine expectations of another 25-basis point cut in the key deposit rate at today's ECB announcement. Declining Sub-target headline and declining core Eurozone inflation should be well received at the ECB despite the relative stickiness of prices in services.
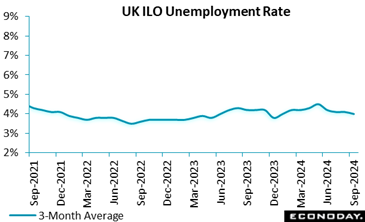 The new report suggests that the labour market as a whole was stronger than expected last quarter although wage growth is still slowing. The new report suggests that the labour market as a whole was stronger than expected last quarter although wage growth is still slowing.
Claimant count unemployment showed a higher-than-expected monthly increase of 27,900 but only after a sharply smaller revised 300 advance in August. The rate was 4.7 percent, unchanged from the previous period's upwardly revise level.
The ILO unemployment rate decreased slightly to 4.0 percent compared to the prior and consensus of 4.1 percent, suggesting a slight improvement in the broader unemployment situation. On this definition, joblessness was down 75,000 at 1.386 million, its third successive drop. However, employment rose a very healthy 373,000. More up to date, payrolled employees decreased 15,166 on the month in September, their third drop in the last four months and third quarter vacancies were off 34,000 and at 841,000, their lowest level since March-May 2021.
Meanwhile, average earnings saw annual growth in the three months to August ease to 3.8 percent, below the prior revised estimate and the consensus, both 4.1 percent. That said, regular earnings weighed in at a still high 4.9 percent, albeit down from 5.1 percent last time.
In summary, today's update is again very mixed and should leave investors uncertain about the outcome of next month's BoE MPC meeting. Crucially, wage growth is slowing but underlying earnings remain dangerously high the context of a 2 percent inflation target.
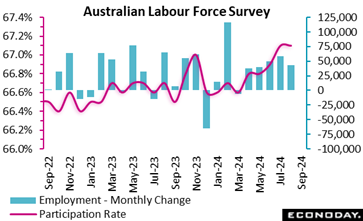 Labour market conditions in Australia strengthened further in September, with employment recording an increase well above the consensus forecast and the unemployment and participation rates continuing to indicate very tight conditions. This strength will likely keep the focus of the Reserve Bank of Australia on risks to the inflation outlook. Labour market conditions in Australia strengthened further in September, with employment recording an increase well above the consensus forecast and the unemployment and participation rates continuing to indicate very tight conditions. This strength will likely keep the focus of the Reserve Bank of Australia on risks to the inflation outlook.
The number of people employed in Australia rose by 47,500 in September, up from an increase of 42,600 in August and well above the consensus forecast for an increase of 23,700. Full-time employment rebounded with an increase of 51,600 persons after dropping 3,100 last month, while part-time employment rose by 12,500 persons after a previous increase of 50,600 persons. Hours worked rose 0.3 percent on the month after a previous increase of 0.4 percent.
Today's data also show the unemployment rate was unchanged at 4.2 percent in September. The participation rate rose from 67.1 to a new record high of 67.2 percent.
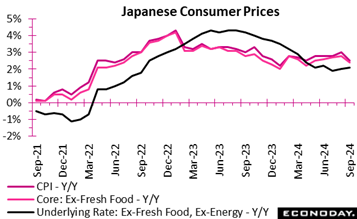 Consumer inflation in Japan decelerated to a five-month low of 2.4% in the core reading in September (vs. consensus 2.3%) after accelerating to 2.8% in August from 2.7% in July. The government temporarily resumed utility subsidies help ease inflation for three months, starting with electricity and natural gas bill payments in September. Consumer inflation in Japan decelerated to a five-month low of 2.4% in the core reading in September (vs. consensus 2.3%) after accelerating to 2.8% in August from 2.7% in July. The government temporarily resumed utility subsidies help ease inflation for three months, starting with electricity and natural gas bill payments in September.
The Bank of Japan is focused on medium-term inflation outlook. Its process of raising interest rates gradually toward more normal levels from around zero is not dictated by short-term fluctuations in CPI data.
The year-on-year increase in the total CPI stood at 2.5%, down from 3.0% in August (consensus 2.4%). Underlying inflation measured by the core-core CPI (excluding fresh food and energy) rose slightly to 2.1% from 2.0% the previous month (consensus 2.0%).
The slower total and core CPI was led by overall energy prices +6.0% (contribution +0.44 percentage point) in September vs. +12.0% (+0.90 point) in August; durable goods (including air conditioners) +6.5% (+0.09 point) +7.7% (+0.11 point). It was partially offset by the y/y ate of processed food prices +3.1% (+0.73 point) vs. +2.9% (+0.69 point). The slowdown was also due to a smaller 6.8% rise (+0.07 point) in hotel fees vs. +9.5% (+0.12 point).
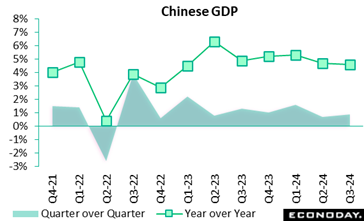 China's GDP rose 0.9 percent on the quarter in the three months to September, up from growth of 0.7 percent in the three months to June, with year-over-year growth easing from 4.7 percent to 4.6 percent, in line with the consensus forecast. Monthly activity data also published today stronger growth in key activity indicators but a sharper decline in house prices. China's GDP rose 0.9 percent on the quarter in the three months to September, up from growth of 0.7 percent in the three months to June, with year-over-year growth easing from 4.7 percent to 4.6 percent, in line with the consensus forecast. Monthly activity data also published today stronger growth in key activity indicators but a sharper decline in house prices.
Today's data follow a series of policy measures announced by Chinese officials in recent weeks in response to ongoing weakness in the property sector and sluggish growth in consumer spending and manufacturing output. Officials lowered the seven-day reverse repo rate, cut banks' reserve requirements, and announced government spending planned for next year would be brought forward.
In their statement accompanying today's data, officials characterized the data as showing the economy is "generally stable with steady progress" but noted "the complicated and severe external environment" and "new problems of domestic economic development". Officials, however, provided little guidance about whether additional changes to policy settings will be considered in the near-term.
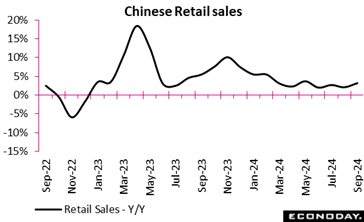 Chinese retail sales rose 3.2 percent on the year in September, picking up from growth of 2.1 percent in August. This is the biggest year-over-year increase since May but still well below growth recorded last year, with property market weakness continuing to weigh on consumer spending. Auto sales rebounded from a previous fall, while sales of household appliances and audiovisual equipment also rose at a faster pace. In month-over-month terms, retail sales rose 0.39 percent after falling 0.01 percent previously. Chinese retail sales rose 3.2 percent on the year in September, picking up from growth of 2.1 percent in August. This is the biggest year-over-year increase since May but still well below growth recorded last year, with property market weakness continuing to weigh on consumer spending. Auto sales rebounded from a previous fall, while sales of household appliances and audiovisual equipment also rose at a faster pace. In month-over-month terms, retail sales rose 0.39 percent after falling 0.01 percent previously.
Today's data follow a series of policy measures announced by Chinese officials in recent weeks in response to ongoing weakness in the property sector and sluggish growth in consumer spending and manufacturing output. Officials lowered the seven-day reverse repo rate, cut banks' reserve requirements, and announced government spending planned for next year would be brought forward.
In their statement accompanying today's data, officials characterized the data as showing the economy is "generally stable with steady progress" but noted "the complicated and severe external environment" and "new problems of domestic economic development". Officials, however, provided little guidance about whether additional changes to policy settings will be considered in the near-term.
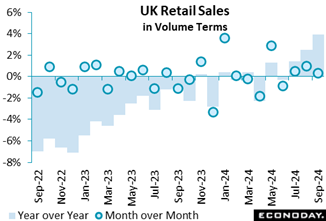 Retail sales volumes rose 0.3 percent month-over-month in September, well above market forecasts and following an unrevised and more robust 1.0 percent increase in August. This was their third straight advance. Annual sales growth was 3.9 percent, the strongest since February 2022, and after an upgrade to 2.3 percent in August. Retail sales volumes rose 0.3 percent month-over-month in September, well above market forecasts and following an unrevised and more robust 1.0 percent increase in August. This was their third straight advance. Annual sales growth was 3.9 percent, the strongest since February 2022, and after an upgrade to 2.3 percent in August.
Computers and telecommunications sales significantly boosted sales growth although supermarket sales experienced a slight decline. Excluding auto fuel, volumes were also up a monthly 0.3 percent.
The quarterly figures show a solid 1.9 percent increase, the largest since July 2021 and reflected broad-based gains. Even so, sales were still marginally (0.2 percent) below pre-pandemic levels of February 2020.
In sum, the data show retail sales gaining some momentum, with the technology sector being the primary driver. The upturn, at least in part, is probably attributable to the improvement in consumer confidence although this could prove short-lived ahead of what is widely expected to be a tight budget later this month.
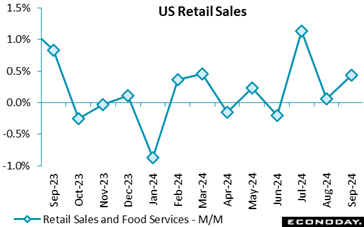 The dollar value of retail and food services sales is up 0.4 percent in September from August after an unrevised up 0.1 percent in August from July. The increase is a tenth above the consensus of up 0.3 percent in the Econoday survey of forecasters. The dollar value of retail and food services sales is up 0.4 percent in September from August after an unrevised up 0.1 percent in August from July. The increase is a tenth above the consensus of up 0.3 percent in the Econoday survey of forecasters.
Sales of motor vehicles are unchanged in September from August. An uptick in units sold in September did not translate into a higher dollar amount. Sales at gasoline service stations are down 1.6 percent in September from the prior month and reflect declining prices for motor fuels during the month. In September, motor vehicles accounted for 18.7 percent of the retail sales total and gasoline was a 7.2 percent share.
Retail sales excluding motor vehicles are up 0.5 percent in September from August after a small upward revision to up 0.2 percent in August from the prior month. The increase is well above the consensus of up 0.1 percent in the Econoday survey. Retail sales excluding motor vehicles and gasoline are up 0.7 percent in September from August and revised up a tenth to up 0.3 percent in August from July. This matches the consensus in the Econoday survey.
Where retail sales are strong in September suggests that purchases are along the lines of back-to-school merchandise, and perhaps some emergency preparedness spending.
Sales of clothing and accessories are up 1.5 percent in September. Many students wait to shop for clothing until after the start of school when peers' fashion choices can be taken into account. There are also increases of 0.5 percent for general merchandise stores and 0.3 percent for sporting goods, hobby, musical instrument, and bookstores which could include some last-minute school needs. Also, sales at health and personal care stores are up 1.1 percent.
Some consumers are eating out more with a 1.0 percent increase in restaurant sales and there is a 1.0 percent rise for food and beverage stores. It is possible that households without power ate at those restaurants that were open, and/or some stocking up happened before or after Hurricane Helene hit. There was also a rush to buys some items related to worries about the impact of dockworkers strike on the supply chain for consumer goods.
Sales at nonstore retailers – which include online stores – are up 0.4 percent in September and account for 17.4 percent of the sales total.
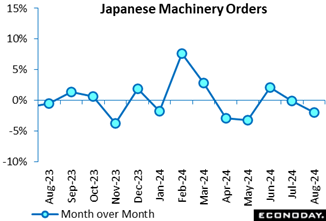 Japanese core machinery orders, the key leading indicator of business investment in equipment, posted their second straight drop in August, down 1.9% after edging down 0.1% in July and rising 2.1% in June. It was much weaker than the median economists forecast of a 0.3% drop. Japanese core machinery orders, the key leading indicator of business investment in equipment, posted their second straight drop in August, down 1.9% after edging down 0.1% in July and rising 2.1% in June. It was much weaker than the median economists forecast of a 0.3% drop.
From a year earlier, core orders, which track the private sector and exclude volatile orders from electric utilities and for ships, fell 3.4% for the first drop in two months after an 8.7% gain and a 1.7% dip, also coming in much weaker than the consensus call of a 3.6% increase.
The Cabinet Office maintained its assessment, saying, "The pickup in machinery orders is pausing."
Capex plans are generally supported by demand for automation amid labor shortages as well as government-led digital transformation and emission control.
The Bank of Japan's quarterly Tankan business survey for September showed major firms projected their plans for business investment in equipment would rise a combined 10.6% on year, below consensus of 11.9%, in fiscal 2024 ending on March 31, 2025, somewhat maintaining the solid pace after jacking them up to a 11.1% increase in the June survey from a cautious 4.0% gain projected in March.
Smaller firms raised their combined capital spending plans to an impressive 2.6% increase, as expected, after projecting a 0.8% drop in June, which was still up from a 3.6% dip planned in March. Smaller firms tend to have conservative plans at the start of each fiscal year and revise them up later.
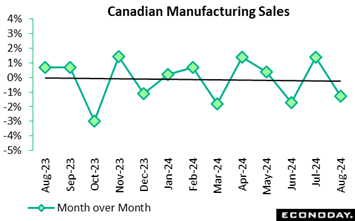 Manufacturing sales retreated by 1.3 percent in August from July, slightly better than expectations for a 1.5 percent decline. Real sales increased 0.8 percent on the month. In year-over-year terms, nominal sales plunged 4.4 percent and declined a bigger 5.1 percent in real terms. Manufacturing sales retreated by 1.3 percent in August from July, slightly better than expectations for a 1.5 percent decline. Real sales increased 0.8 percent on the month. In year-over-year terms, nominal sales plunged 4.4 percent and declined a bigger 5.1 percent in real terms.
Looking ahead, indicators continue to be bleak as new orders dropped 2.4 percent on the month and unfilled orders fell 0.8 percent.
Inventories declined 0.6 percent, and the inventory-to-sales ratio was rose to 1.75 in August from 1.74 in July and versus 1.67 a year ago.
The unadjusted capacity utilization rate rose to 79.6 percent in August from a revised 78.6 percent in July and versus 79.9 percent in August a year ago.
Manufacturing sales contracted in eight provinces in August, primarily in Alberta (-3.3 percent) and Ontario (-0.6 percent). Sales in Prince Edward Island were up the most (+2.3 percent).
The decline in August meant manufacturing sales came in at their lowest level since January 2022, mainly due to lower sales in the primary metal (-6.4 percent) as well as petroleum and coal product (-3.7 percent) subsectors.
Within primary metals, the decline was primarily due to lower sales of non-ferrous metals (except aluminum), and partially due to their lower prices (-1.7 percent) in August. "Weaker domestic and international demand for metals due to lower construction and manufacturing activities have pulled the prices of many primary metals lower in the past few months," StatsCan said.
Within the petroleum subsectors, the cost of refined petroleum energy products (including liquid biofuels) dove 5.8 percent in August, "partly due to increasing concerns over global economic growth and demand, particularly in China." On an annual basis, total sales of petroleum and coal products fell 7.9 percent in August.
Aerospace products and parts production rose 7.3 percent in August to their second highest level on record and was up 23.6 percent from the same month a year ago. Wood product sales rose 3.8%, with the prices of lumber and other wood products up 2.1 percent in August.
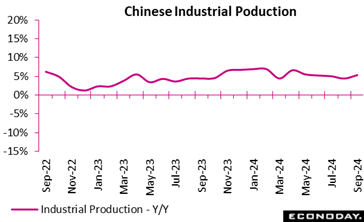 Chinese industrial production rose 5.4 percent on the year in September, picking up from growth of 4.5 percent in August. Within the industrial sector, manufacturing output rose 6.0 percent on the year after increasing 4.3 percent previously. Utilities output and mining output rose 6.3 percent and 2.9 percent on the year respectively after previous increases of 6.8 percent and 3.7 percent respectively. In month-over-month terms, industrial production rose 0.59 percent after increasing 0.32 percent previously. Chinese industrial production rose 5.4 percent on the year in September, picking up from growth of 4.5 percent in August. Within the industrial sector, manufacturing output rose 6.0 percent on the year after increasing 4.3 percent previously. Utilities output and mining output rose 6.3 percent and 2.9 percent on the year respectively after previous increases of 6.8 percent and 3.7 percent respectively. In month-over-month terms, industrial production rose 0.59 percent after increasing 0.32 percent previously.
Today's data follow a series of policy measures announced by Chinese officials in recent weeks in response to ongoing weakness in the property sector and sluggish growth in consumer spending and manufacturing output. Officials lowered the seven-day reverse repo rate, cut banks' reserve requirements, and announced government spending planned for next year would be brought forward.
In their statement accompanying today's data, officials characterized the data as showing the economy is "generally stable with steady progress" but noted "the complicated and severe external environment" and "new problems of domestic economic development". Officials, however, provided little guidance about whether additional changes to policy settings will be considered in the near-term.
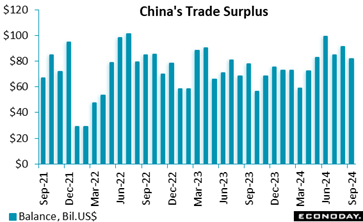
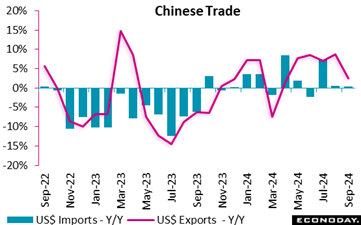
China's trade surplus in US dollar terms narrowed to $81.71 billion in September from $91.02 billion in August. Exports rose 2.4 percent on the year in September after increasing 8.7 percent in August, while imports rose 0.3 percent on the year after a previous increase of 0.5 percent.
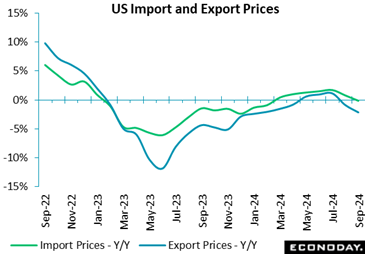 The import price index is down 0.4 percent in September from August after a small upward revision to down 0.2 percent in August from July. The September decrease is just below the consensus of down 0.3 percent in the Econoday survey of forecasters. The import price index is down 0.1 percent compared to a year ago. Generally, costs for imported goods have eased significantly and are not a major source of upward prices pressures for inflation. The import price index is down 0.4 percent in September from August after a small upward revision to down 0.2 percent in August from July. The September decrease is just below the consensus of down 0.3 percent in the Econoday survey of forecasters. The import price index is down 0.1 percent compared to a year ago. Generally, costs for imported goods have eased significantly and are not a major source of upward prices pressures for inflation.
The index for fuel imports is down 7.0 percent month-over-month in September while the index for nonfuel imports is up 0.1 percent month-over-month. Imported fuel prices are down 7.1 percent in September for petroleum and products, down 14.5 percent for natural gas, and down 5.8 for coals and gas. The index for imported foods, feeds and beverages is down 1.5 in September, and industrial supplies are down 1.8 percent.
The index for imported capital goods is unchanged in September from August, up 0.2 percent for automotive, and up 0.2 percent for consumer goods excluding automotive.
The index for import air freight services is up 4.8 percent in September from the prior month and up 21.0 percent from a year ago. The cost of bringing goods into the US by air will continue to be a source of upward price pressure for some commodities. Import passenger air fares are up 13.9 percent in September from August and 0.7 percent higher than a year ago.
The export price index is down 0.7 percent in September from August after revision lower to down 0.9 percent in August from July. The September decrease is below the consensus of down 0.4 percent in the Econoday survey. The export price index is down 2.1 percent from September 2023.
The index for exported agricultural commodities is up 0.6 percent in September from August while the index for nonagricultural commodities is down 0.9 percent. The export price index for foods, feeds, and beverages is up 0.9 percent in September. The index for industrial supplies and materials is down 2.4 percent.
The export capital goods index is up 0.2 percent in September from August, automotive is down 0.1 percent, and consumer goods excluding automotive is up 0.3 percent.
The index for export air freight services is down 0.7 percent in September from the prior month and down 4.3 percent from a year ago. The index for export air passenger fare is down 1.4 percent in September and down 0.9 percent from a year ago. The cost of travel abroad has moderated and shipping goods out is a somewhat lower.
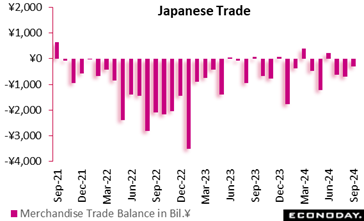 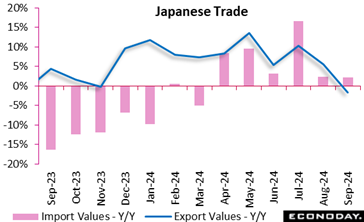 Japanese export values fell 1.7% for their first year-on-year drop in September, led by a pullback in automobiles as well as declines in mineral fuels and construction/mining equipment, Japanese export values fell 1.7% for their first year-on-year drop in September, led by a pullback in automobiles as well as declines in mineral fuels and construction/mining equipment,
Equipment, offsetting continued solid demand for semiconductor-producing equipment. It followed a revised 5.5% gain in August and came in weaker than the median economist call of a 1.1% fall. Import values marked a sixth straight rise, up 2.1%, led by computers, semiconductor-producing equipment and drugs while crude oil purchases dropped. It was larger than the consensus forecast of a 1.7% rise.
The trade balance posted a ¥294.3 billion deficit for a third consecutive shortfall after a revised ¥703.20 billion deficit in August and compared with a ¥60.6 billion surplus in September 2023 and a record shortfall of ¥3,506.43 billion (¥3.51 trillion) hit in January 2023.
Shipments to China, a key export market for Japanese goods, posted their first year-on-year drop in 10 months, down 7.3%, hit by lower demand for autos and auto parts and mineral fuels, as the world's second largest economy continues to fight the drag from its property market problems. Japanese exports to the European Union fell 9.0% for the sixth straight fall, hit by lingering sluggish demand for automobiles, iron and steel and construction machinery. Even exports to the United States fell 2.4% on autos and construction machinery, after marking their first drop in 35 months (down 0.7%) in August.
In its monthly economic report for September, the government maintained its overall assessment after upgrading it slightly in August, saying the economy is "recovering at a moderate pace, although there are some areas where it is pausing." Exports are "nearly flat."
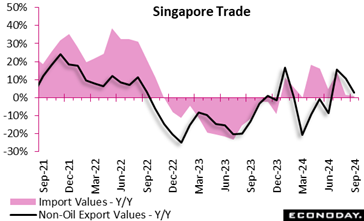 Singapore's non-oil domestic exports rose 2.7 percent on the year in September after increasing 10.7 percent in August and rose 1.1 percent on the month after a previous decline of 4.7 percent. Imports rose 1.8 percent on the year in September after advancing 1.5 in August and fell 2.4 percent on the month after dropping 2.4 percent previously. Singapore's non-oil domestic exports rose 2.7 percent on the year in September after increasing 10.7 percent in August and rose 1.1 percent on the month after a previous decline of 4.7 percent. Imports rose 1.8 percent on the year in September after advancing 1.5 in August and fell 2.4 percent on the month after dropping 2.4 percent previously.
Exports of electronics products increased 4.0 percent on the year in September after surging 35.1 percent in August, while year-on-year growth in exports of non-electronic slowed from 3.6 percent to 2.3 percent. Performance was mixed across major trading partners. Exports to China were flat on the year, exports to United States and Japan fell, and exports to the European Union and South Korea recorded strong growth.
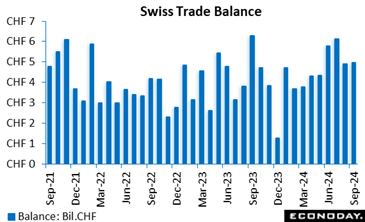 The merchandise trade surplus widened slightly from a larger revised CHF4.74 billion in August to CHF4.95 billion in September. However, it was well short of the CH6.36 billion posted a year ago. The yearly deterioration reflected a 9.1 percent drop in exports, accelerating sharply from a 0.9 percent fall in mid-quarter, that easily more than offset a 4.6 percent decline in imports. The merchandise trade surplus widened slightly from a larger revised CHF4.74 billion in August to CHF4.95 billion in September. However, it was well short of the CH6.36 billion posted a year ago. The yearly deterioration reflected a 9.1 percent drop in exports, accelerating sharply from a 0.9 percent fall in mid-quarter, that easily more than offset a 4.6 percent decline in imports.
Seasonally adjusted, the surplus stood at CHF3.90 billion, down from August's upwardly revised CHF4.02 billion and a 5-month low. Exports decreased 1.4 percent on the month, their third straight fall, while imports were off 1.1 percent. Imports have not risen since April. The real trade balance also worsened appreciably as a 3.5 percent decrease in export volumes was compounded by a 0.6 percent rise in imports.
Today's update points to a negative contribution from net merchandise exports to real GDP growth in the third quarter.
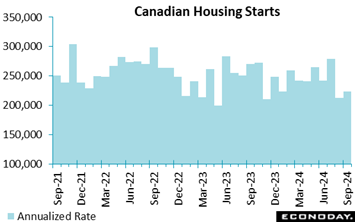 Housing starts improved by 5 percent in September to a seasonally adjusted annual rate of 223,808 from a revised 213,012 in August. The July figure missed Econoday's consensus expectation of 226,000. Housing starts improved by 5 percent in September to a seasonally adjusted annual rate of 223,808 from a revised 213,012 in August. The July figure missed Econoday's consensus expectation of 226,000.
The six-month trend for total housing starts declined 1.9 percent to 243,759 in September from 246,972 units in August.
The trend measure is a six-month moving average of the SAAR of total housing starts for all areas in Canada. The latest figures suggest housing starts remain sluggish despite loosening financial conditions.
For cities with population of 10,000 or more, actual housing starts rose 2 percent year to date from the same period last year. Growth in year-to-date housing starts has been driven by multi-unit and single unit starts in Alberta, Quebec and the Atlantic provinces. By contrast, year-to-date starts in Ontario and British Columbia are down across all housing types.
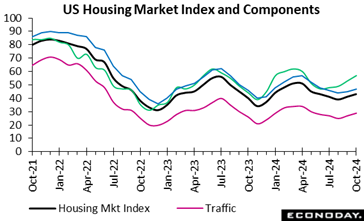 The NAHB/Wells Fargo housing market index is up 2 points to 43 in October from the prior month. It is just above the consensus of 42 in the Econoday survey of forecasters. The index is now up for a second month in a row and back to the 43 seen in June. Homebuilders are navigating a difficult period regarding demand for new housing stock. There are more existing units on the market at a time when potential homebuyers remain sensitive to mortgage rates and prices. The NAHB/Wells Fargo housing market index is up 2 points to 43 in October from the prior month. It is just above the consensus of 42 in the Econoday survey of forecasters. The index is now up for a second month in a row and back to the 43 seen in June. Homebuilders are navigating a difficult period regarding demand for new housing stock. There are more existing units on the market at a time when potential homebuyers remain sensitive to mortgage rates and prices.
Builders got a boost in the near term in September when rates mortgage rates were on the decline, but early October has seen these rising again. The rate on a Freddie Mac 30-year fixed rate mortgage was 6.35 percent in the September 5 week, fell to 6.08 percent in the September 26 week, and has risen to 6.32 percent as of the October 10 week. There will be homebuyers who locked in a mortgage at a lower rate in September who will be in the market for a home before the lock expires. There is also expectation that the FOMC will lower short-term rates further in November and December that should help bring rates down again, although financial market uncertainty until after the election may delay that.
The index for single-family sales in October is up to 47, its highest since 48 in June. The index for expected single-family home sales is up to 57, its highest since 60 in April. The index for buyer traffic is up to 29 in October, the firmest since 30 in May. Taken together, homebuilders are seeing improved conditions overall but are not as optimistic as they were early this year.
In September, 32 percent of homebuilders said they had cut prices, the same as in September and October 2023. The average price reduction in October is 6 percent, up from 5 percent in September, and the same as in October 2023. Among homebuilders, 62 percent said they offered some sort of incentives, up from 61 percent in September and the same as October 2023.
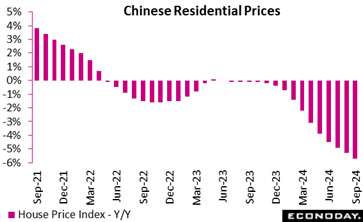 China's residential property prices fell 5.7 percent on the year in September, weakening further from a decline of 5.3 percent in August. This is the biggest year-over-year decline in house prices since 2015. China's property market has been very weak for two years, representing a major drag on investment and consumer spending. China's residential property prices fell 5.7 percent on the year in September, weakening further from a decline of 5.3 percent in August. This is the biggest year-over-year decline in house prices since 2015. China's property market has been very weak for two years, representing a major drag on investment and consumer spending.
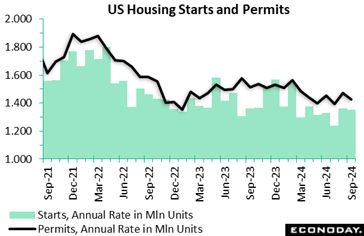 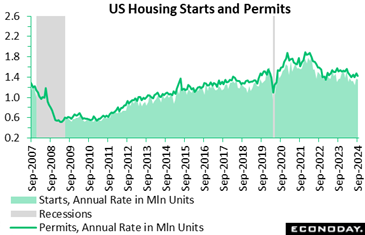 Starts of new homes are down 0.5 percent in September to 1.354 million units at a seasonally adjusted annual rate after a small upward revision to 1.361 million units in August. The September level is below the consensus of 1.400 million units in the Econoday survey of forecasters. However, the decrease in September is concentrated in a 9.4 percent drop in starts of multi-unit homes to 327,000 while starts of single-family homes are up 2.7 percent to 1.027 million units. Starts of new homes are down 0.5 percent in September to 1.354 million units at a seasonally adjusted annual rate after a small upward revision to 1.361 million units in August. The September level is below the consensus of 1.400 million units in the Econoday survey of forecasters. However, the decrease in September is concentrated in a 9.4 percent drop in starts of multi-unit homes to 327,000 while starts of single-family homes are up 2.7 percent to 1.027 million units.
Compared to September a year ago, total housing starts are down 0.7 percent with starts of single-family homes units up 5.5 percent and multi-units down 16.2 percent. Single-family starts are benefiting from a fall in mortgage rates that improve affordability for homebuyers, while multi-unit starts reflect that most homebuyers would prefer a single-family unit if they can afford it. The Freddie Mac rate for a 30-year fixed rate mortgage had a monthly average of 6.18 percent in September, down from 6.44 percent in August and well below 7.20 percent in September 2023.
Permits issued are down 2.9 percent in September to 1.428 million units after a small downward revision to 1.470 million units in August. The September level is below the consensus of 1.500 million units in the Econoday survey. The September decline is due to an 8.9 percent drop in permits for multi-unit projects to 458,000, while permits for single-family homes eked out a 0.3 percent increase to 970,000.
Compared to September 2023 total permits issued are down 5.7 percent with single-family permits down 1.2 percent and multi-unit permits down 14.1 percent. Demand for new construction has cooled since more inventory has come on the market in the existing unit segment of home sales.
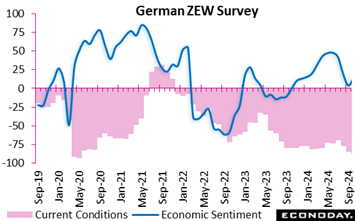 The ZEW indicator for September shows a surprising rebound in economic sentiment for Germany, rising by 9.5 points to 13.1 after a previous decline, yet this shift paradoxically reflects growing pessimism about the country's economic future. While sentiment has technically improved, it still suggests that economic confidence remains fragile. Simultaneously, the assessment of the current economic situation worsened, dropping further to minus 86.9 points from minus 84.5, signalling deep concerns about the present state of the economy. The ZEW indicator for September shows a surprising rebound in economic sentiment for Germany, rising by 9.5 points to 13.1 after a previous decline, yet this shift paradoxically reflects growing pessimism about the country's economic future. While sentiment has technically improved, it still suggests that economic confidence remains fragile. Simultaneously, the assessment of the current economic situation worsened, dropping further to minus 86.9 points from minus 84.5, signalling deep concerns about the present state of the economy.
The report underscores the diminishing hope for a quick recovery, with optimism and pessimism now equally balanced. Even though the market has largely factored in the ECB's recent interest rate decisions, pessimism in Germany persists. The situation indicator also worsened to minus 40.4 points, highlighting deteriorating conditions. In the eurozone, economic sentiment dropped by 8.6 points to 9.3, indicating broader regional challenges.
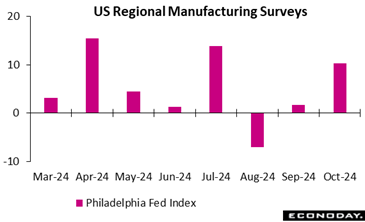 Philly Fed manufacturing topped expectations at 10.3 in October, up from a very modest 1.7 in September. Expectations called for a slight uptick to 3.0. Philly Fed manufacturing topped expectations at 10.3 in October, up from a very modest 1.7 in September. Expectations called for a slight uptick to 3.0.
New orders bounced to 14.2 from minus 1.5 in September, a very good omen for future business activity. As a very early barometer of manufacturing business, somewhat promising! Employment, on the other hand, contracted at minus 2.2 in October versus 10.7 in September.
Six-month expectations also surged, up to 36.7 in October from an already decent 15.8 in September. That suggests something is exciting manufacturers in the Philadelphia district. Is it the 50 bp rate cut from the Fed? It will be interesting to see if other regional Fed manufacturing surveys confirm this result, and then if the biggie, the ISM manufacturing survey, follows suit.
The global economy is moving in line with expectations.
For the first time since early August and mainly due upside surprises out of China, Econoday’s Relative Economic Performance Index (RPI) last week climbed back above zero. However, at just 4, the index only shows recent global economic activity broadly matching market forecasts.
In the U.S., the latest data signal overall economic activity modestly outpacing expectations. The RPI ended the week at 10 and the RPI-P at 19. Both gauges have been almost solely in positive surprise territory since early September, making another 50-basis point cut by the Federal Reserve in November unlikely.
In Canada, surprising strength in housing and the manufacturing sector lifted the RPI to 1, to all intents and purposes indicating that recent economic activity in general was running in line with forecasts. Excluding inflation indicators, the RPI-P (13) shows limited outperformance but it is the weakness of prices that has left investors confident that the Bank of Canada will cut interest rates by at least a further 25 basis points on Wednesday.
In the Eurozone, recent data have fairly consistently undershot already soft market forecasts meaning that last week’s 25 basis point cut by the European Central Bank came as no surprise to anyone. Closing out the period at minus 9 and exactly zero respectively, the RPI and RPI-P suggest that a third successive ease in December is very possible.
In the UK, the latest data trimmed the RPI to minus 5 but nudged the RPI-P a notch higher to 23 - the difference between the two reflecting a surprisingly weak inflation picture. As such, the gap increases the chances of Bank Rate being cut again next month, especially after what will be a tight Budget on 30 October.
In Switzerland, further unexpectedly strong disinflationary signals in manufacturing similarly saw the gap between the RPI (zero) and RPI-P (25) widen significantly. Real economic activity has been running slightly ahead of forecasts since the end of August but, with price pressures in general so weak, investors continue to anticipate another cut in the Swiss National Bank’s policy rate in December.
In Japan, the RPI (23) and RPI-P (8) both slipped temporarily below zero before closing out the week back in positive surprise territory on the back of a surprisingly firm inflation update. Investors remain uncertain about the timing of the next Bank of Japan tightening but the upcoming wage round will clearly be a key factor.
On balance, last week’s stream of Chinese data was on the strong side of expectations and firm enough to lift the RPI and RPI-P (both 7) above zero for the first time since late July. Even so, with economic growth the slowest since early 2023 and house price deflation the steepest since May 2015, the data still underline the need for the recently announced monetary and fiscal stimulus packages.
**Contributing to this article were Jeremy Hawkins, Brian Jackson, Mace News, Max Sato, Olajide Oyadeyi, and Theresa Sheehan
Starting off Monday is Germany’s producer price index which is estimated to fall 0.25 percent month over month, after rising 0.2 percent in August.
Wednesday will have Canada’s monetary policy report and US existing home sales data release.
Bank of Canada is expected to cut its policy interest rate by 50 basis points to 3.75 percent. This follows a 25-basis point cut to 4.25 percent last month. US existing home sales are expected to rise at a 3.9 million annual rate in October after falling 2.5 percent to 3.860 million units in September. Also in US reports Wednesday, the release of the Beige Book covering the period between late August and mid-October will show the impacts from Hurricanes Helene and Milton, reports out of Atlanta, Richmond, and St. Louis. This could well pull the overall tone of the report down, and coming on the heels of a lackluster assessment of conditions in the prior Beige Book, it could cause some handwringing about the US economy.
In Thursday’s reports, South Korean GDP is expected to rise 2.1 percent year over year, and the PMI composite flash for the UK is expected to expand in both composite, manufacturing, and services in its flash release.
Germany PPI for September (Mon 0800 CEST; Mon 0600 GMT; Mon 0200 EDT)
Consensus Forecast, Month over Month: -0.3%
Consensus Range, Month over Month: -0.4% to 0.1%
Consensus Forecast, Year over Year: -1.2%
Consensus Range, Year over Year: -1.2% to -0.8%
After rising 0.2 percent in August, Germany’s producer price index is estimated to drop 0.3 percent month over month. Year over year it is expected to decline further from August’s 0.8 percent to 1.2 percent.
US Leading Indicators for September (Mon 1000 EDT; Mon 1400 GMT)
Consensus Forecast, Month over Month: -0.3%
Consensus Range, Month over Month: -0.4% to 0.1%
Forecasters look for another negative showing for the US index of leading indicators, down 0.3 percent on the month, for a seventh consecutive decline. The big negative has been declining new orders, which suggests more weakness ahead.
US Richmond Fed Manufacturing Index for October (Tue 1000 EDT; Tue 1400 GMT)
Consensus Forecast, Index: -16.5
Consensus Range, Index: -20.0 to -15.0
The Richmond Fed’s manufacturing index is seen contracting at minus 16.5, which is still a modest improvement from September’s minus 21.
Canada Bank of Canada Announcement (Wed 0945 EDT; Wed 1345 GMT)
Consensus Forecast, Change: -50 bps
Consensus Range, Change: -50 bps to -25 bps
Consensus Forecast, Level: 3.75%
Consensus Range, Level: 3.75% to 4%
After a series of 25 basis point rate cuts have evidently failed to stem the erosion in Canada’s economy, the Bank of Canada is expected to cut rates more aggressively by 50 basis points to lower the target overnight rate to 3.75 percent.
US Existing Home Sales for September (Wed 1000 EDT; Wed 1400 GMT)
Consensus Forecast, Annual Rate: 3.9 M
Consensus Range, Annual Rate: 3.8 M to 4.0 M
US existing home sales are expected to rise at a 3.9 million seasonally adjusted annual rate, a slight uptick from August’s 3.86 million annual rate.
Eurozone EC Consumer Confidence Flash for October (Wed 1600 CEST; Wed 1400 GMT; Wed 1000 EDT)
Consensus Forecast, Index: -12.3
Consensus Range, Index: -12.8 to -11
Consumer confidence for the euro area is expected to be minus 12.3, a slight improvement from September’s minus 12.9.
South Korea GDP for Q3 (Thu 0800 KST; Wed 2300 GMT; Wed 1900 EDT)
Consensus Forecast, Year over Year: 2.1%
Consensus Range, Year over Year: 2% to 2.5%
South Korea’s GDP this quarter is expected to rise 2.1 percent year over year. This is slightly less than last quarter where the GDP rose 2.3 percent year over year.
Germany PMI Composite Flash for October (Thu 0930 CEST; Thu 0730 GMT; Thu 0330 EDT)
Consensus Forecast, Composite Index: 47.6
Consensus Range, Composite Index: 46.9 to 47.8
Consensus Forecast, Manufacturing Index: 40.8
Consensus Range, Manufacturing Index: 40.4 to 41.2
Consensus Forecast, Services Index: 50.6
Consensus Range, Services Index: 49.8 to 51
Germany’s composite index is expected to contract at 47.6, similar to September’s 47.5. The manufacturing index is expected to hold steady at 50.6, the same as last month and indicating a slight expansion, while the services index is expected to fall to 49.4 from 49.6 in August.
Eurozone PMI Composite Flash for October (Thu 1000 CEST; Thu 0800 GMT; Thu 0400 EDT)
Consensus Forecast, Composite Index: 49.4
Consensus Range, Composite Index: 49.2 to 50.1
Consensus Forecast, Manufacturing Index: 45.1
Consensus Range, Manufacturing Index: 44.8 to 45.3
Consensus Forecast, Services Index: 51.2
Consensus Range, Services Index: 50.8 to 51.7
The euro area composite index is expected to contract at 49.4, a slight decline from September’s 49.4. The manufacturing index is also expected to continue to decline at 45.1, no better than September’s 45.0. The services industry, however, is expected to expand at 52.7, though at a slower pace than in September.
UK PMI Composite Flash for October (Thu 0930 BST; Thu 0830 GMT; Thu 0430 EDT)
Consensus Forecast, Composite Index: 52.7
Consensus Range, Composite Index: 52.3 to 53
Consensus Forecast, Manufacturing Index: 51.7
Consensus Range, Manufacturing Index: 51.5 to 51.8
Consensus Forecast, Services Index: 52.4
Consensus Range, Services Index: 52 to 52.7
The UK PMI composite index is expected to rise to 52.7, signaling the expansion of the industry similar to that of September. The manufacturing index is expected to rise to 51.7, expanding again but at a faster pace than seen in September where the manufacturing index then was at 51.5. The services index is expected to hold steady at 52.4. The PMI composite Flash for the UK is expected to expand all round.
US Jobless Claims (Thu 0830 EDT; Wed 1230 GMT)
Consensus Forecast, Initial Claims - Levels: 247.0 K
Consensus Range, Initial Claims - Levels: 225.0 K to 260.0 K
Initial jobless claims in the US are expected to rise to 247 thousand, more than the prior week’s 241 thousand. This is due to the expected surge in filings following hurricanes and possibly to a lesser extent the Boeing strikes.
US PMI Composite Flash for October (Thu 0945 EDT; Thu 1345 GMT)
Consensus Forecast, Manufacturing Index: 47.6
Consensus Range, Manufacturing Index: 47.4 to 48.2
Consensus Forecast, Services Index: 55.0
Consensus Range, Services Index: 54.5 to 55.2
The US PMI manufacturing index is expected to contract at 47.6, while the service index is expected to expand at 55.0, slightly less than September’s 55.2 but still an improvement overall.
US New Home Sales for September (Thu 1000 EDT; Thu 1400 GMT)
Consensus Forecast, Annual Rate: 718.0 K
Consensus Range, Annual Rate: 700.0 K to 735.0 K
New home sales for September are expected to increase to 718 thousand after falling to 716 thousand in August from July’s 751 thousand.
Germany Ifo Survey for October (Fri 1000 CEST; Fri 0800 GMT; Fri 0400 EDT)
Consensus Forecast, Business Climate: 85.7
Consensus Range, Business Climate: 85.4 to 86
Consensus Forecast, Current Conditions: 84.3
Consensus Range, Current Conditions: 84.2 to 84.5
Consensus Forecast, Business Expectations: 86.7
Consensus Range, Business Expectations: 86.6 to 87
German business sentiment has been gloomy lately and the October report is not expected to show much change. Business climate is expected to rise from 85.4 in September to 85.7 in October. This brings business climate closer to August’s high of 86.6. Current conditions are estimated to reach 84.3, a tick less than last month’s 84.4. Business expectations on the other hand are expected to rise to 86.7, higher than last month’s 86.3.
Eurozone M3 Money Supply for September (Fri 1000 CEST; Fri 0800 GMT; Fri 0400 EDT)
Consensus Forecast, Y/Y – 3-Month Moving Average: 2.9%
Consensus Range, Y/Y – 3-Month Moving Average: 2.9% to 3.3%
Money supply for the euro area is expected to rise 2.9 percent, more than August’s 2.5 percent increase.
Canada Retail Sales for August (Fri 0830 EDT; Fri 1230 GMT)
Consensus Forecast, Month over Month: 0.5%
Consensus Range, Month over Month: 0.5% to 0.6%
Canada’s retail sales for august is expected to increase 0.5 percent, slightly less than July’s 0.9 percent increase.
US Durable Goods Orders for September (Fri 0830 EDT; Fri 1230 GMT)
Consensus Forecast, New Orders – M/M: -0.5%
Consensus Range, New Orders – M/M: -5.0% to 1.0%
Consensus Forecast, Ex-Transportation – M/M: -0.1%
Consensus Range, Ex-Transportation – M/M: -0.9% to 0.2%
New orders for durable goods are expected to fall 0.5 percent month over month for September after showing no change in August. Excluding transportation, new orders are expected to fall 0.1 percent following August’s 0.5 percent increase.
US Consumer Sentiment for October (Fri 1000 EDT; Fri 1400 GMT)
Consensus Forecast, Index: 69.0
Consensus Range, Index: 68.5 to 70.0
Consumer sentiment is expected to reach 69.0, a slight uptick from September’s 68.9. One-year inflation expectations are seen flat at 2.9 percent.
|